







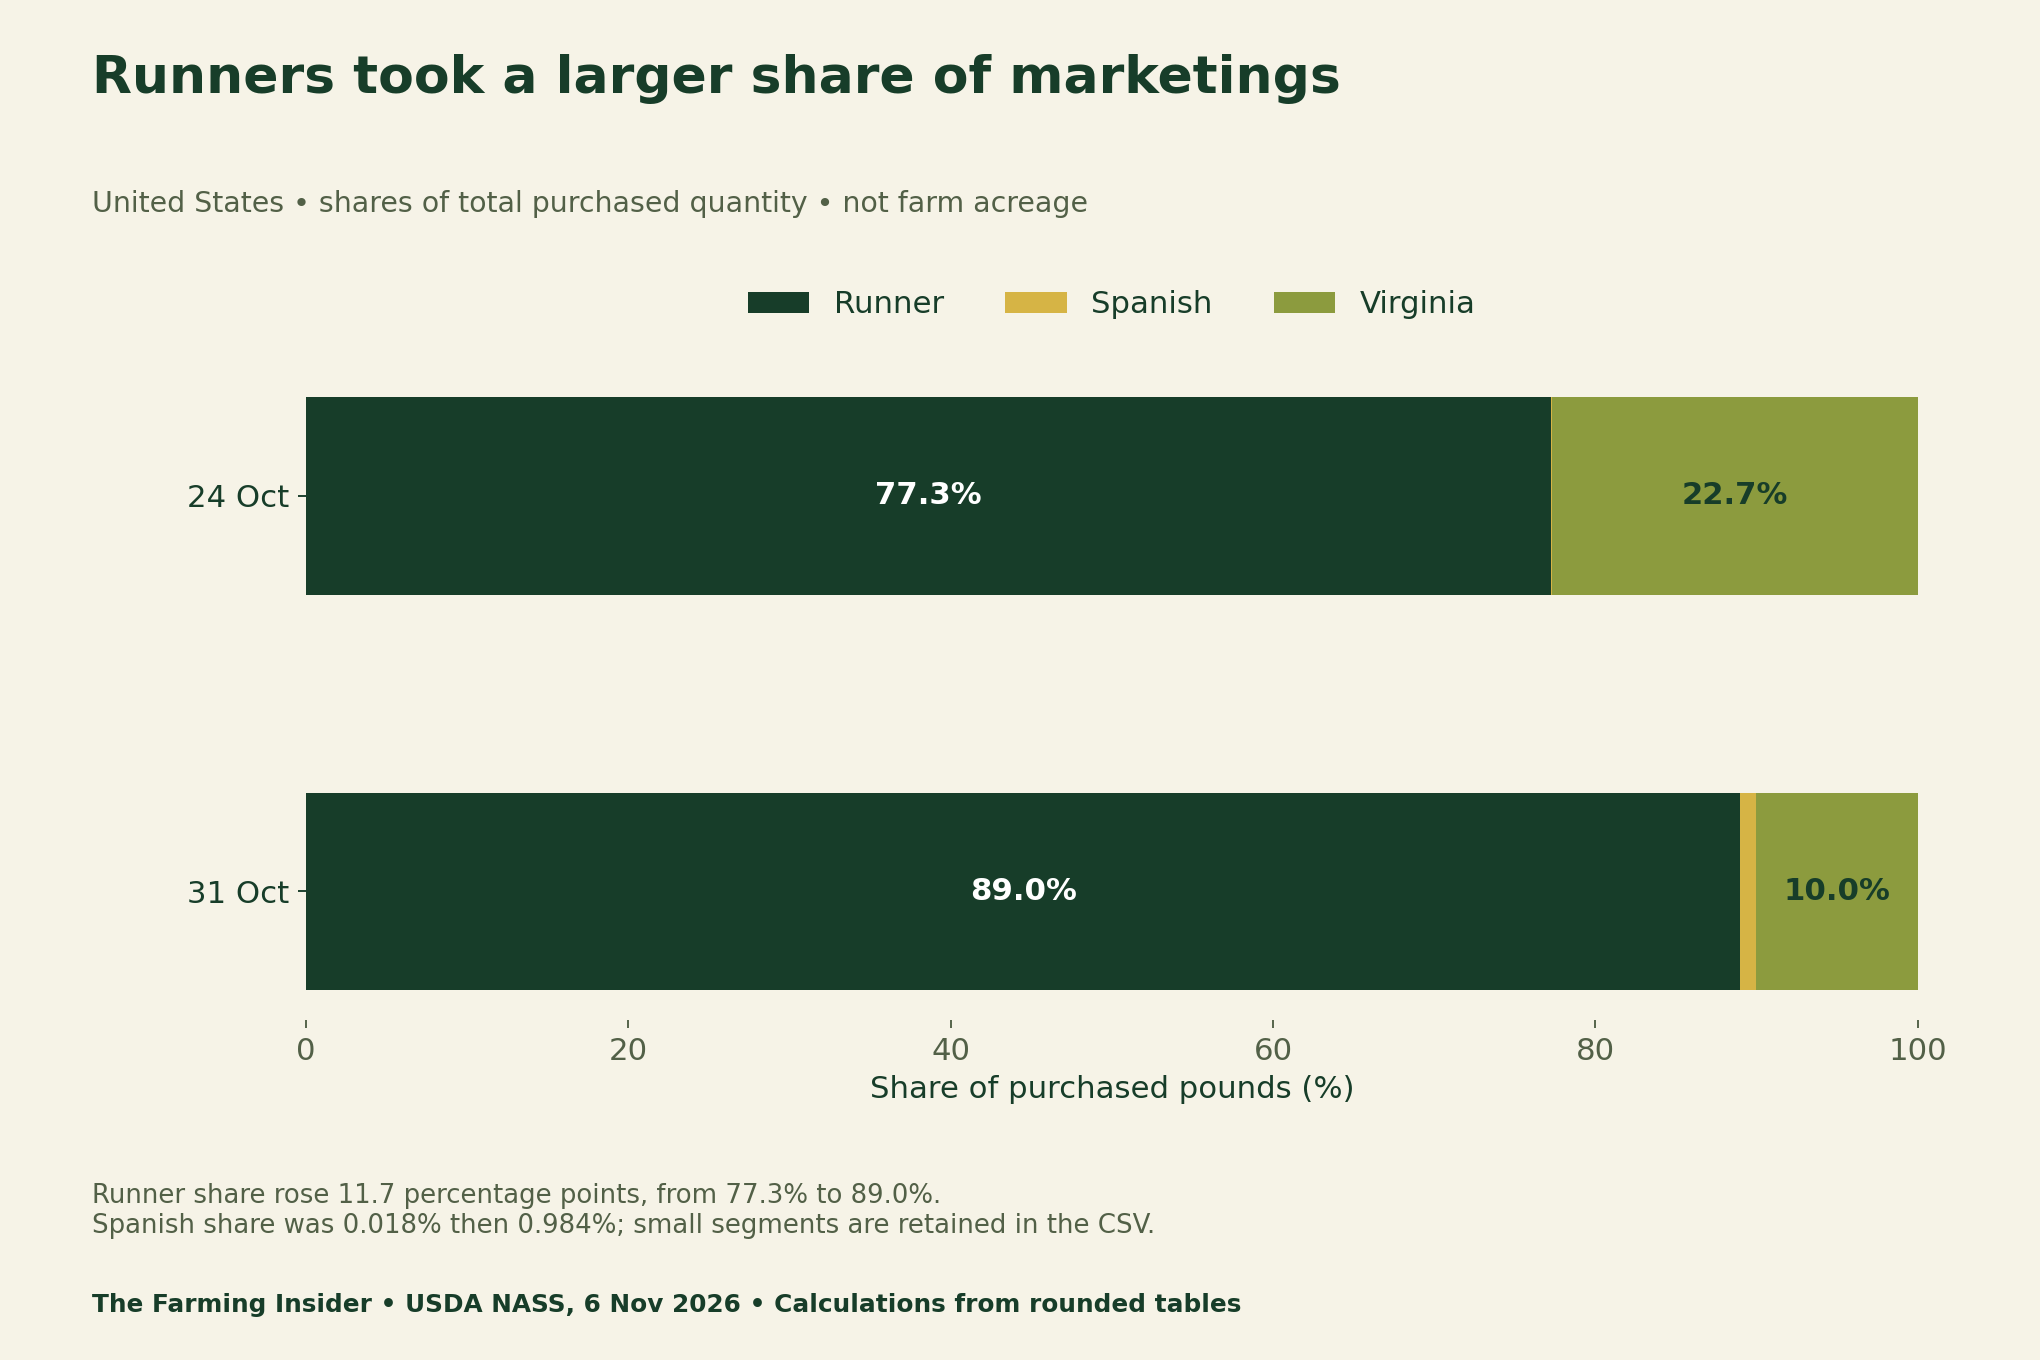
US peanut prices by type tell a different story from the all-peanut headline. In the latest USDA report, the national average rose from $0.213 to $0.227 per pound. At the same time, runners increased their share of purchased pounds from 77.3% to 89.0%. A matching crop-type benchmark is therefore more useful than the headline alone when reviewing a settlement.
Featured image: AI-generated conceptual farm still life; tray contents are not a scientific identification of peanut types or a depiction of the USDA sample.
This report provides four original charts, a rounded-input decomposition and four free CSV tools. The calculation separates changing type averages from changing marketed weights. It does not establish a fair price for a particular farm, explain causality or forecast the market. Research checked on 9 November 2026.
Read US peanut prices by type and observation date
The USDA NASS Peanut Prices release dated 6 November 2026 reports its newest observations for the week ending 31 October. The comparison week ends 24 October. Both columns come from the same release, so the analysis keeps one revision vintage. These are not November farm-sale observations.
NASS obtains pounds purchased and dollars paid from first buyers of farmer-stock peanuts. Its methodology covers all qualities and grades and excludes seed peanuts. Estimates expand reported purchases and payments for non-response. Consequently, the data describe aggregate first-buyer transactions, rather than a list of current offers available to every farmer.
| Type | 24 Oct: USD/lb | 31 Oct: USD/lb | 24 Oct: million lb | 31 Oct: million lb |
|---|---|---|---|---|
| Runner | 0.205 | 0.220 | 80.799 | 247.381 |
| Spanish | 0.243 | 0.459 | 0.019 | 2.736 |
| Valencia | Not applicable | Not applicable | 0.000 | 0.000 |
| Virginia | 0.242 | 0.261 | 23.749 | 27.853 |
| All | 0.213 | 0.227 | 104.567 | 277.970 |
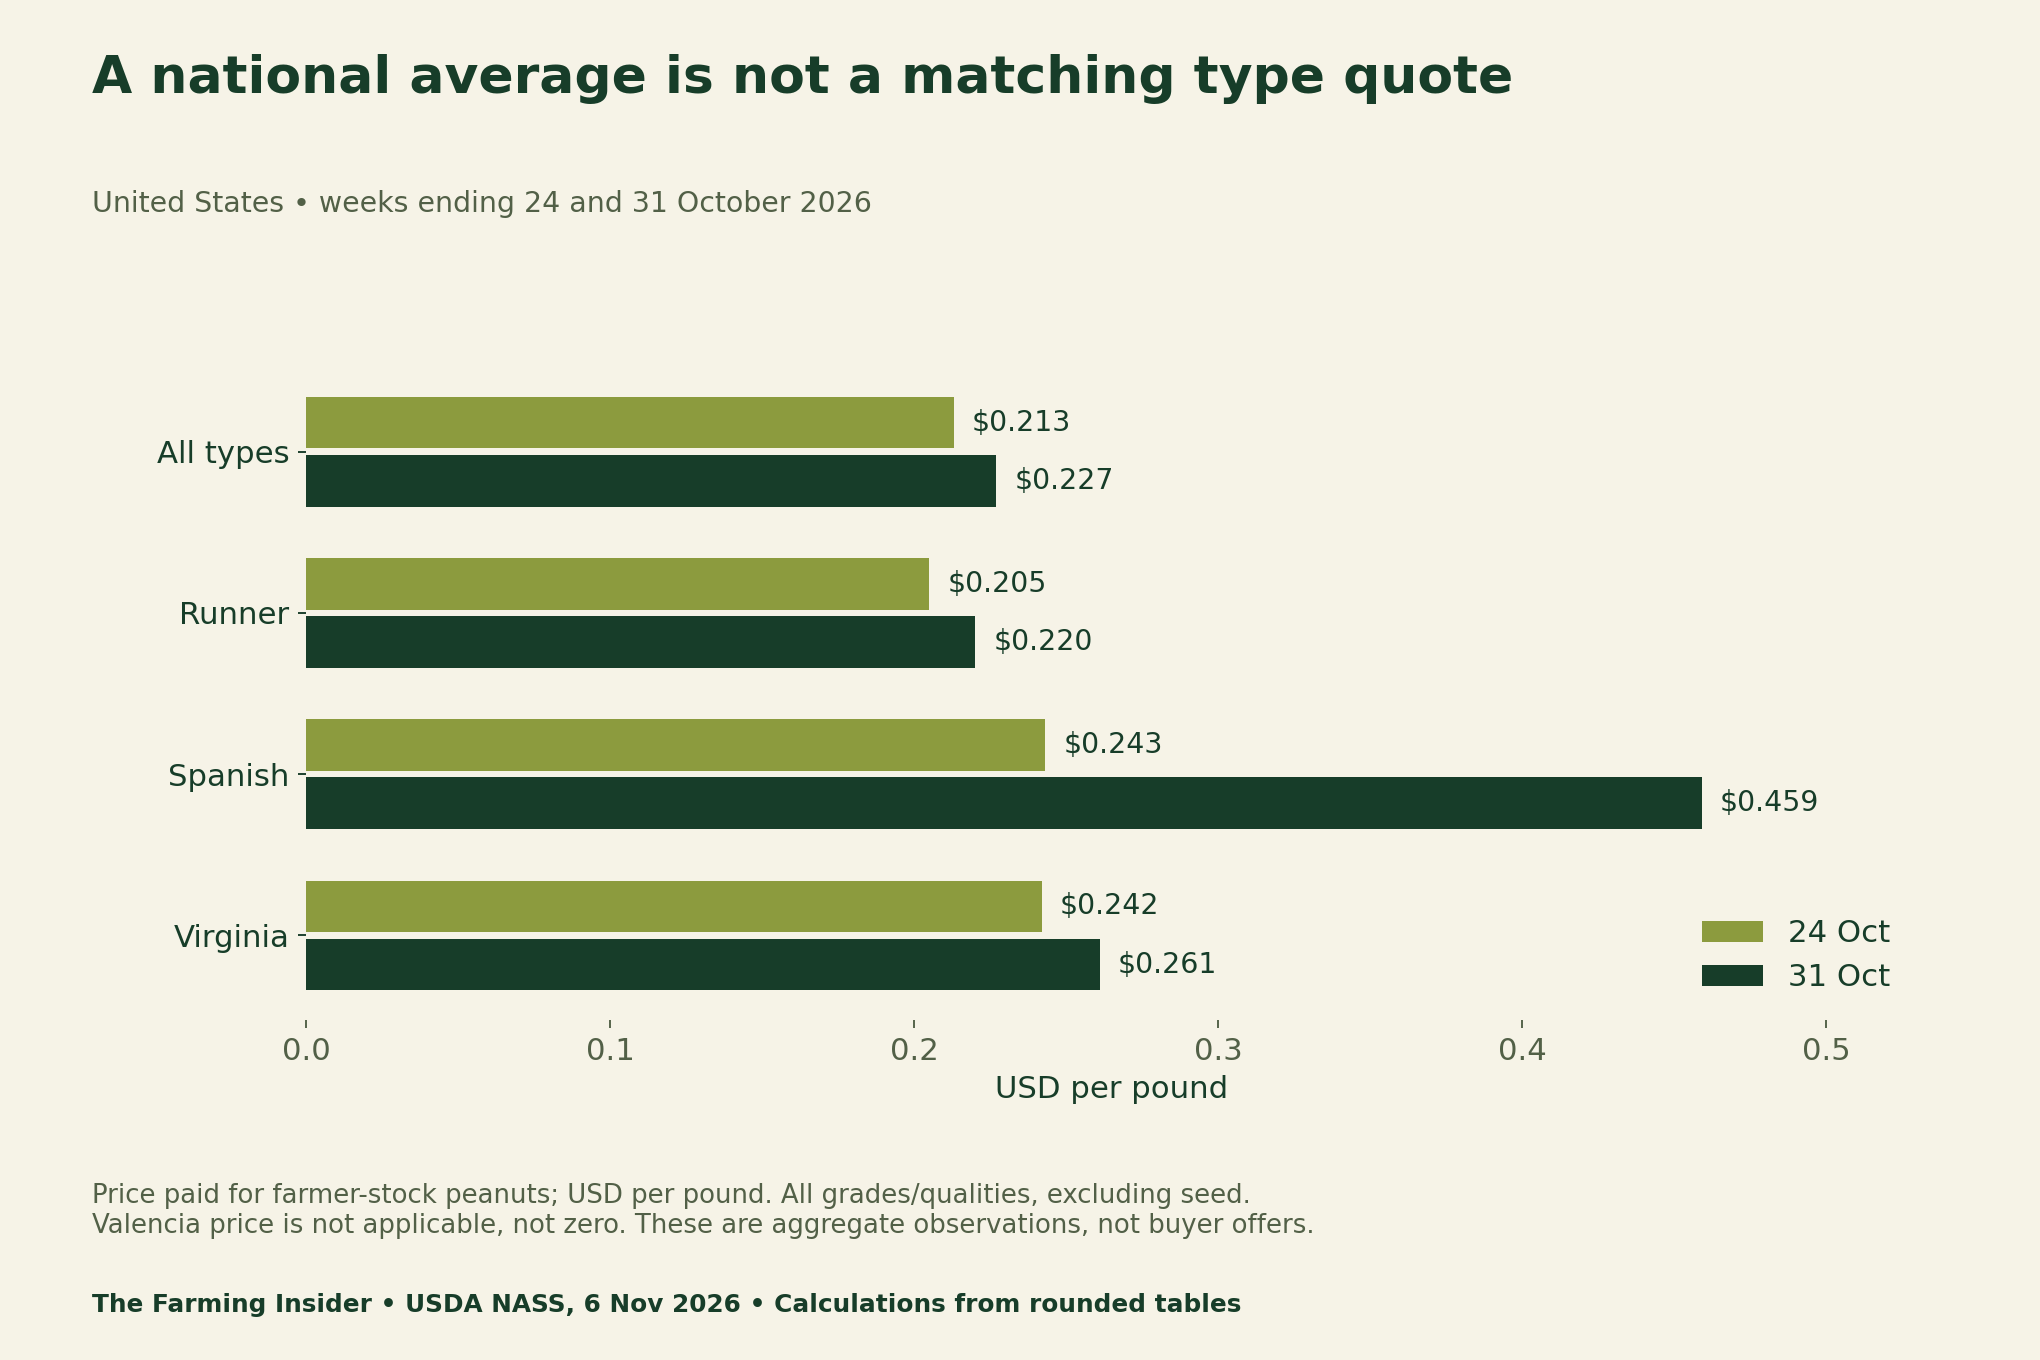
Keep missing prices separate from zero purchases
The report marks Valencia prices “not applicable” and Valencia marketings as zero. Those are different statements. A missing price must not become a zero-dollar price in an average. In this comparison, Valencia has no purchased weight in either week, so its unavailable price contributes nothing to the weighted calculation without being invented.
Spanish marketings rose from 19,000 to 2.736 million pounds. That very small initial quantity matters when reading its price movement. Do not turn a national type average into evidence that the same grade, buyer or contract changed by the same amount. No farm-level transaction matching was available for this analysis.
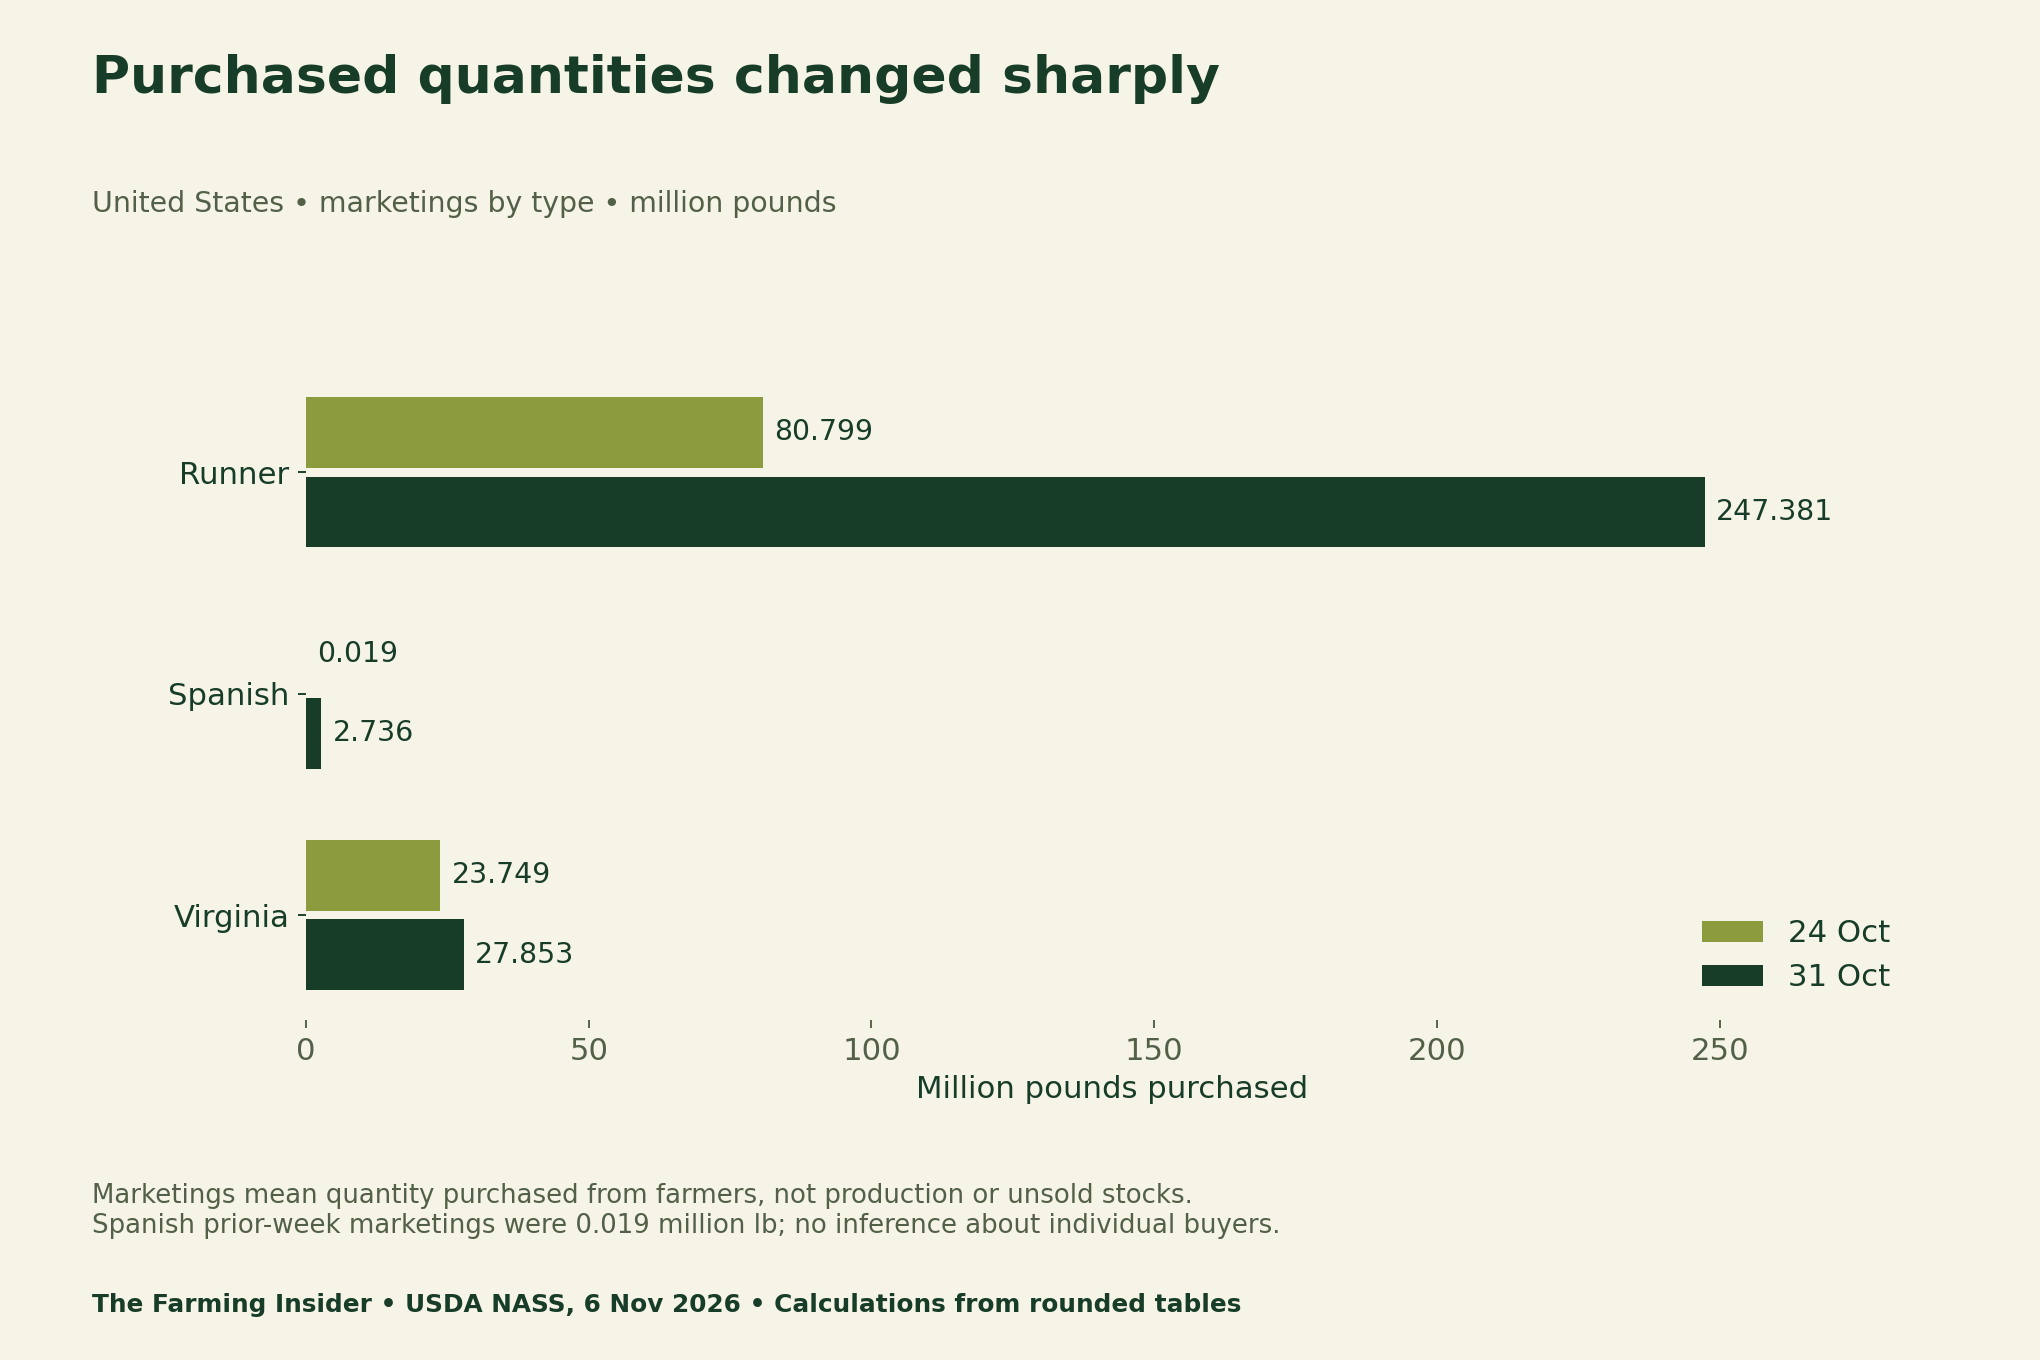
The type mix changed alongside peanut prices
Divide each type’s purchased pounds by all purchased pounds for that week. Runner share was 80.799/104.567=77.2701% in the earlier week and 247.381/277.970=88.9956% in the later week. The increase is 11.7 percentage points after rounding. It is not an 11.7% change in acreage or national output.
Compare US peanut prices by type with a fixed mix
First reconstruct each week’s all-type average from the published type prices and volume shares. The earlier reconstruction is $0.213410/lb; the later one is $0.226461/lb. Next apply the earlier shares to the later type prices. That fixed-previous-week-weight comparison is $0.229355/lb, or about 22.94 cents.
This sequence gives a within-type-average component of +1.5945 cents/lb and a type-mix component of −0.2895 cents/lb. Their sum is the reconstructed increase of 1.3050 cents/lb. The negative mix component means that, using current type prices, the later quantity weights produce a lower weighted average than the earlier weights would.
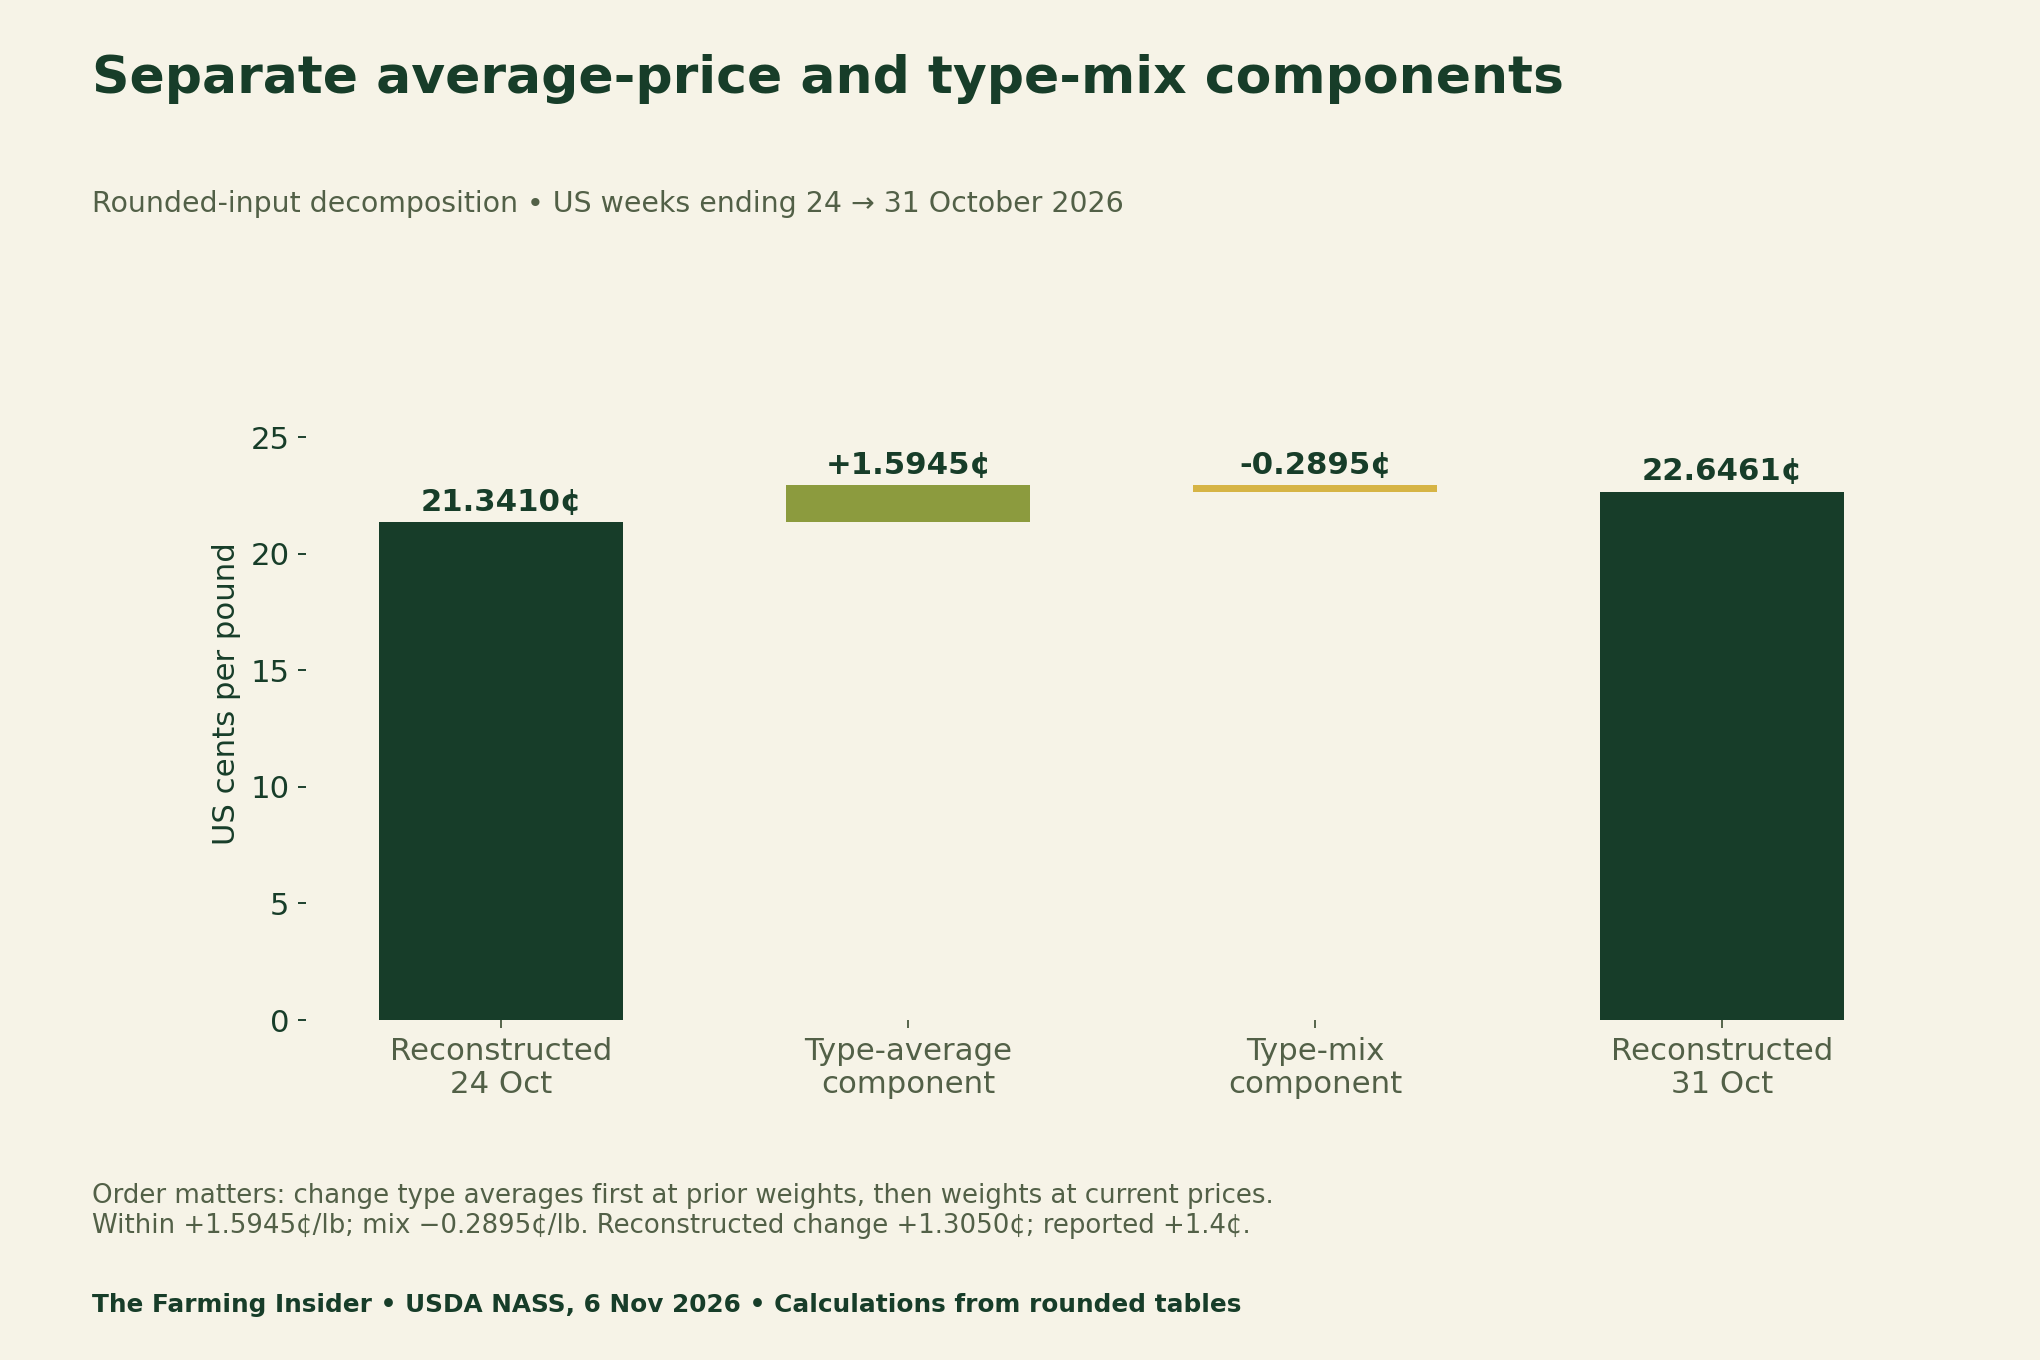
The published headline increased by 1.4 cents/lb, leaving a residual of about 0.0950 cents/lb against the rounded-input reconstruction. Keep that residual visible. Rounded type prices and quantities cannot reproduce unrounded underlying payments exactly; it is not evidence of an error in USDA’s headline.
The within-type-average component is also not a pure quality-adjusted price effect. The report combines grades and qualities, and different contracts or buyers may contribute across weeks. The decomposition isolates published type categories only. It does not hold every commercial attribute constant or show that increased purchases caused prices to rise.
Match US peanut prices by type to your settlement
Start with the crop type, quality basis and transaction dates. Then keep gross price, deductions, freight terms, quantity and net receipt distinct. The blank settlement worksheet makes these fields visible without setting an acceptable price or substituting a national estimate for the contract you actually signed.
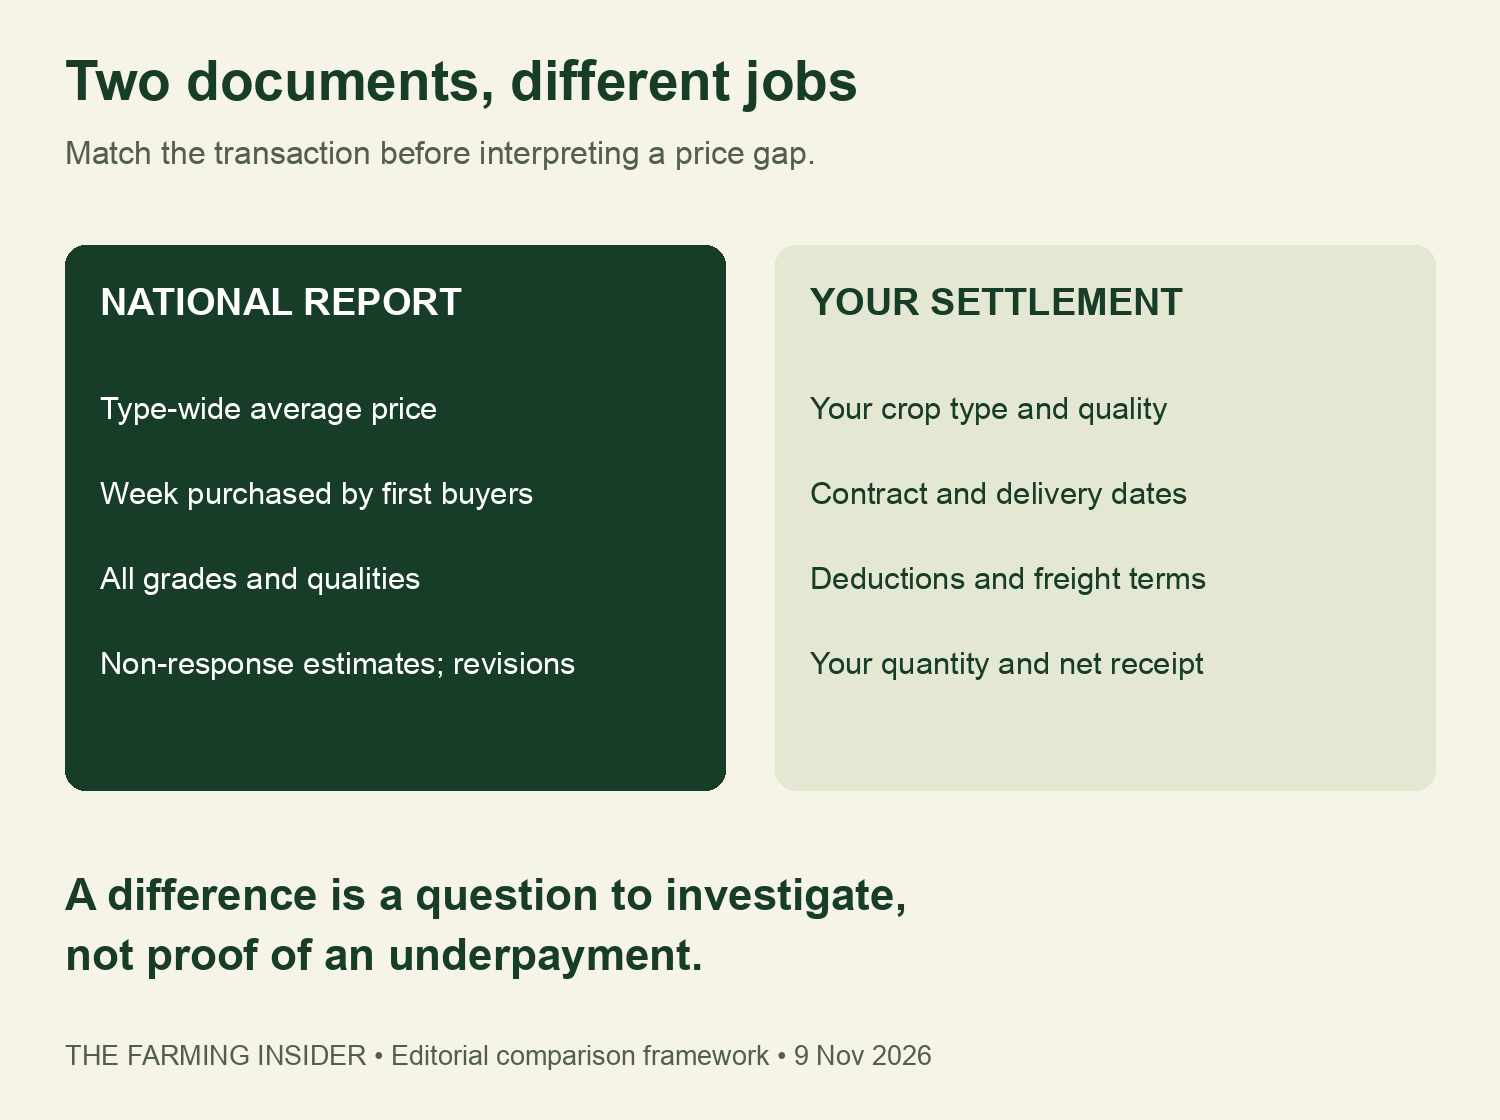
For example, two prices expressed per pound may still cover different quality, timing or delivery terms. Record those differences before interpreting the gap. Do not add an unsupported quality adjustment to make a settlement match. Discuss unresolved contract or accounting questions with an appropriate adviser using the original documents.
Our milling-wheat net-premium guide applies a related matching principle to quality and cost assumptions. The dairy milk-budget analysis separates a production headline from farm-specific financial inputs. Neither supplies a peanut-price adjustment factor.
Transform Your Agribusiness
Unlock your farm's potential with expert advice tailored to your needs. Get actionable steps that drive real results.
Get StartedDownload the data, calculations and blank comparison tool
The source file retains all five weeks and all reported types from this release. The weights file shows each multiplication, while the decomposition file records the formula and rounding residual. The blank worksheet contains no invented farm settlements or personal information.
- US peanut prices and marketings source table (CSV)
- Two-week type weights and price calculations (CSV)
- Price-mix decomposition and rounding residual (CSV)
- Blank peanut settlement comparison worksheet (CSV)
Methods, revisions and citation
Calculations use the 6 November report’s published precision. Quantity totals were reconciled across the four types for every week. All-type rows are reference totals, not extra peanut types to add again. Weights sum to one across positive-weight types. Decomposition components reconcile to the reconstructed change before rounding.
NASS can revise the prior three weeks after late reports, with further updates at the marketing-year review. Retain the release date alongside a copied number. A later report may legitimately change an earlier observation. This analysis supplies no standard errors, buyer-specific prices, net margins, forecast or causal conclusion.
Suggested citation: The Farming Insider (9 November 2026), “US Peanut Prices by Type: Separate Price Changes From Mix.” Attribute original observations and methodology to USDA NASS, Peanut Prices, 6 November 2026; attribute the rounded-input decomposition and blank comparison tools to this report.