



Deep liming soil moisture results can help frame a decision, but they cannot yet establish a return from the latest Hines Hill trial. A change in soil chemistry and an extra tonne of grain are different outcomes. Our guide separates the reported observations from an original break-even calculation and a practical evidence ledger.
The useful question is what must be measured next. Keep the treatment record, the soil measurements and the harvest comparison together. Then compare additional crop contribution with the full cost of treatment. The five figures below show how to avoid turning an early observation into a yield or profit forecast.
What the November 2026 update actually reports
The DPIRD update published on 4 November 2026 concerns a Hines Hill trial established in 2025. Laboratory work found reaction needed more than 5% subsoil moisture. In dry 2025, moisture was below 4%, pH remained below the trial target of 4.8 and aluminium exceeded 5 ppm. The 2026 update reports 7% moisture at depth, pH near the target and aluminium below 5 ppm, after 210 mm growing-season rain and roughly 140 mm summer rain. Harvest results were still awaited.
Those percentages are reported moisture observations, not a transferable sensor setting. The release does not establish the moisture measurement basis or a complete depth-by-depth dataset. Its treatment descriptions also need reconciliation: the general incorporation schedule and the separately described deepest treatment do not provide an unambiguous protocol. Older research mentioned in the release is not a yield result from this trial.
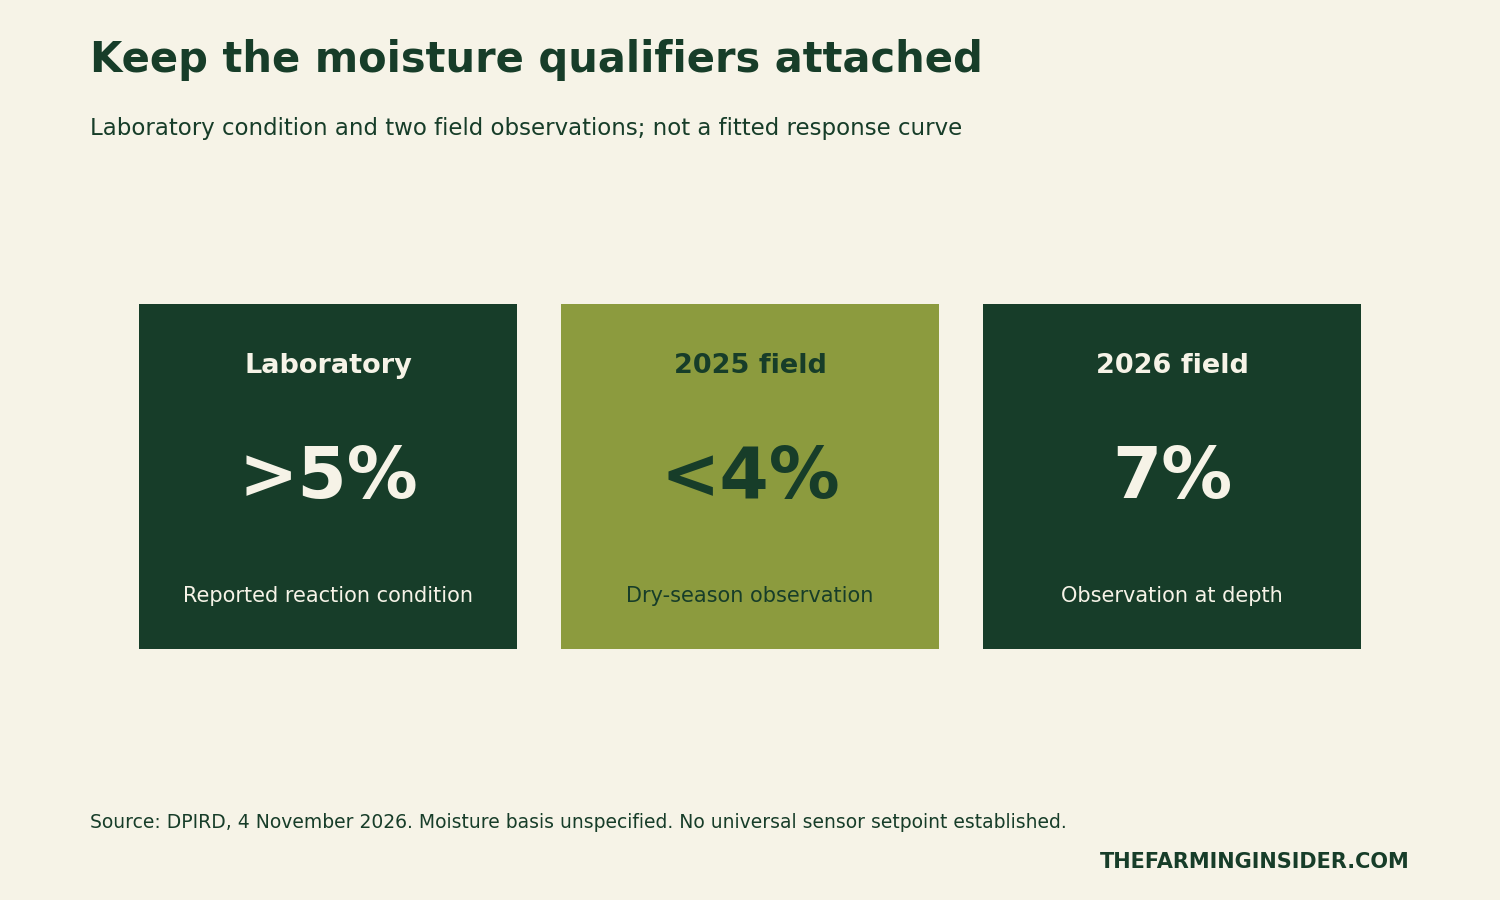
Therefore, a reader should preserve the original qualifiers. A record saying “below” must not become an exact value in a spreadsheet. Similarly, a condition from a laboratory study should not become a universal field threshold. Figure 1 deliberately avoids drawing a fitted line through unlike observations.
Recording deep liming soil moisture evidence
First, record what was done: the actual product, neutralising value, rate, incorporation method, depth and date. Next, record what was measured, including sampling depth, method, units, date and any comparison plot. Finally, record the harvest and cost outcomes. This structure makes it easier to see which part of a claim is still missing.
For example, a laboratory pH result belongs beside its laboratory method. It does not belong in a column labelled “yield response”. A rainfall total also needs a start date and an end date. Without those details, two apparently similar numbers may describe different periods or measurements.
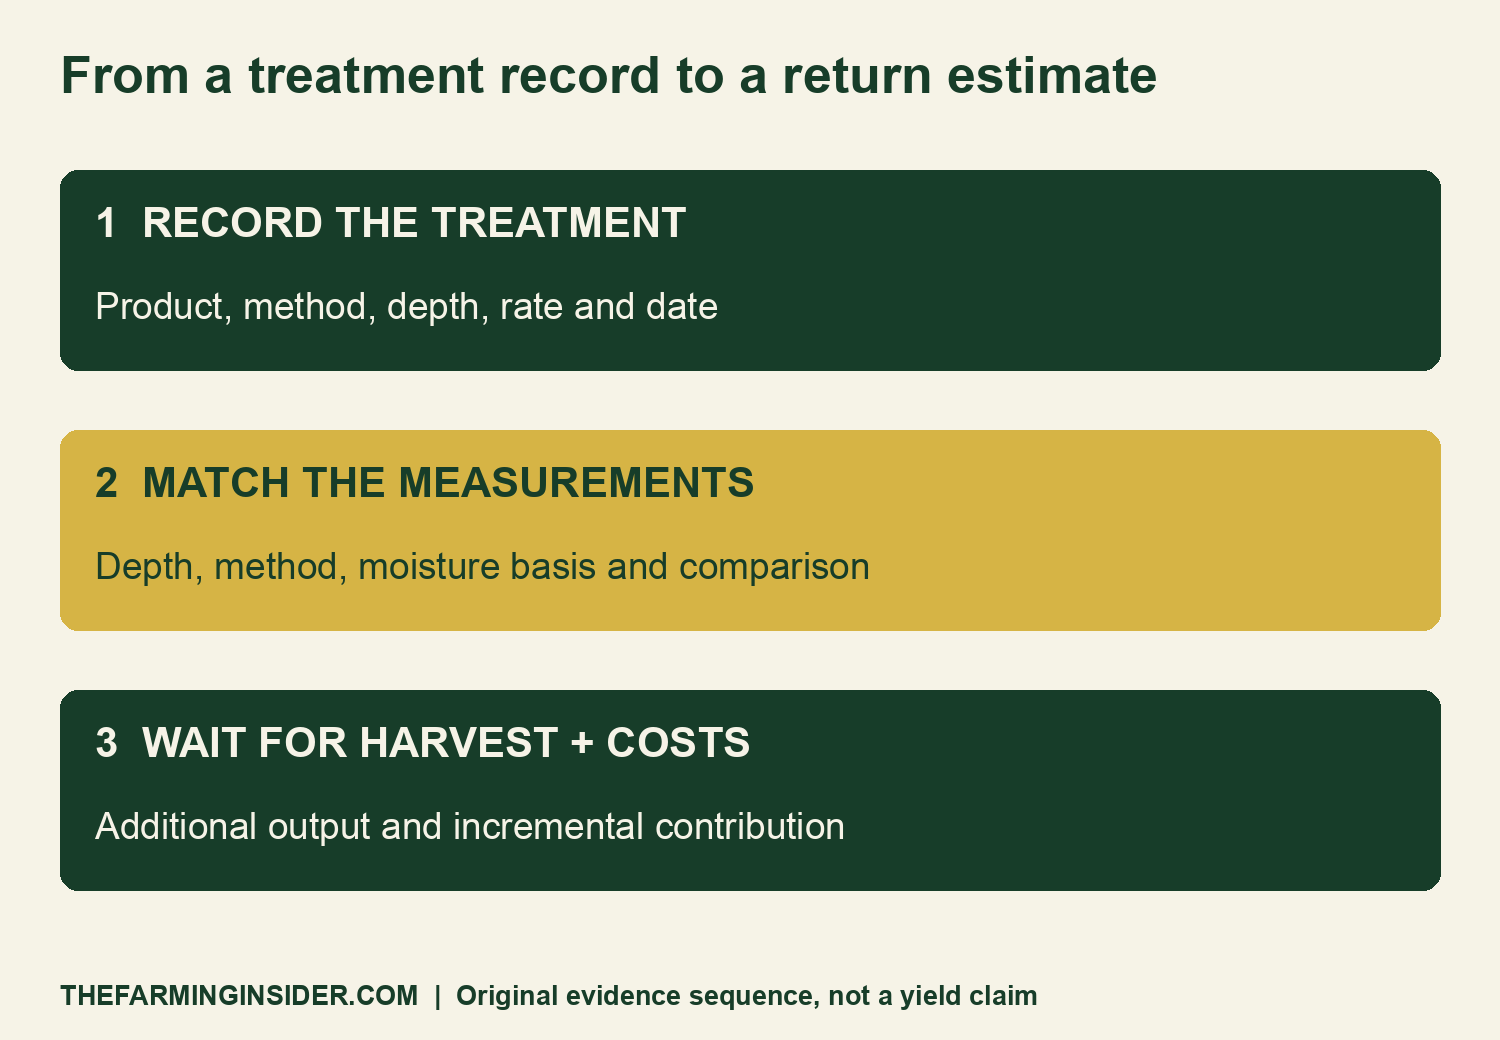
Our blank ledger leaves unreported values empty. A blank means unknown or not yet entered. It never means zero. In addition, it asks for the untreated comparison, because a treated plot alone cannot reveal what would have happened without treatment.
Deep liming soil moisture and the investment question
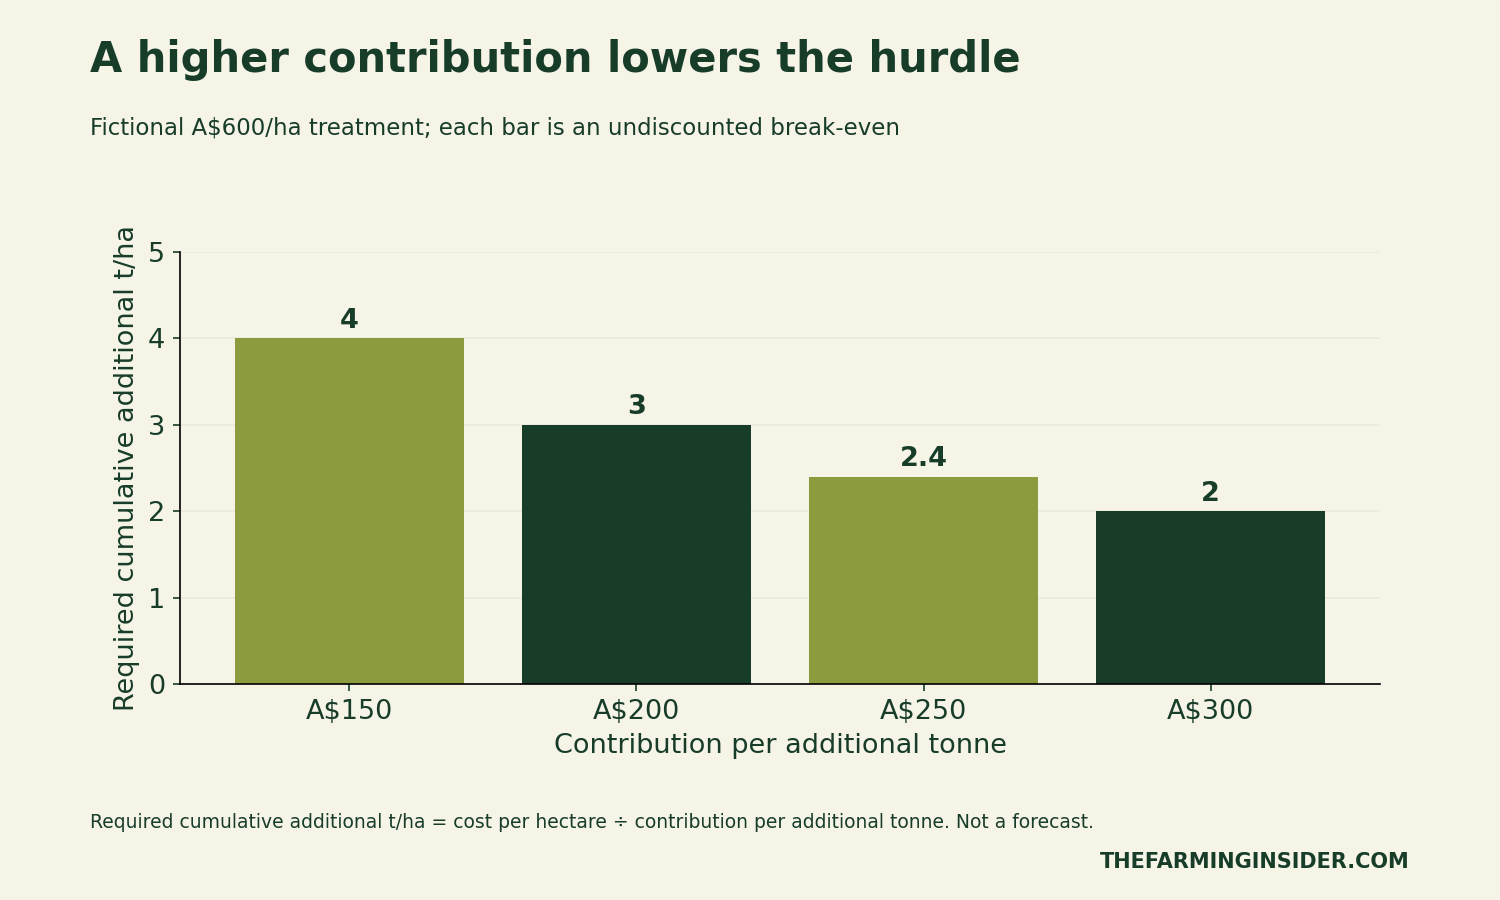
Consider an entirely fictional treatment costing A$600 per hectare. Assume each additional tonne of grain contributes A$200 after the costs that change with that extra output. These are arithmetic inputs chosen for this guide. They are not quotes, trial measurements or estimates of the likely response.
The simple cumulative break-even quantity is treatment cost divided by contribution per additional tonne. In this example, A$600 ÷ A$200/t equals 3 additional tonnes per hectare cumulatively. That is a hurdle to test against future evidence, rather than a prediction that the treatment will produce it.
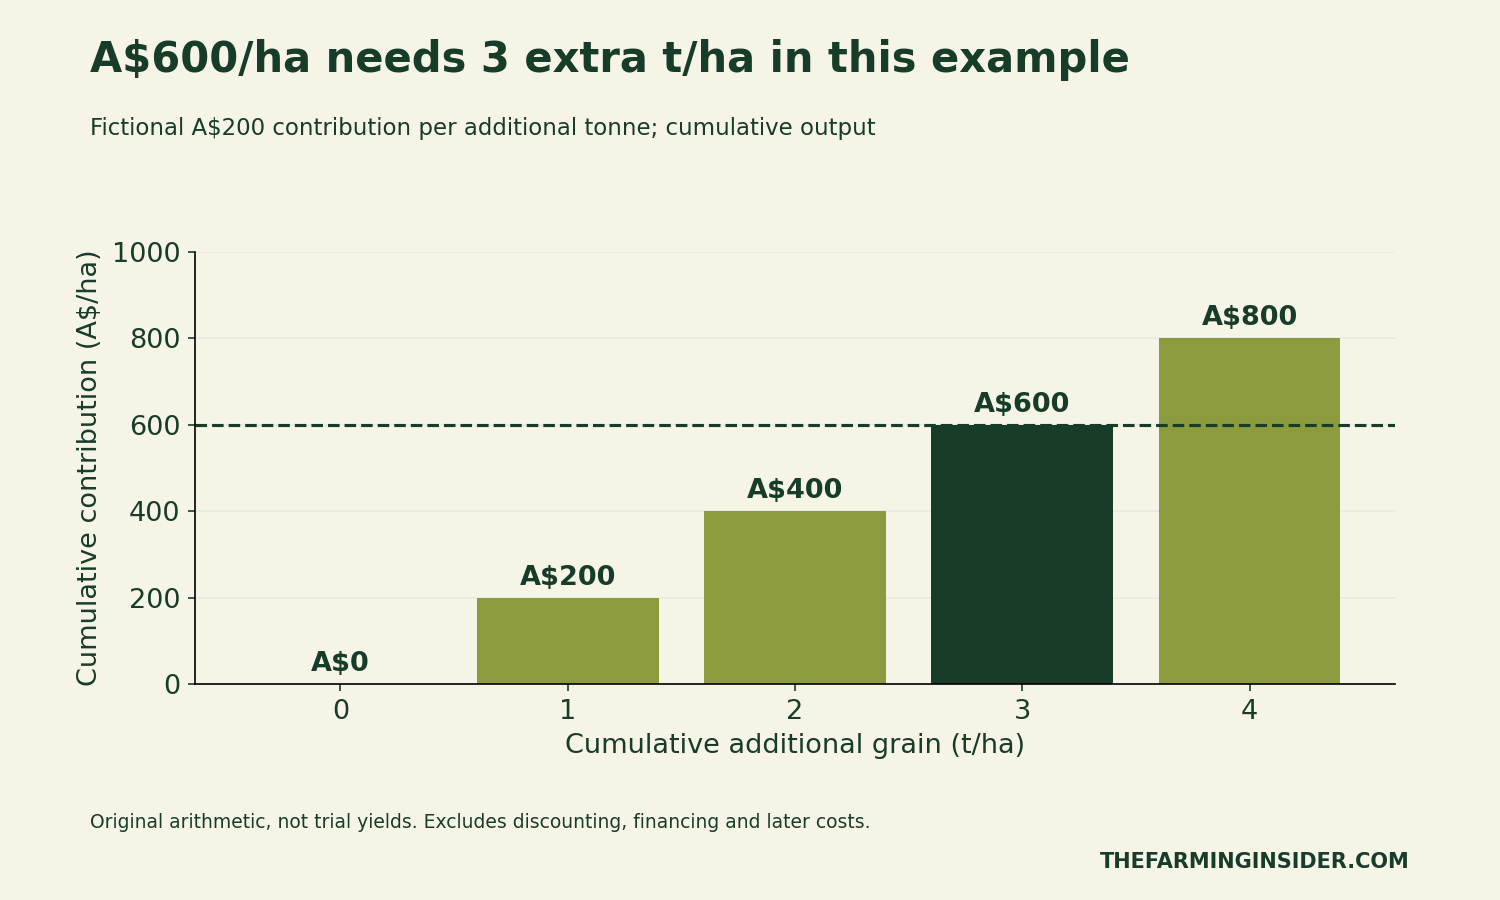
Contribution is not the grain sale price. If an extra tonne brings additional harvesting, freight or handling costs, subtract those costs before using a contribution assumption. Likewise, a treatment cost should include relevant spreading, incorporation and operating costs, rather than the product invoice alone.
Price and cost assumptions change the hurdle
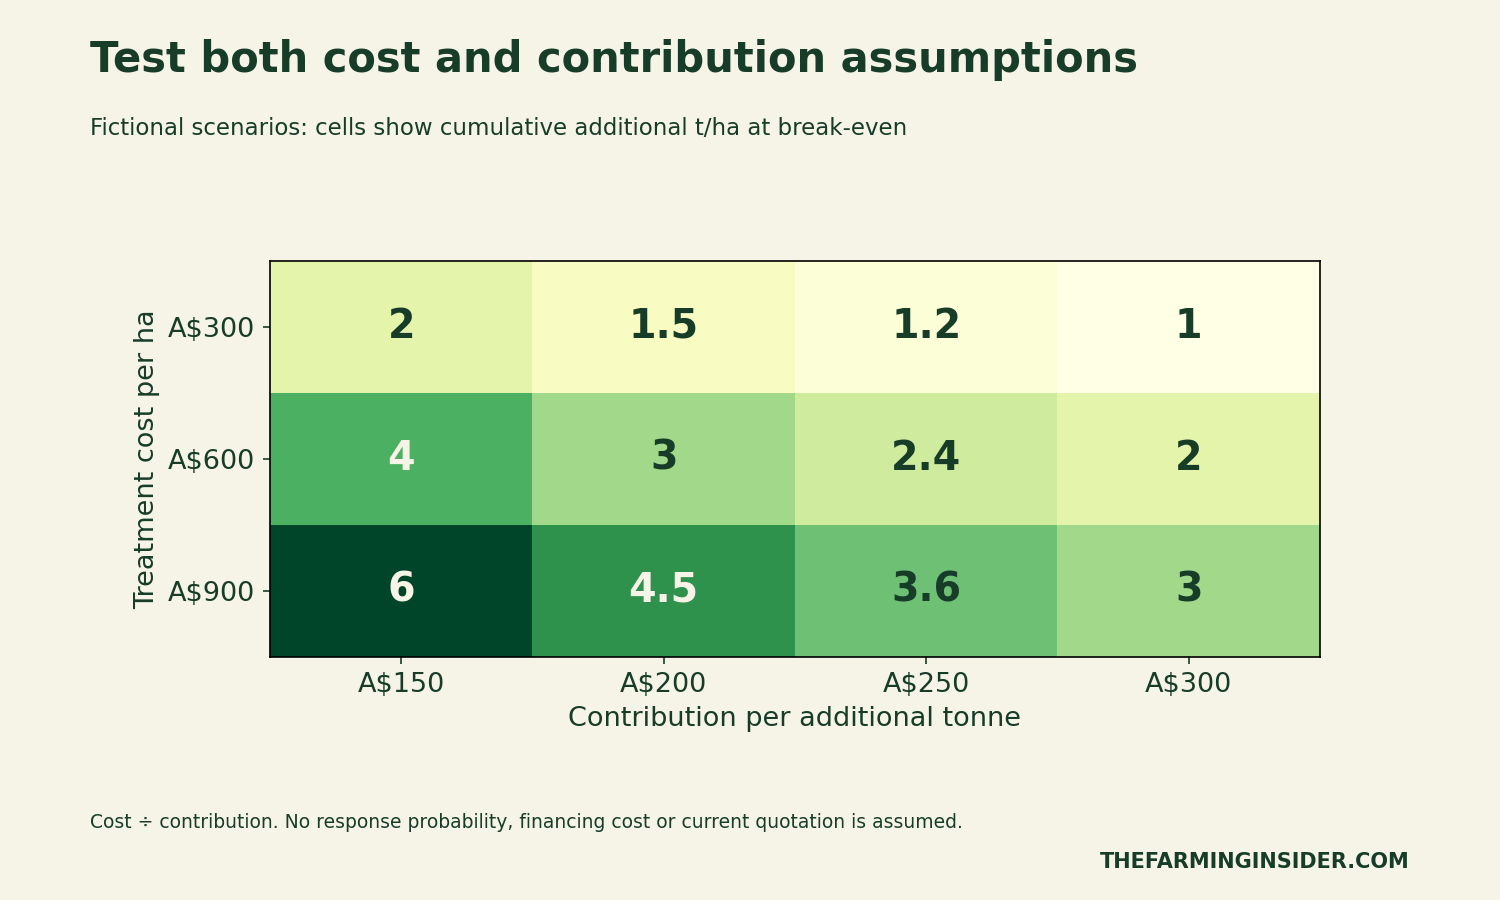
A simple sensitivity table is more honest than a single precise-looking payback estimate. Holding the fictional treatment cost at A$600/ha, a A$150 contribution requires 4 cumulative additional t/ha. A A$300 contribution requires 2 t/ha. Neither number says how much extra grain a paddock will produce.
Treatment cost also matters. For instance, the same contribution assumption can lead to a different hurdle when operating conditions change the total bill. Compare a supplier quotation with the relevant work plan, and document which costs are included. Do not silently mix a product-only cost with an all-in cost from another option.
Timing is a separate budget issue
Even if two scenarios have the same final additional production, they can have different cash timing. To illustrate, compare three fictional paths that each total 3 additional t/ha over three years. One produces 1 tonne in each year. Another produces none in year one, then 1 and 2 tonnes. A third produces all 3 tonnes in year three.
At the assumed A$200 contribution, all three recover A$600 by the end of year three before discounting. However, their earlier cash positions differ. This comparison explains timing risk without claiming that any path is likely, or that the Hines Hill trial follows one of them.
Transform Your Agribusiness
Unlock your farm's potential with expert advice tailored to your needs. Get actionable steps that drive real results.
Get Started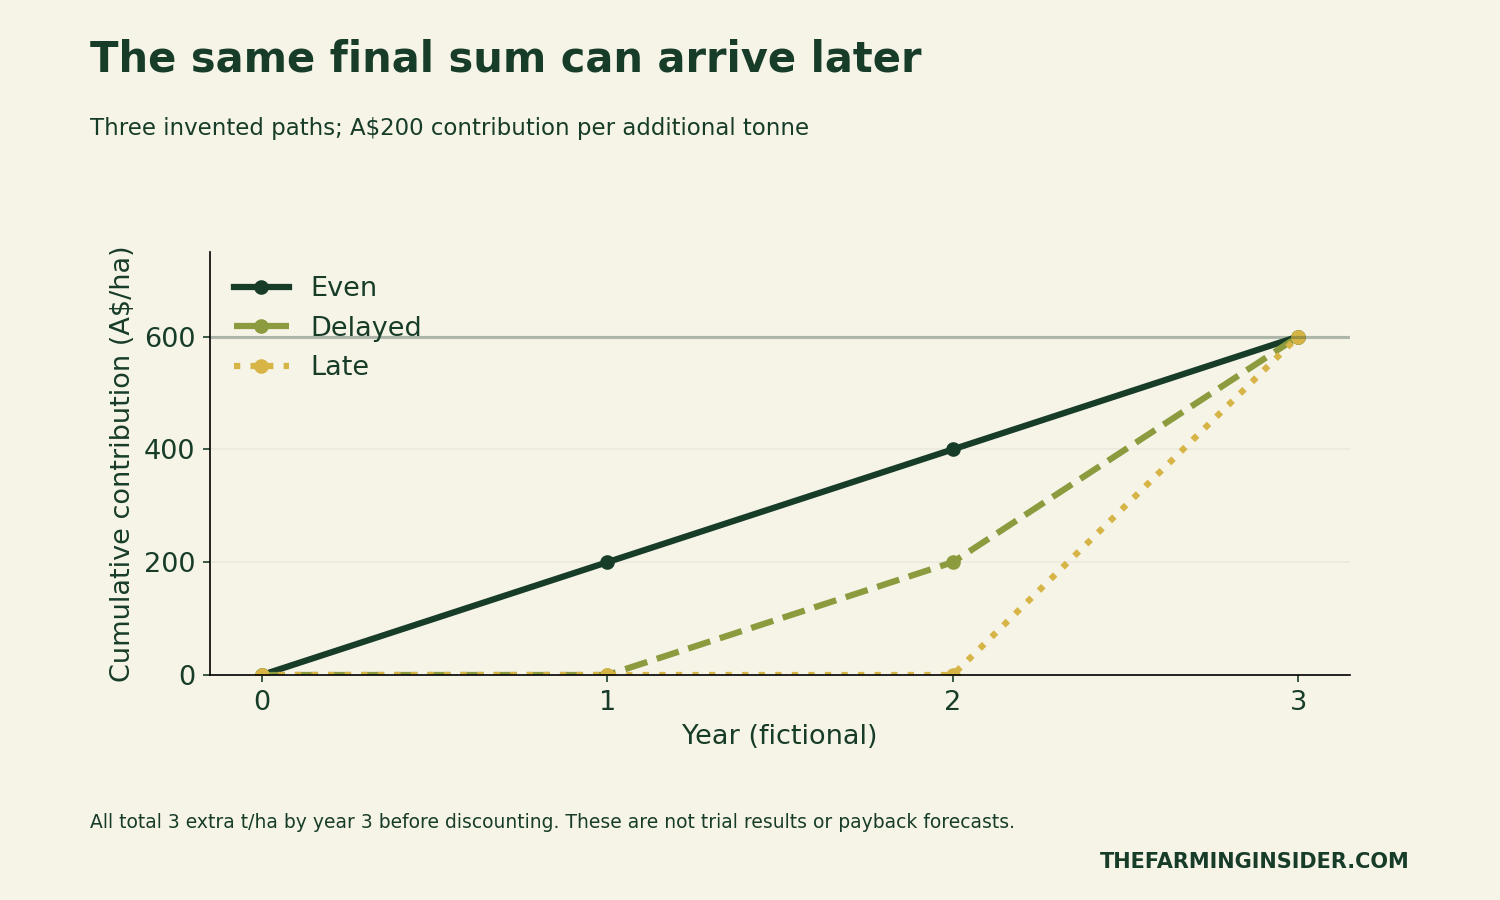
For a financing decision, use dated cash flows and the business's own cost of capital. Include later costs and any relevant residual value. Also test a no-additional-yield case. The simple tools here stop short of calculating a recommended investment or an expected return.
Four original CSV tools
Download the files below and retain a clean copy before entering private paddock information. They contain either blank fields or clearly labelled fictional calculations. No individual grower records are included.
- Blank depth-specific evidence ledger (CSV) records treatment details, dates, depth, methods, moisture basis, pH, aluminium, comparison and harvest results.
- Fictional break-even sensitivity scenarios (CSV) contains the cost and contribution combinations behind Figures 2–4.
- Fictional timing examples (CSV) provides the annual and cumulative amounts in Figure 5.
- Agronomist discussion checklist (CSV) separates missing measurements, protocol clarification and investment assumptions.
The CSV files are plain data, without embedded formulas or macros. To reproduce the sensitivity calculation in a spreadsheet, divide cost in A$/ha by contribution in A$/additional tonne. The result is cumulative additional t/ha. Keep those units visible when sharing an edited version.
Questions to take to your agronomist
Ask which constraints have actually been measured at each depth and which treatment is being compared. Request a consistent sampling protocol and an explanation of the moisture basis. Also clarify how the proposed incorporation method and product rate relate to the site-specific diagnosis.
Next, agree how harvest results will be compared and when they will be available. Keep the soil chemistry interpretation separate from a yield claim. Finally, list the costs and contribution assumptions that would have to hold for the investment hurdle to be met. This discussion sheet helps organise questions; it does not prescribe a lime rate, depth or timing.
For another example of separating a headline from a business calculation, see our UK milling-wheat net-premium guide. Our Canadian controlled-environment agriculture funding analysis also separates an eventual contribution from the cash required before it arrives.
Deep liming moisture: methods, limits and citation
We checked the linked DPIRD release on 6 November 2026. This article is a close reading of an early public update plus original, reproducible budgeting illustrations. It is not an analysis of raw plot-level observations. No causal effect, confidence interval, treatment ranking or probability of success has been calculated.
For the original examples, break-even additional grain equals treatment cost divided by contribution per extra tonne. Timing examples sum invented annual contributions. All amounts are Australian dollars. Calculations exclude discounting, finance charges and later costs, and their inputs must be replaced before any real budgeting use.
Suggested citation: The Farming Insider (6 November 2026), “Deep Liming Soil Moisture: Read the WA Trial Correctly”, original scenario calculations and accompanying CSV tools. Cite DPIRD separately for the reported trial observations. Update the interpretation when a full protocol and harvest results become available.