




UK milling wheat quality 2026 looks strong in AHDB's latest survey, but a national result cannot grade your own grain lot. Nor does a milling premium automatically make the sale worthwhile. In our fictional 200-tonne example, a £15/t premium produces £3,000 gross. Extra haulage, segregation and testing reduce the incremental return to £1,700, or £8.50/t.
Start with a representative test and the actual buyer's contract. Then compare the extra revenue with the extra costs against a defined alternative sale. This guide supplies five original scenario charts, an explanatory decision diagram and four CSV tools. None of the example prices is a current market quote.
Research checked: 6 November 2026. The survey update is dated 3 November, while its observations run through 25 September. Keep those dates separate from the date of your own sample, quote and contract.
What UK milling wheat quality 2026 tells us
The AHDB Cereal Quality Survey includes 7,827 wheat samples. Its Group 1 comparison covers 3,063 samples: 79% met the typical combination, versus 95% under an adjusted combination. Individual typical-criterion pass rates were 96% for specific weight, 83% for protein and 99% for Hagberg Falling Number.
The typical thresholds were 76 kg/hl, 13.0% protein and 250 seconds; the adjusted comparison used 74 kg/hl, 12.0% and 200 seconds. These comparisons do not alter a buyer's specification. AHDB notes rounded percentages, missing parameter results and a validation change from November 2022.
The combined pass rate is a different question from passing one measure. Moreover, the survey is not an acceptance forecast for your lot. Do not multiply a proposed premium by 79% and call the result an expected farm return. Your sample, contract, handling and destination still need their own evidence.
Put the contract and laboratory report side by side
Use the blank lot-check CSV to record the buyer's threshold, its direction, the unit and the laboratory result. Include the contract reference and sampling date. A percentage without its measurement basis, or a test result without a lot identifier, can leave a comparison unresolved.
Ask the buyer how it handles results near a threshold, retesting, regrading, rejection and any associated charges. Record the actual written terms. The worksheet does not invent tolerances or give a national pass rate the status of a guarantee.
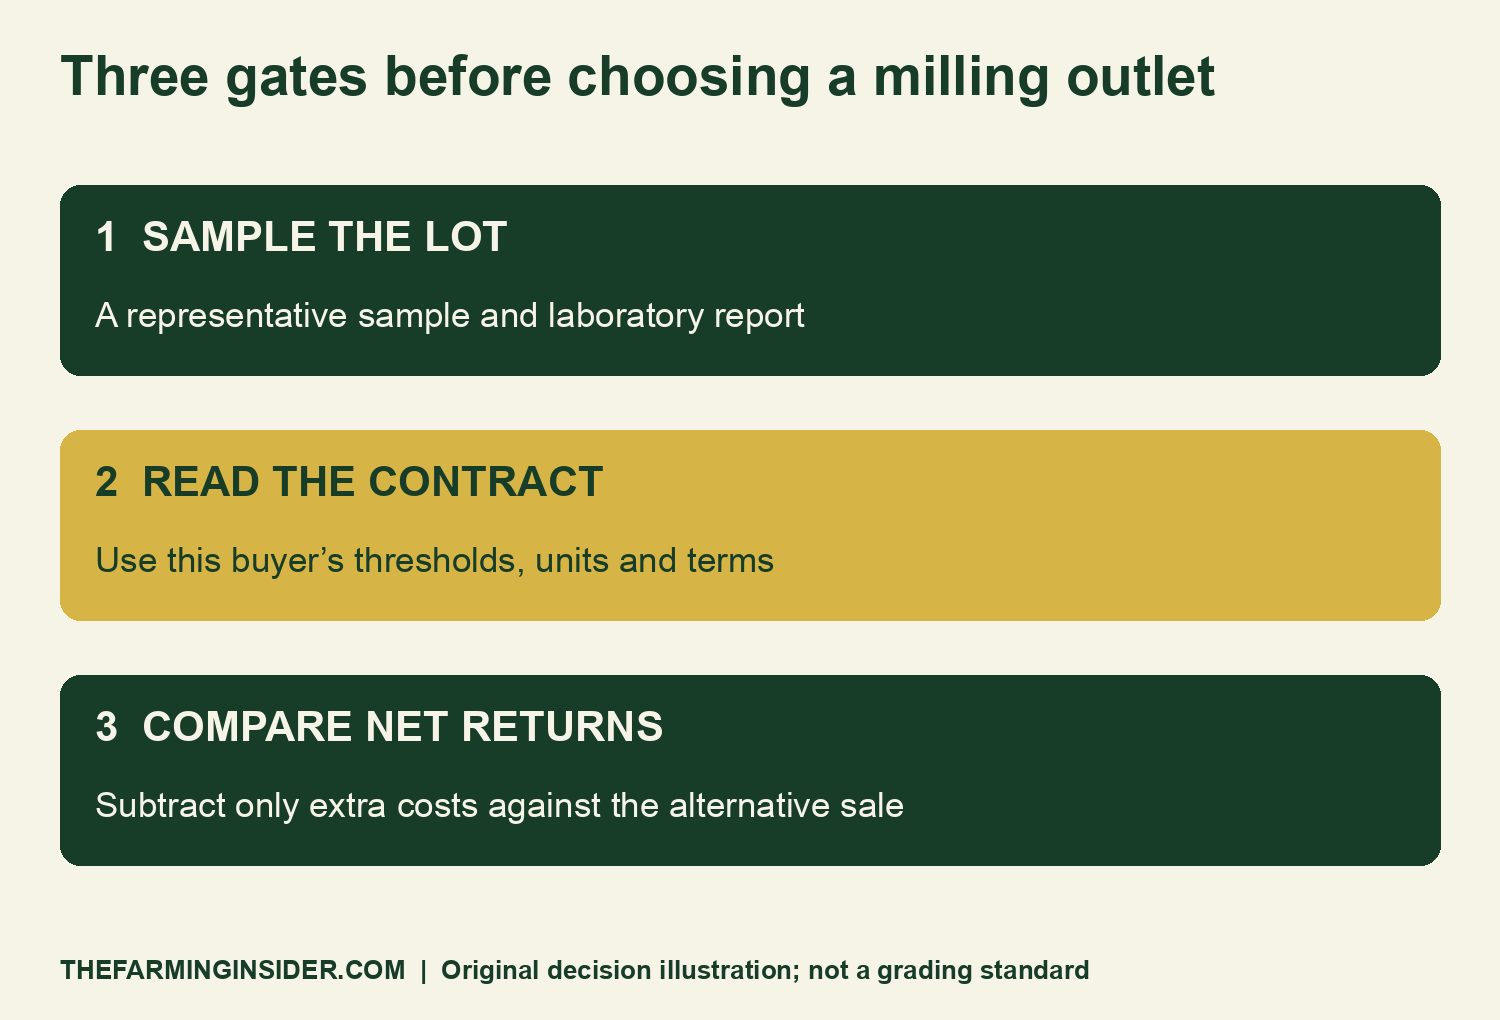
If a result or term is missing, mark it unresolved. Do not fill it with a national average. Likewise, an adjusted survey specification does not entitle a seller to a price negotiated under a different specification.
Turn the gross premium into an incremental return
First define the alternative. For example, your comparison might be between two genuine outlet quotes on a consistent basis. Check whether both include transport, moisture adjustments, payment timing and other relevant deductions. A difference between unlike price bases can look like a premium when it is partly a delivery-cost difference.
For the simple worked example, assume 200 tonnes, a £15/t premium and the following extra costs. Every value is fictional. The costs are incremental to the alternative sale; the calculation is not a whole-farm profit account.
| Worked item | Calculation | Amount |
|---|---|---|
| Gross premium | 200 t × £15/t | £3,000 |
| Extra haulage | 200 t × £4/t | £800 |
| Extra segregation | 200 t × £2/t | £400 |
| Test | One assumed charge | £100 |
| Net incremental return | £3,000 − £800 − £400 − £100 | £1,700 |
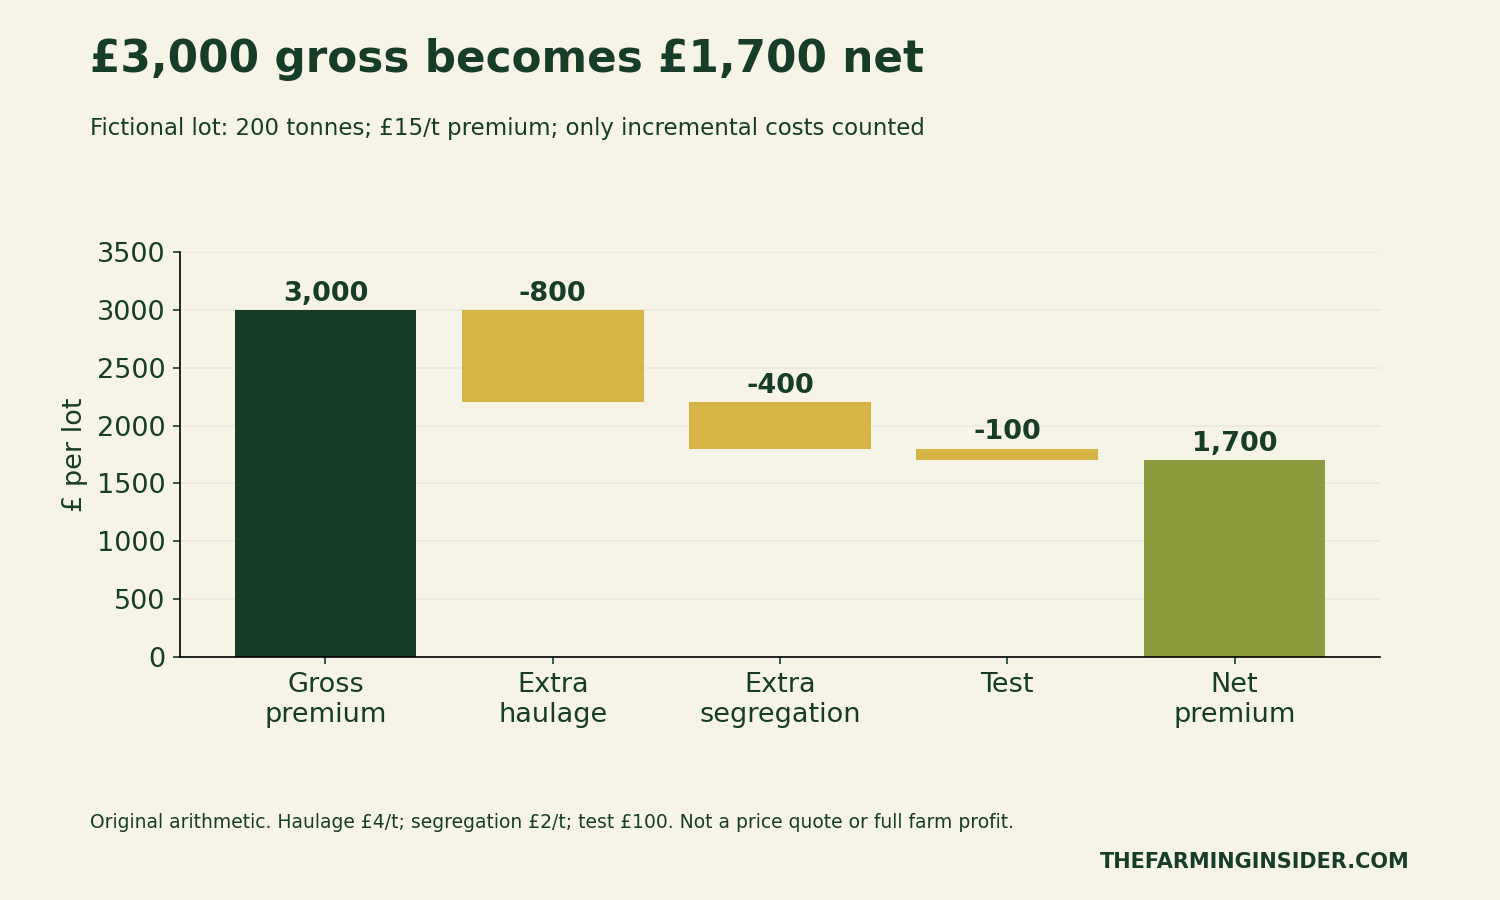
Dividing £1,700 by 200 tonnes gives £8.50/t. This is the surplus over the specified extra costs. Before using it, add any omitted incremental item that actually applies to your decision. Do not add an expense twice simply because two invoices describe the same service.
Calculate a break-even premium
The example's extra costs total £1,300. Dividing that total by 200 tonnes gives a £6.50/t break-even premium. At that premium, the extra revenue exactly covers these assumed extra costs.
Net incremental return = tonnes × (premium per tonne − extra haulage per tonne − segregation per tonne) − fixed testing costs − other incremental costs.
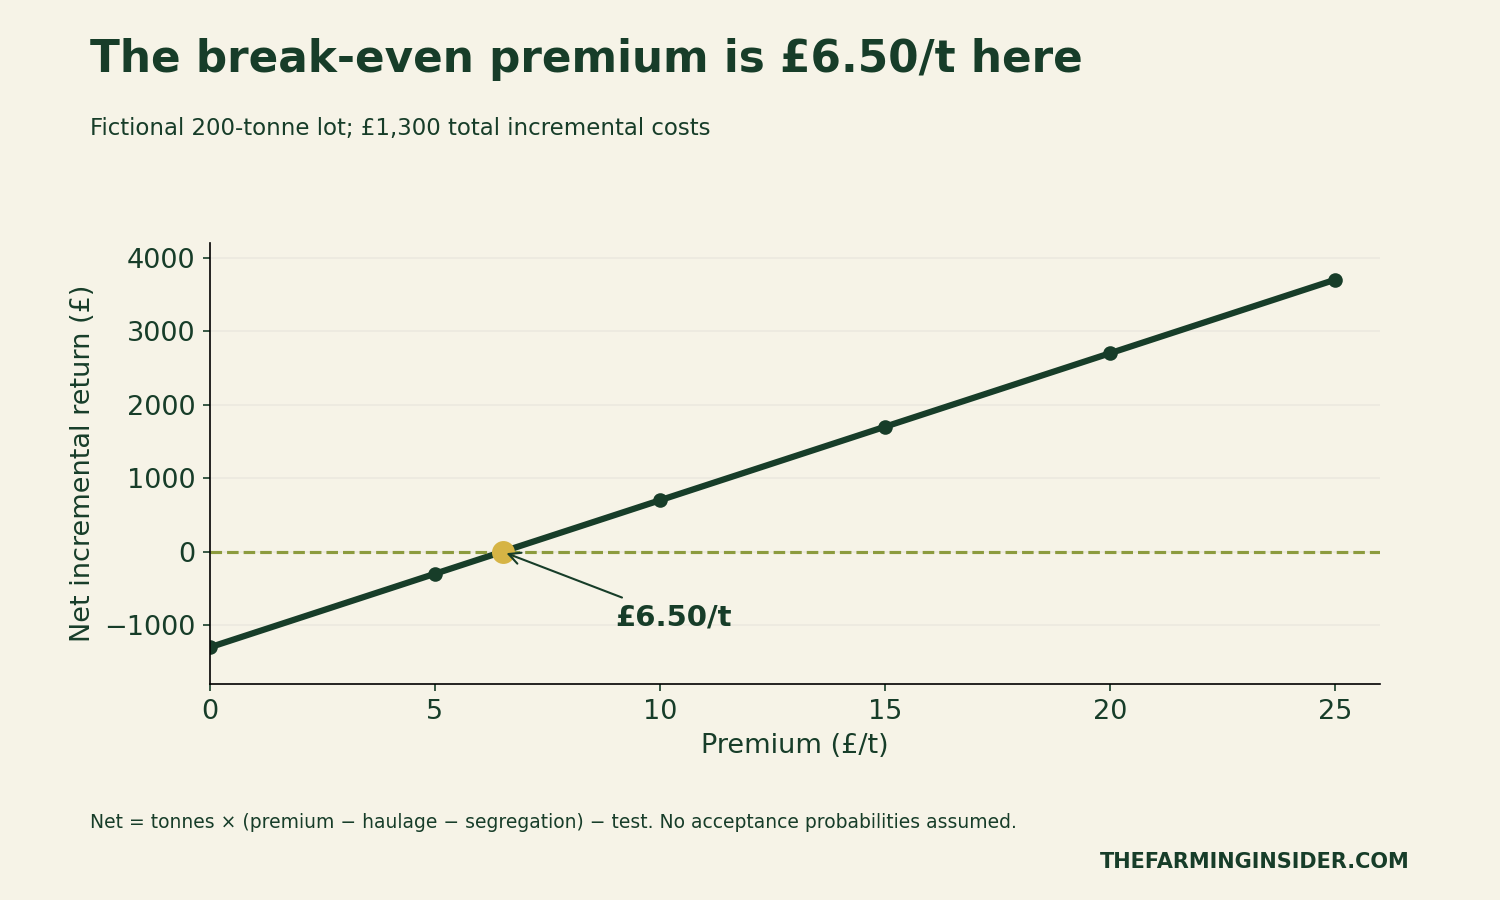
At £5/t, the example loses £300 against the alternative. Raising the premium to £10/t adds £700. The £15/t case adds £1,700. Those are arithmetic comparisons, not probabilities or recommendations to accept a quote.
Transform Your Agribusiness
Unlock your farm's potential with expert advice tailored to your needs. Get actionable steps that drive real results.
Get StartedA positive result also does not settle every business question. You may still need to consider payment terms, storage capacity and practical handling constraints. Put those matters beside the numerical comparison rather than silently treating them as zero-cost certainties.
Check how lot size changes a fixed cost
A fixed testing charge spreads across the tonnes it covers. With the same fictional £100 test and £6/t variable costs, a 50-tonne lot needs an £8/t premium to break even. A 400-tonne lot needs £6.25/t. That result assumes one £100 test covers each example lot; it does not claim that a larger lot needs no additional sampling or testing.
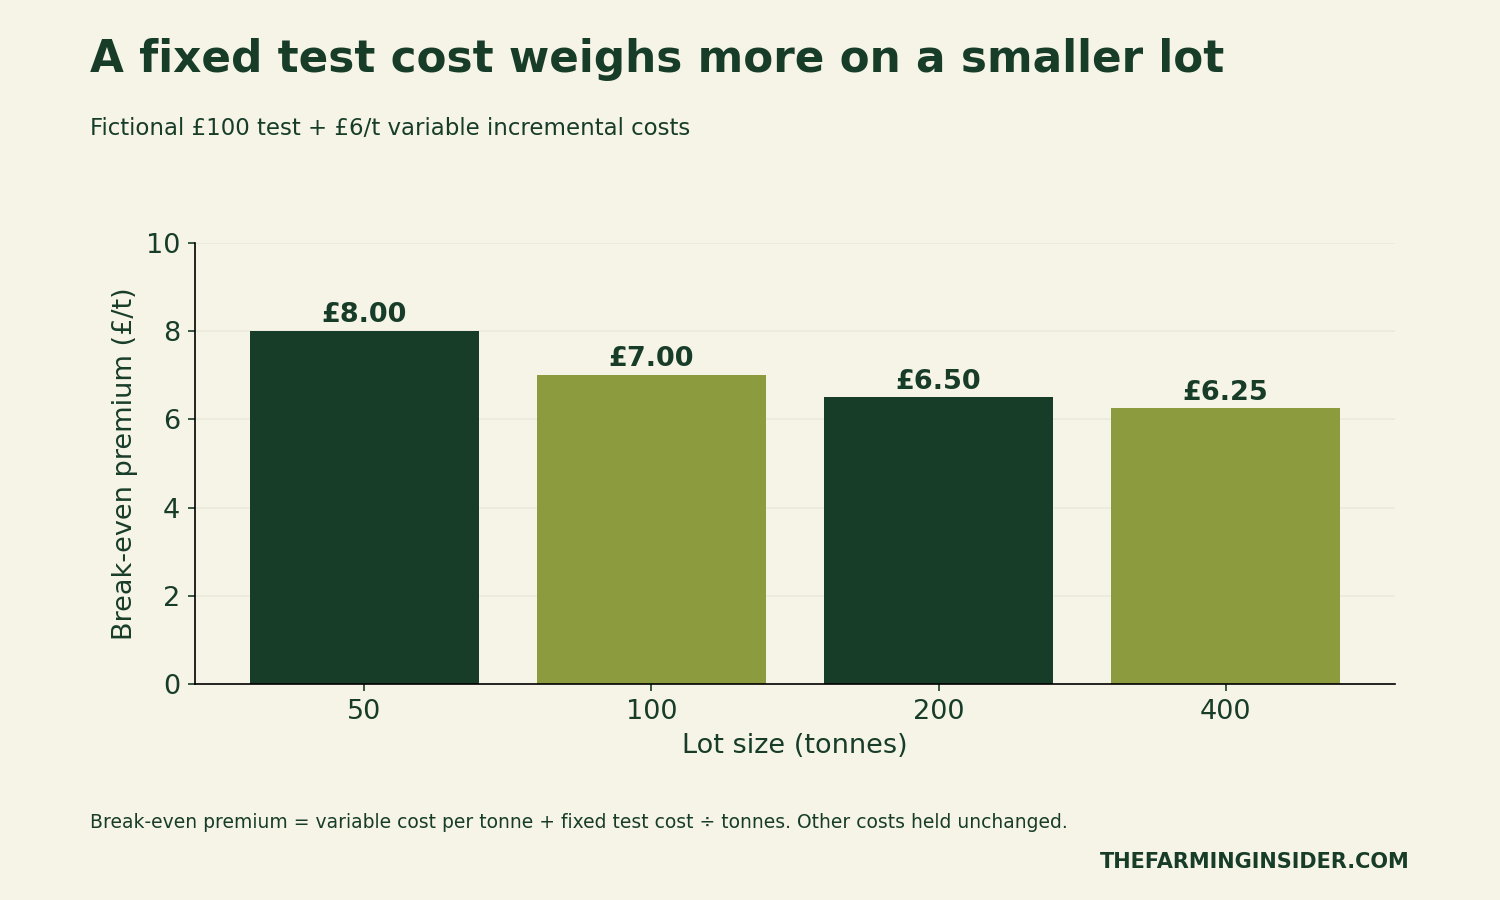
This check helps identify a question to ask, not a reason to merge grain indiscriminately. Combining lots can change traceability, quality and contract obligations. Keep the analytical lot definition aligned with what will actually be sampled, stored and delivered.
Test transport costs before committing
The same premium can produce different returns when the extra transport cost changes. Figure 4 holds the fictional 200 tonnes, £2/t segregation charge and £100 test constant. Each cell changes only the premium and the extra haulage cost.
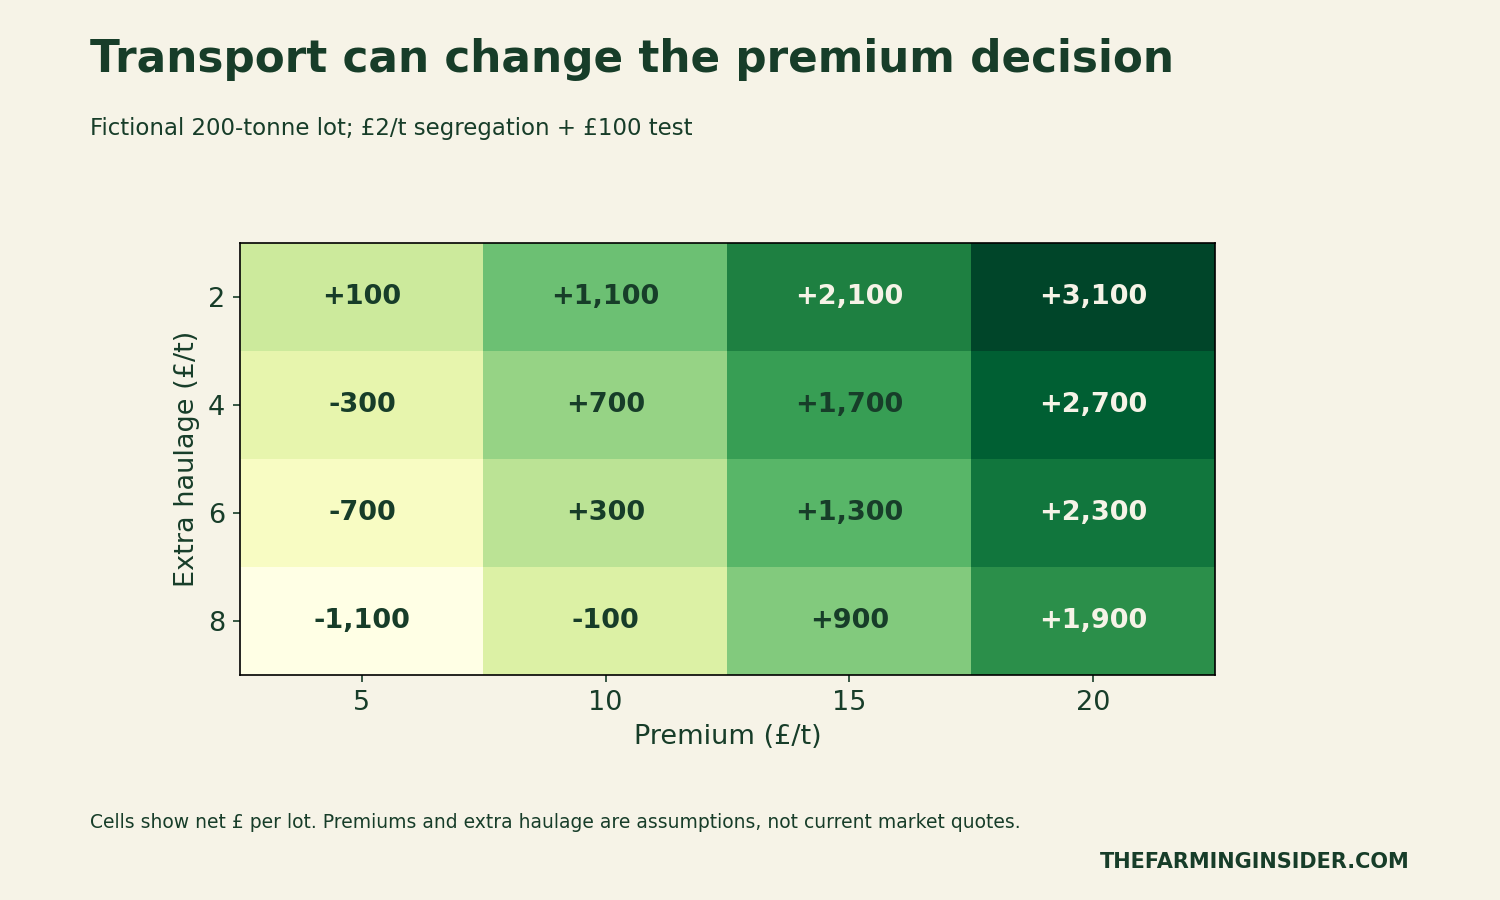
For instance, a £10/t premium with £8/t extra haulage leaves minus £100 after the other assumed costs. A £15/t premium with £4/t extra haulage leaves £1,700. Keeping the comparison basis visible makes those differences easier to discuss with a merchant or adviser.
Model regrading without inventing its probability
Ask what happens if the lot is regraded or rejected. The answer belongs in the contract, including who pays any extra handling or return costs. Do not substitute a national survey percentage for those terms.
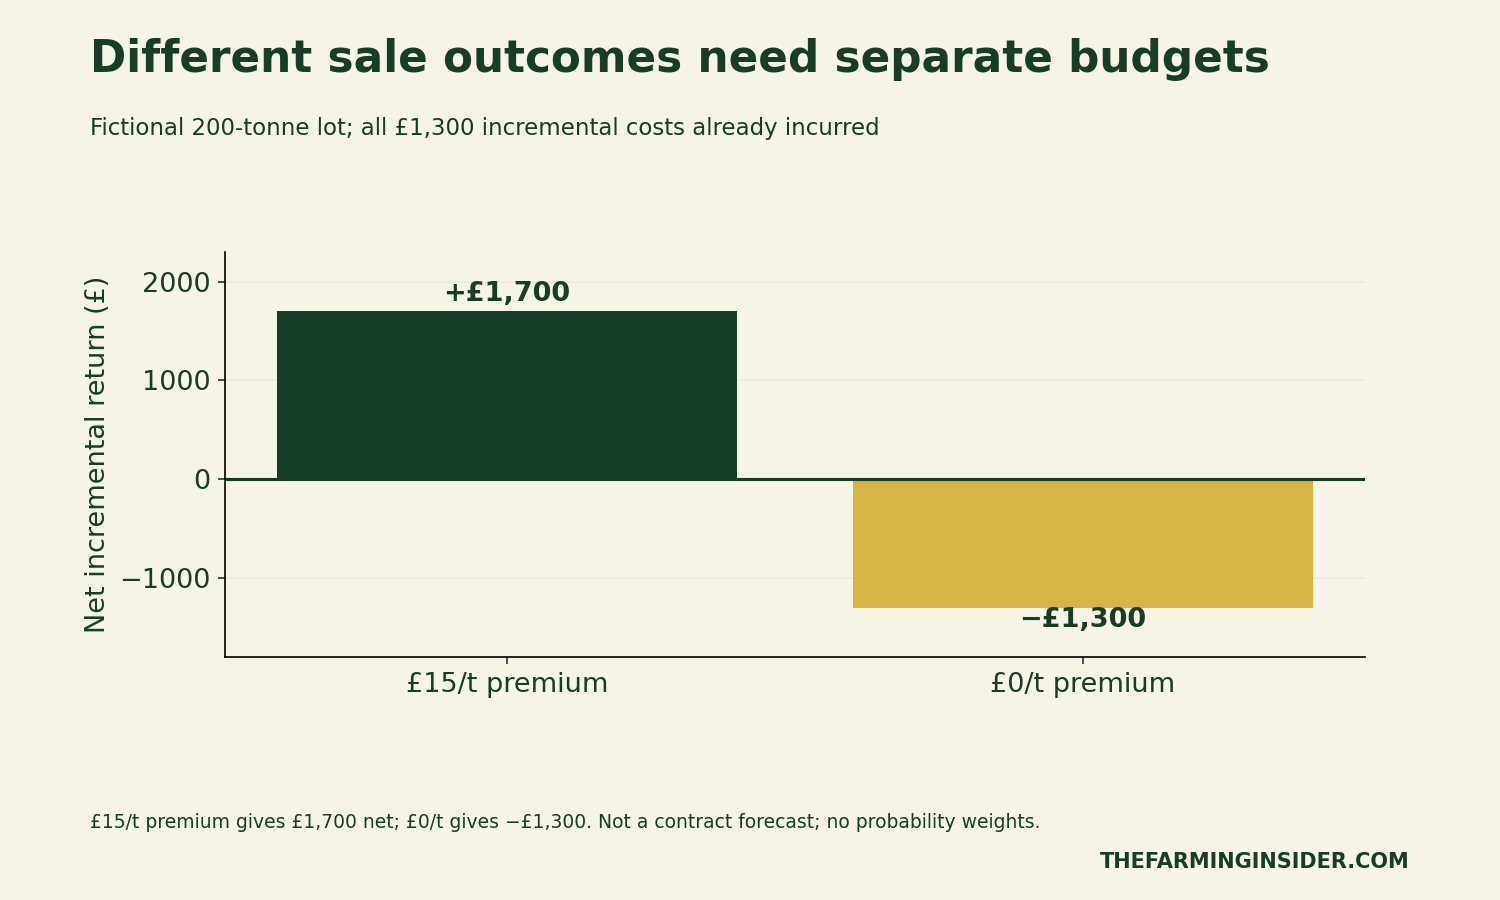
Our second fictional outcome removes the premium while leaving all £1,300 of extra costs already incurred. It produces minus £1,300. The first outcome retains the £15/t premium and produces plus £1,700. Real regrading terms may change several inputs, so neither row predicts your outcome.
Download the original planning tools
Worked net-premium example (CSV) records the arithmetic behind the £1,700 result and £6.50/t threshold.
Blank contract and lot-check sheet (CSV) separates buyer thresholds from laboratory results and records their units and references.
Blank incremental-cost ledger (CSV) helps keep the outlet comparison and quote dates explicit.
Original premium sensitivity scenarios (CSV) provides the fictional lot-size and premium combinations for checking the calculations.
The files are editable records, not automatic calculators or official grading forms. They contain our original planning examples, not AHDB's survey tables. Consult the official survey for its full data and reuse terms.
Methods and limits of this analysis
We checked the UK milling wheat quality 2026 source and constructed a separate hypothetical cost model. All five charts use stated editorial assumptions. No farm's actual grain results, merchant quotes, acceptance probabilities or confidential contract terms were collected. Rounded published percentages cannot establish exact pass counts.
For a related example of checking a workbook's inputs before trusting its output, see our USDA corn-yield correction audit. Our Canada CEA cash-share guide covers a different programme but makes the same accounting distinction between a headline figure and a documented funding requirement.
Suggested citation: The Farming Insider, “UK Milling Wheat Quality 2026: Check Your Net Premium,” 6 November 2026. Attribute survey findings to AHDB and the fictional cost scenarios to this analysis.