






US Rice Production 2026: Separate Acreage Loss From Yield Performance
A smaller national rice crop can coexist with stronger yield. Separate harvested acreage, yield performance and the monthly forecast revision before interpreting the headline.

Why Farmland Owners Must Prepare for More Frequent Climate Disasters
Increasing Climate Disasters and Agricultural Risk Climate disasters now affect farming regions worldwide with increasing frequency. Droughts, floods,…

Australia Kiwifruit Import Review: Draft, Not Approval
The kiwifruit proposal is a draft, not import approval. Two charts, a status-gate infographic and four CSV tools explain the pest list and proposed controls.

UK Cereal Demand: Home-Grown Wheat and Buyer Channels
A falling wheat total can contain rising home-grown use. Three charts and four CSV tools separate cereal origins, buyer channels and the evidence needed for an enquiry.

USDA Corn Forecast Uncertainty: Read the Range
Read the November national corn forecast as a point and a range. Four charts and four CSVs keep historical errors, farm quantity and local-price assumptions separate.

Farm Operating Loan Interest Budget: Cash vs Collateral
Rising land values are not repayment cash. Read regional credit evidence and use four charts, a two-ledger infographic and four interest-budget CSV tools.
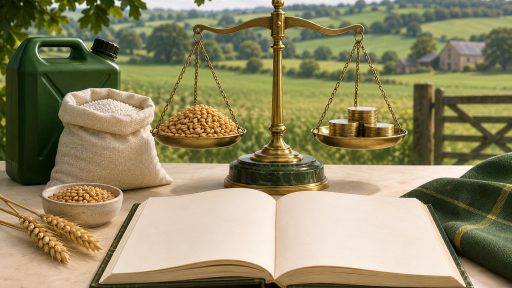
UK Farm Input Costs vs Output Prices: Test Your Budget
A national price gap is not a profit change. Use five charts, a two-bridge infographic and four CSVs to test your own farm cost exposure.
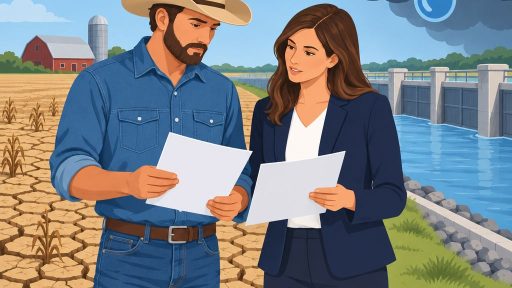
Real Estate Challenges of Farming in High-Risk Climate Zones
Overview of High-Risk Climate Zones High-risk climate zones face greater exposure to climate-related hazards. These areas also experience…
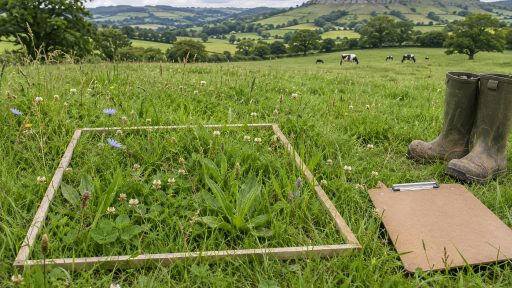
Herbal Ley Establishment: Measure Before Scaling Up
A farm case study can guide questions without proving a yield gain. Use blank monitoring charts and four CSV tools to plan local evidence with an adviser.
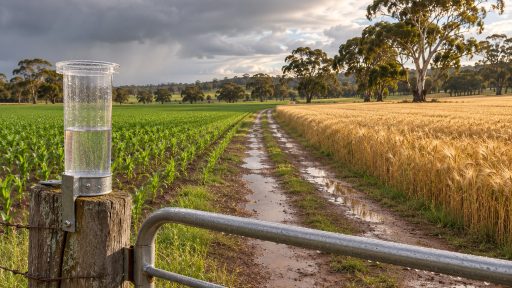
Queensland NSW Rainfall: A Fieldwork Evidence Log
Separate regional rainfall, dated forecasts, paddock measurements and fieldwork decisions. Includes two figures, an infographic and four free CSV tools.