




A dairy milk budget can weaken even when the price per litre rises. If you sell fewer litres, a small price increase may not protect the milk cheque. In our hypothetical example, 975,000 litres at 41p earns £399,750. That is £250 below the £400,000 baseline, before any change in costs.
AHDB’s latest September report gives GB producers a reason to test this relationship. However, the useful question is farm-specific: what realised price would cover your chosen revenue target and net extra costs?
This report provides five original scenario charts, a calculation formula and a copyable worksheet. All model prices, output levels and cost changes are illustrative. They are not market quotations, forecasts or estimates of whole-farm profit.
What the GB milk-delivery report says
In its 15 October 2026 deliveries report, AHDB estimates September GB volume at 998 million litres. That was 26 million litres, or 2.5%, below the previous year. GB covers England, Scotland and Wales; it excludes Northern Ireland.
The supporting weekly deliveries dataset shows 33.93 million litres per day for the week ending 10 October. Its year-earlier comparison is 35.08 million, a reported fall of 3.3%. These are seven-day rolling daily averages.
AHDB surveys buyers covering about 80% of GB volume and scales the results. Estimates can change retrospectively. Therefore, keep the observation date and data version with any comparison. A national decline does not establish your herd’s future output or contract price.
Calculate the price your dairy milk budget needs
Choose one consistent budget period. Then enter baseline saleable litres, the realised baseline price and expected new litres. Use actual milk statements where possible, with the same treatment of payments and deductions throughout.
Our baseline is 1,000,000 litres at 40p per litre. Multiplying and converting pence to pounds gives £400,000 gross milk revenue. With no cost change, preserving that revenue at 975,000 litres requires about 41.03p per litre.
Baseline revenue (£) = baseline litres × baseline pence per litre ÷ 100.
Required price (pence per litre) = 100 × (baseline revenue + net extra costs) ÷ expected saleable litres.
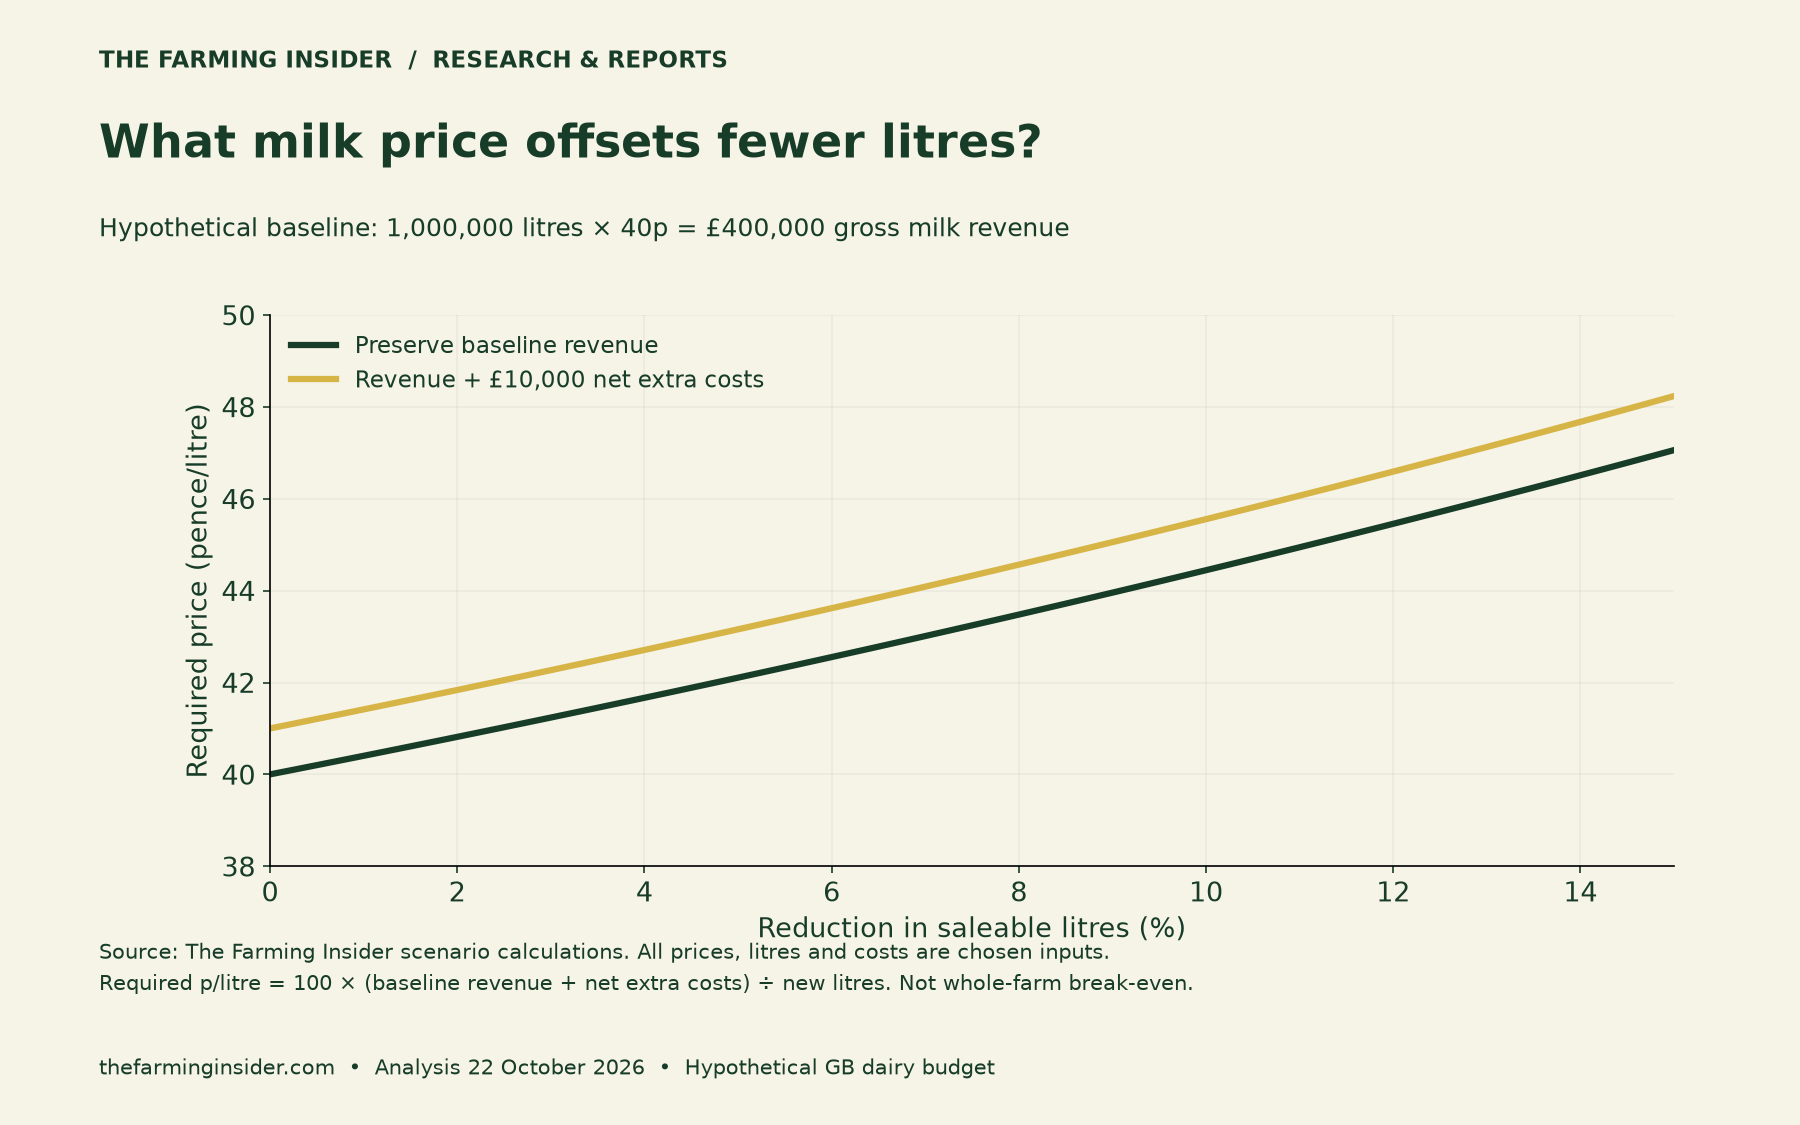
The upper line includes a hypothetical £10,000 net cost increase over the same period. At 975,000 litres, the required price becomes about 42.05p. Neither line represents a guaranteed offer from a processor.
Copy the price sensitivity table
| Volume reduction | Saleable litres | Preserve £400,000 revenue | Also cover £10,000 net extra costs |
|---|---|---|---|
| 0% | 1,000,000 | 40.00p/litre | 41.00p/litre |
| 2.5% | 975,000 | 41.03p/litre | 42.05p/litre |
| 5% | 950,000 | 42.11p/litre | 43.16p/litre |
| 10% | 900,000 | 44.44p/litre | 45.56p/litre |
Displayed prices round to two decimal places. Keep full precision in a working spreadsheet, particularly when applying the result to a large volume. Rounding a required price slightly down can leave a small residual shortfall.
Test the milk cheque before assuming a gain
A price rise from 40p to 41p is 2.5%. Yet a 2.5% volume fall has a different denominator. At 975,000 litres, the new milk cheque is £399,750, compared with the original £400,000.
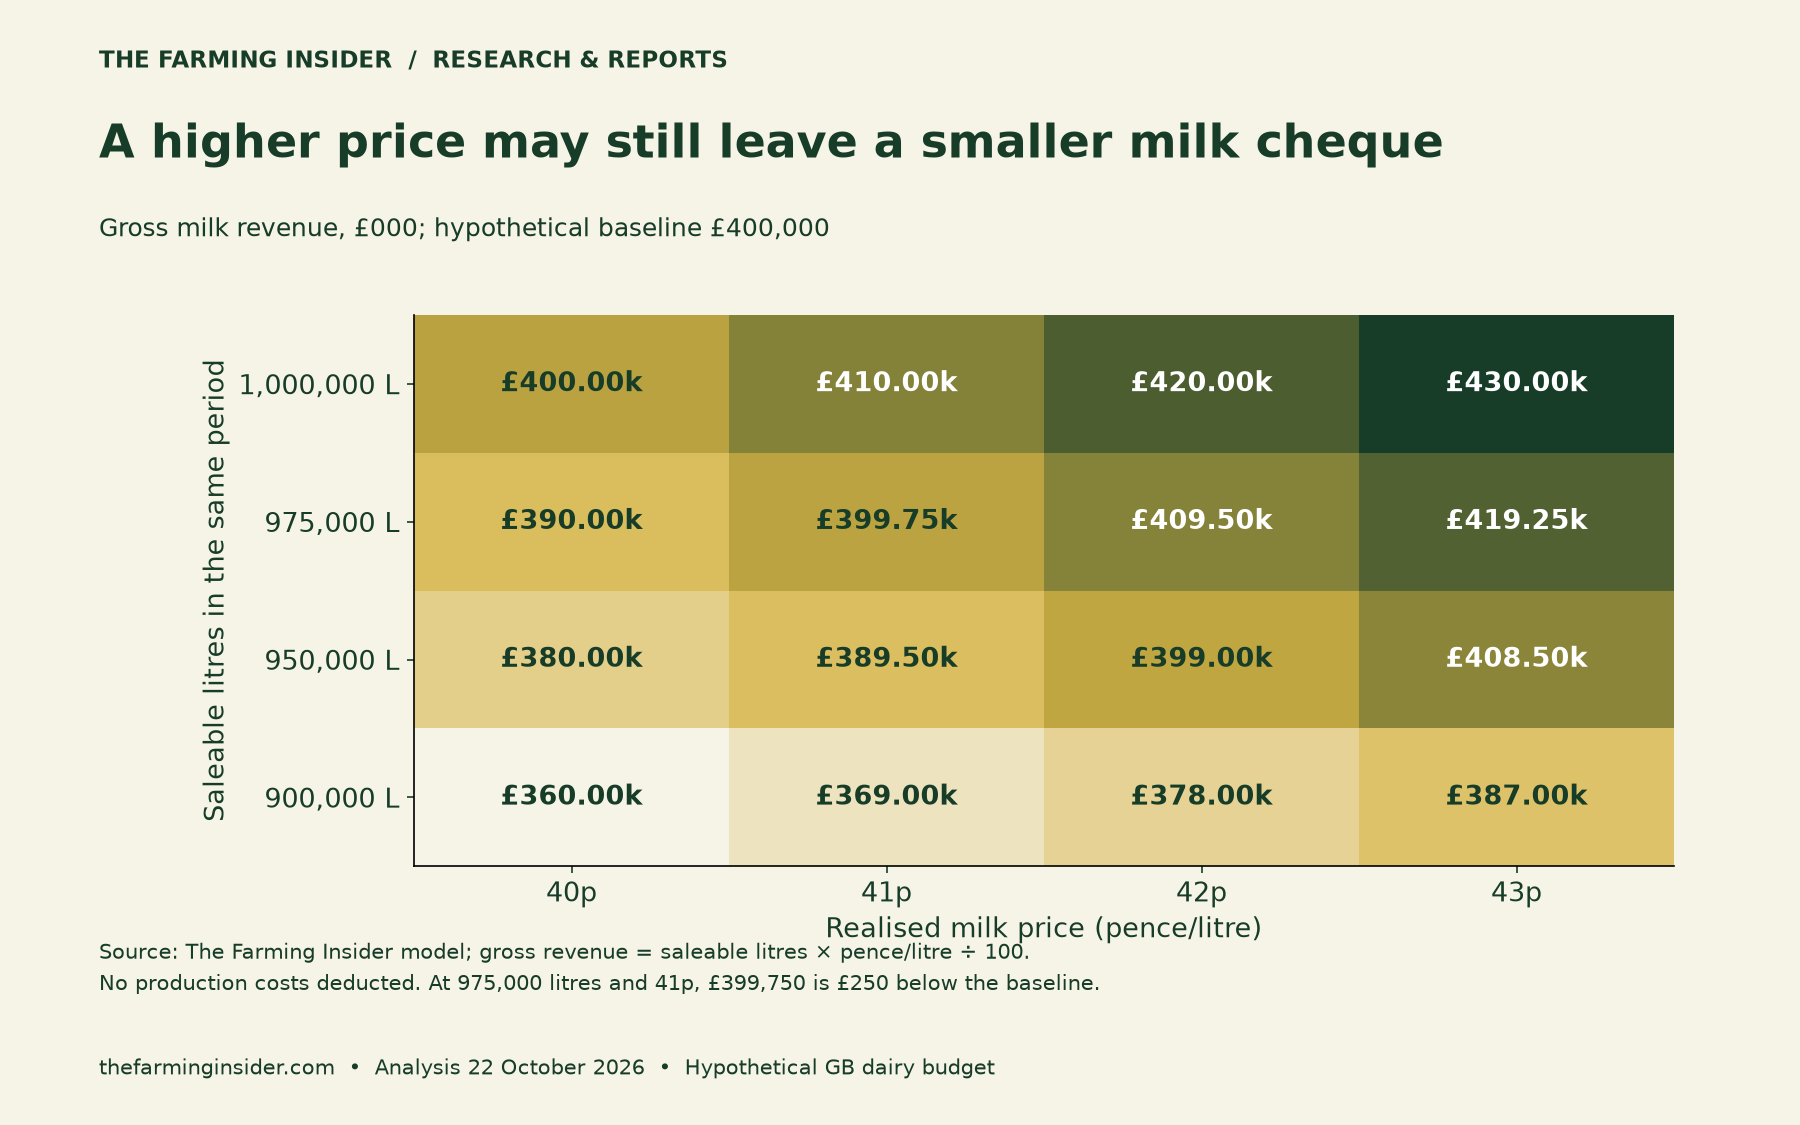
Read each matrix cell as gross milk revenue. For example, 950,000 litres at 42p produces £399,000. That is still £1,000 short of the baseline. By contrast, the same volume at 43p produces £408,500 before costs.
These comparisons can help you test a proposed budget assumption. They cannot tell you whether a higher price is available. Your contract, milk composition, quality, seasonality and any relevant deductions need their own checks.
Include winter costs and genuine savings
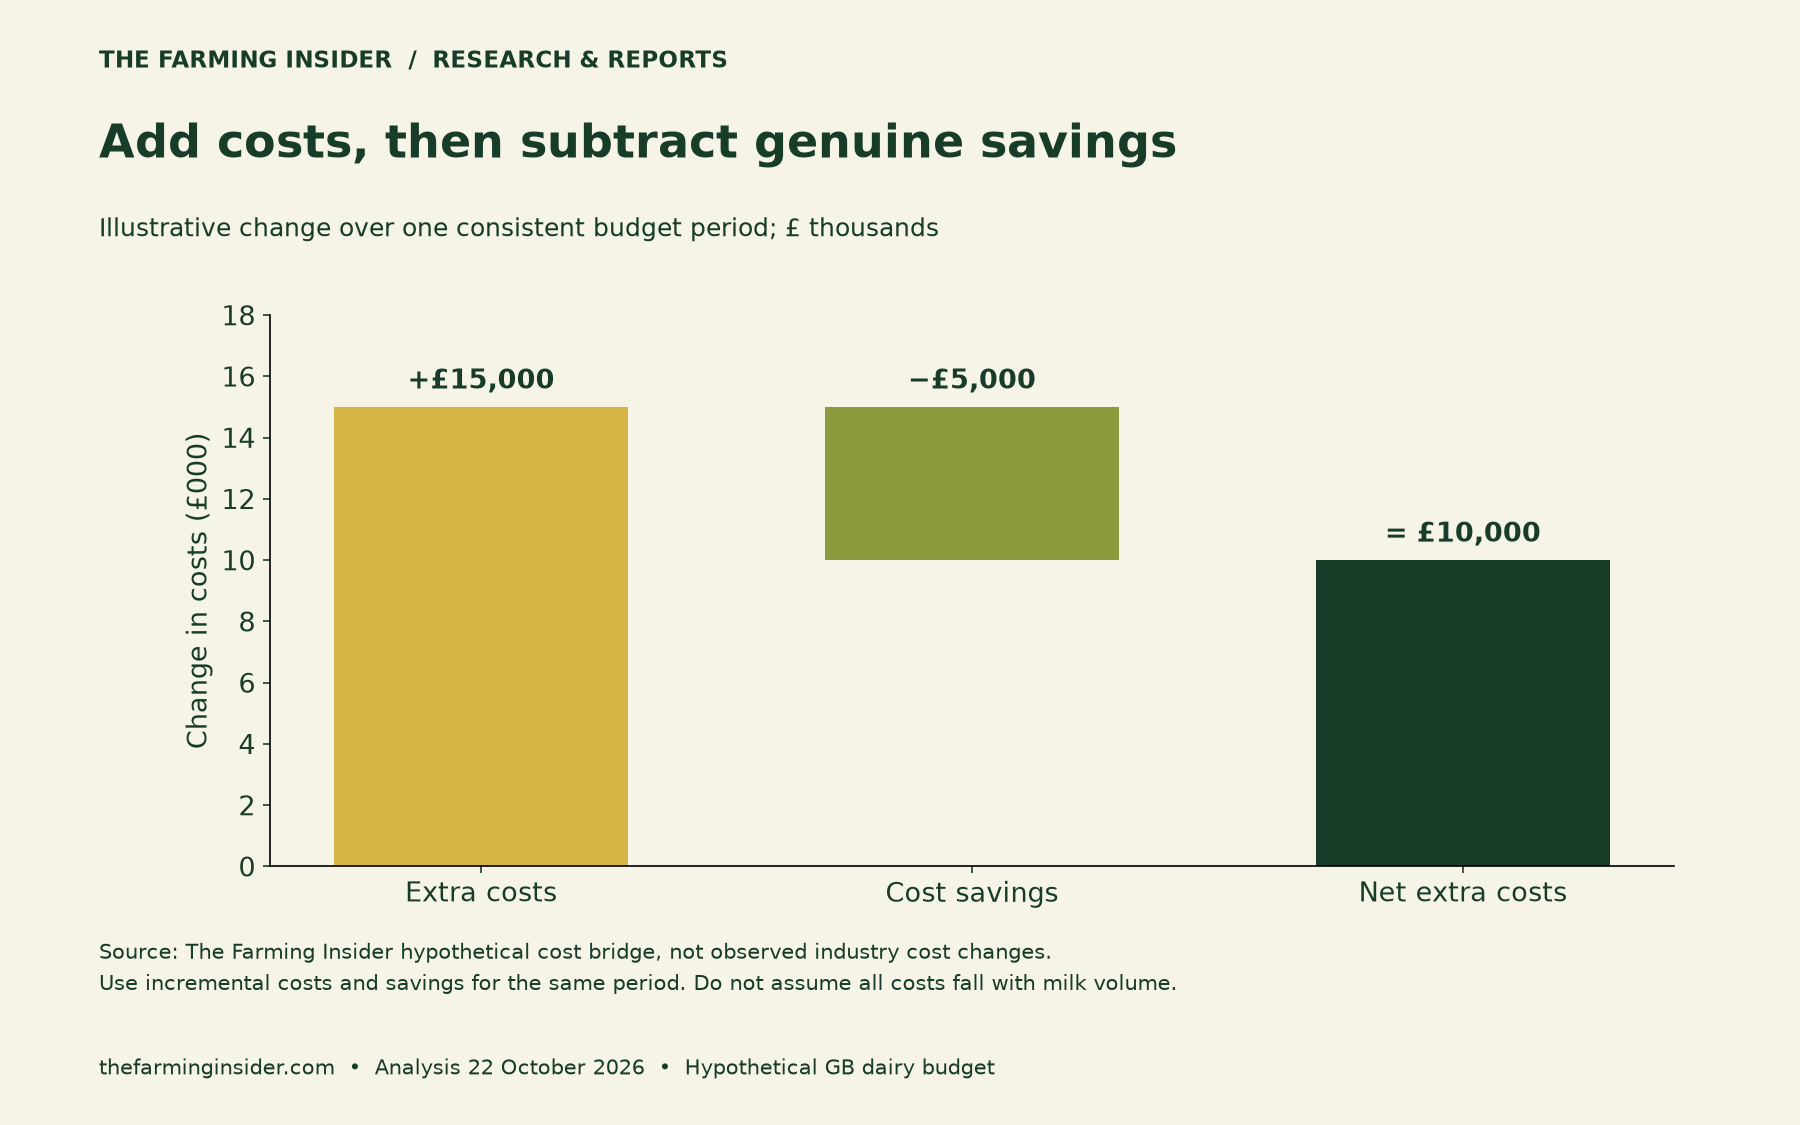
Next, identify the costs that change between your baseline and new plan. Add extra bills, then subtract savings that you can support. Do not assume that every cost falls in proportion to milk volume.
Transform Your Agribusiness
Unlock your farm's potential with expert advice tailored to your needs. Get actionable steps that drive real results.
Get Started
Our cost bridge uses £15,000 of extra costs and £5,000 of savings. The result is £10,000 net extra cost. This is an example of the method, not evidence that a typical GB farm faces either amount.
For feed planning, the Scottish Farm Advisory Service forage-budget guide offers an established method. Its August 2025 guidance considers stock numbers, feeding days, dry matter, wastage and contingency. Use the appropriate nutrition advice to build the physical feed plan before pricing it.
Then separate volume from price effects. An extra tonne of feed and a higher price for feed already planned are different changes. Keep both visible, while avoiding double counting the same invoice in two budget lines.
Why equal percentage changes do not cancel
With costs held unchanged, the required price uplift equals one divided by the remaining volume fraction, minus one. A 2.5% fall leaves 97.5% of the original litres. Dividing one by 0.975 gives a required uplift of about 2.56%.
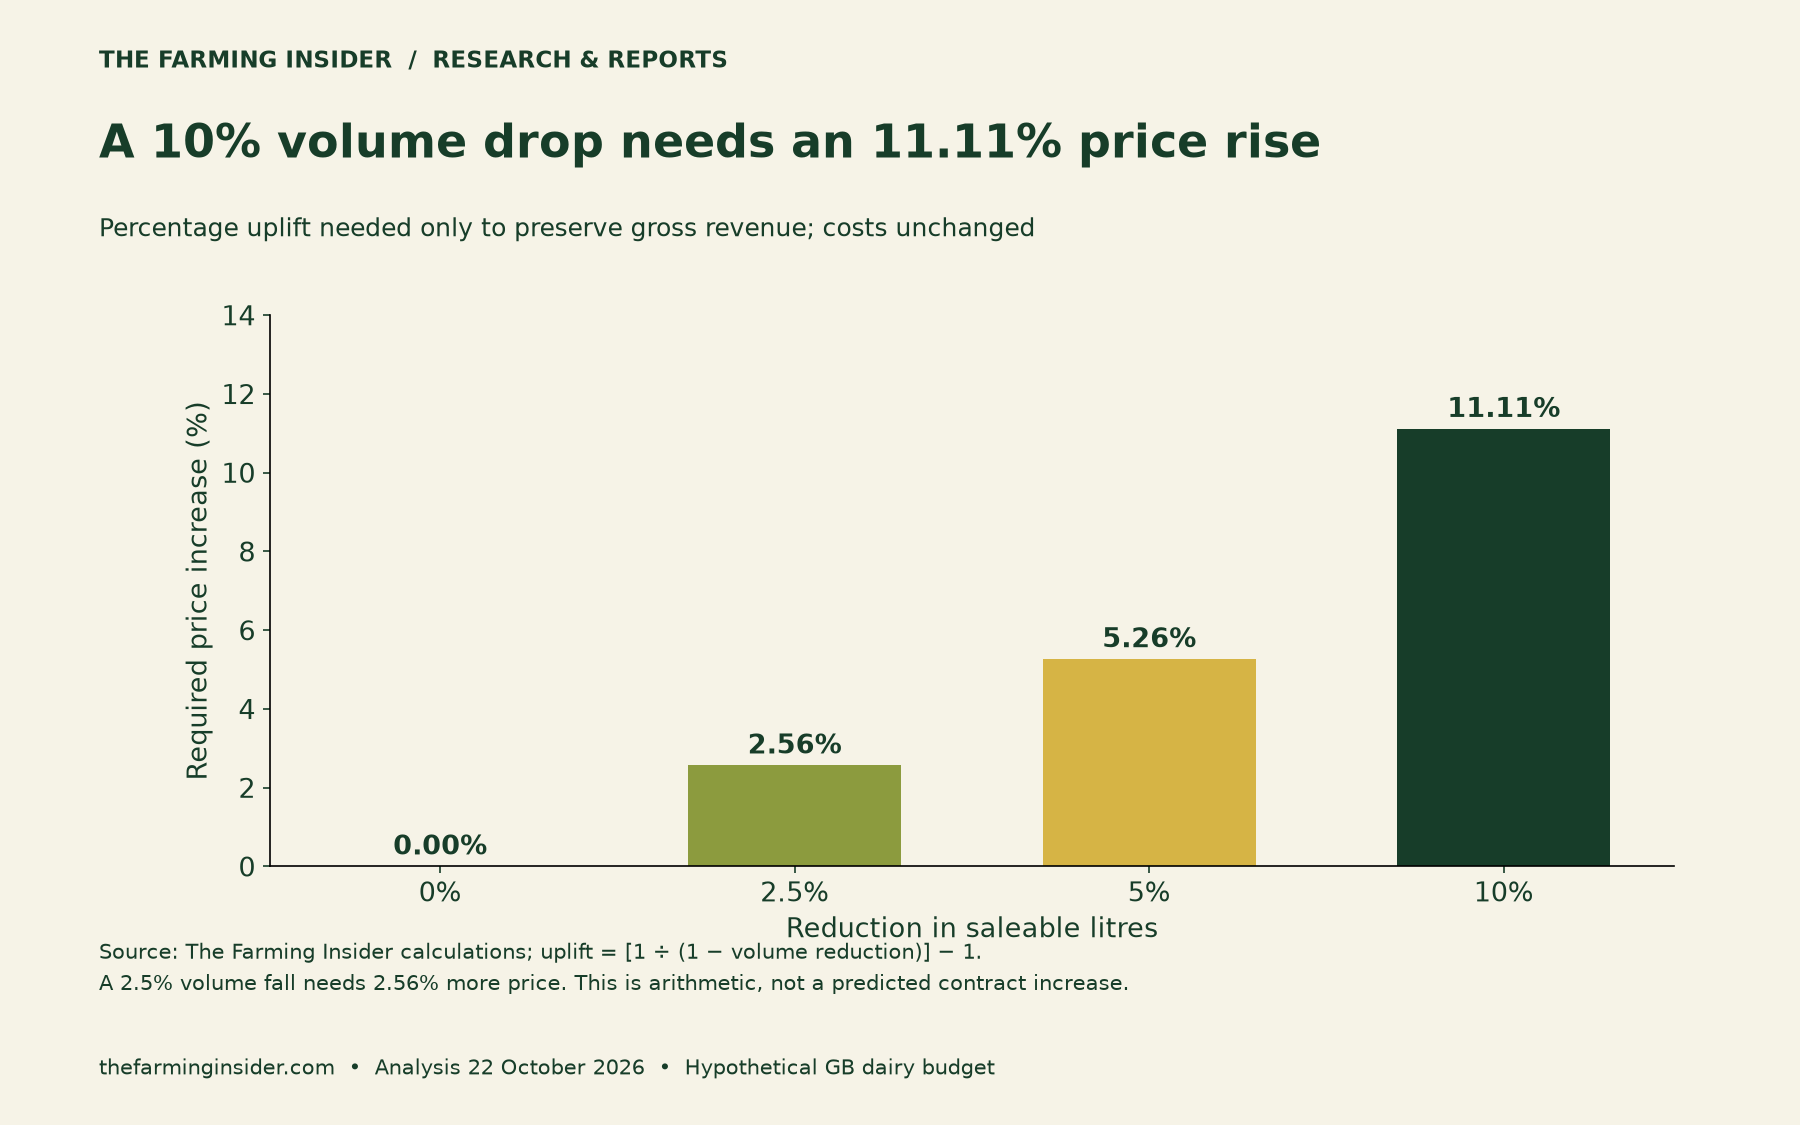
The gap grows as volume falls. A 10% reduction needs an 11.11% price increase merely to preserve revenue. This relationship works at other starting prices too, provided the comparison uses consistent units and periods.
However, it still leaves costs outside the calculation. If the original business lost money, preserving its revenue does not cure that loss. Likewise, meeting the adjusted target does not establish a profitable whole-farm plan.
The same extra bill has a different per-litre burden
A £10,000 net extra bill adds 1p per litre across 1,000,000 saleable litres. Across 500,000 litres, it adds 2p. Spread costs across expected saleable output, rather than milk that will not generate a payment.
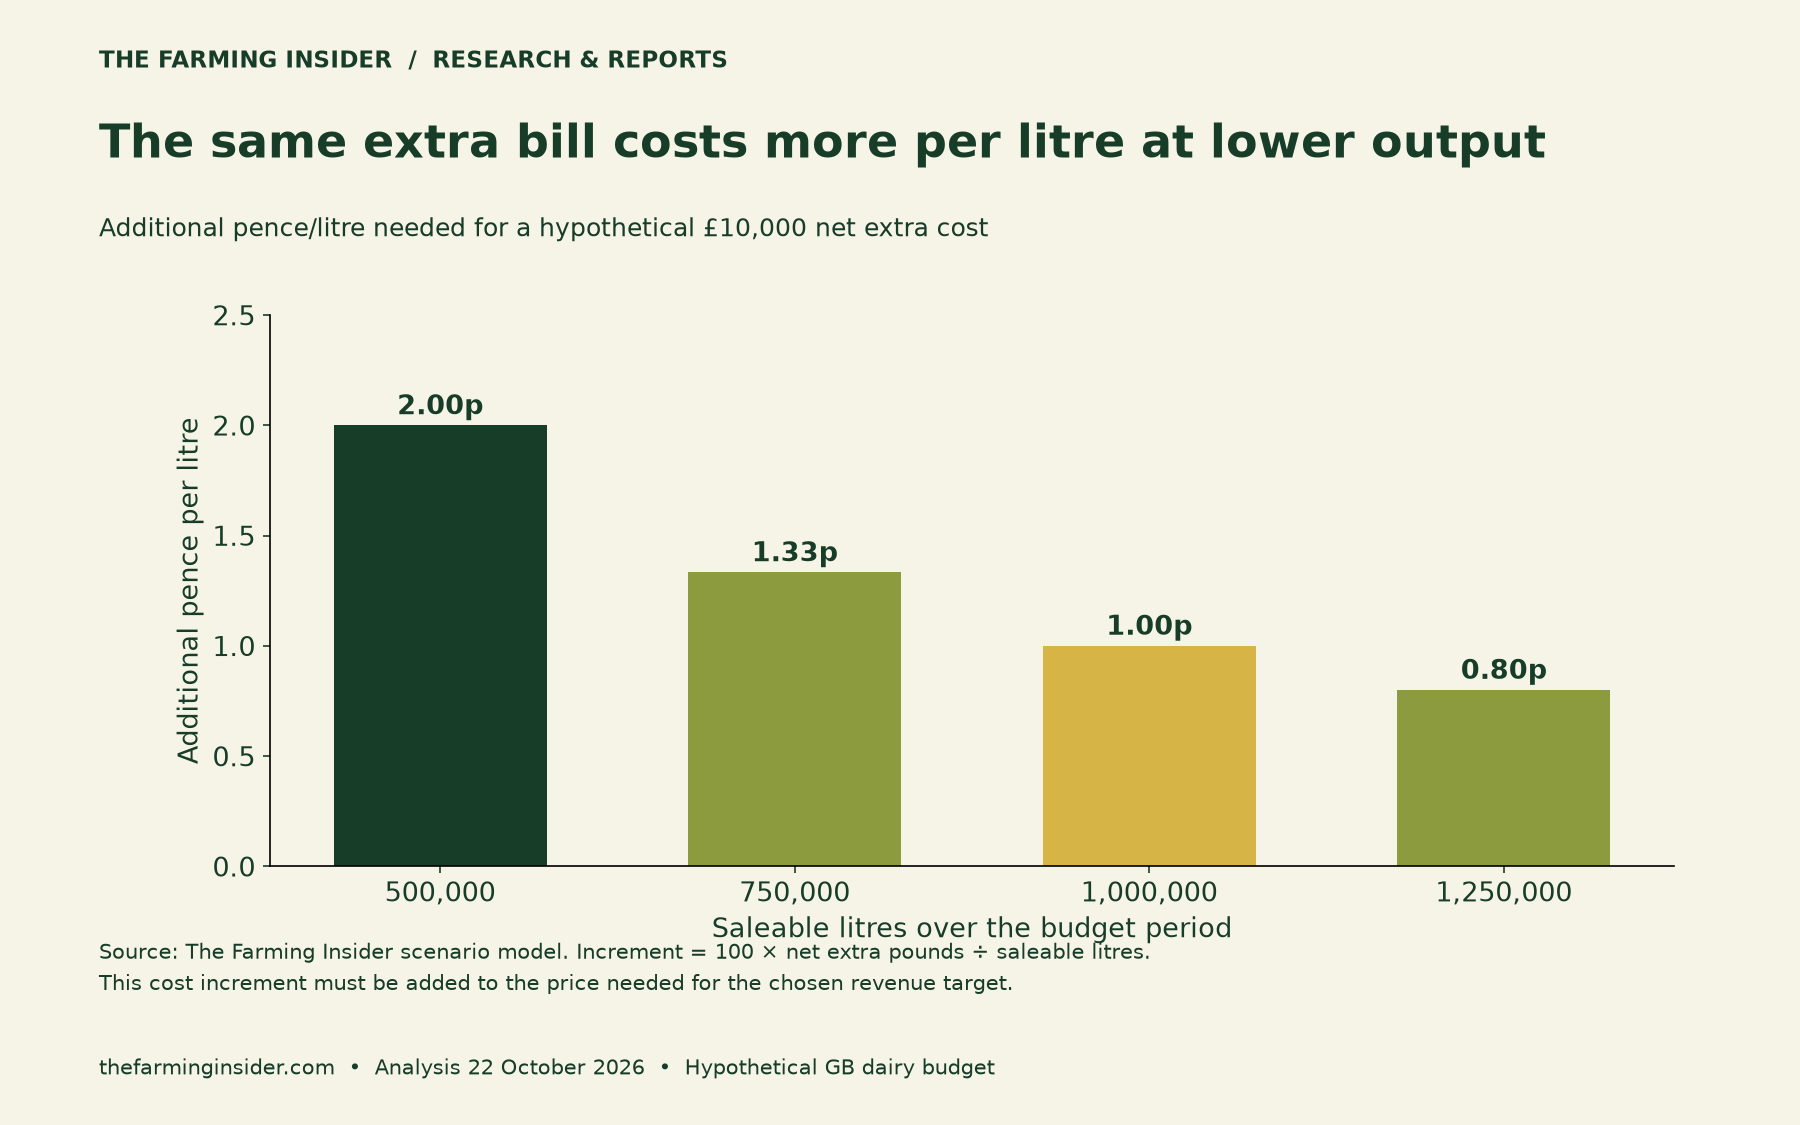
This last chart isolates the cost increment. Add it to the price needed for your chosen revenue target. Do not confuse that increment with the complete required milk price.
Your dairy milk budget worksheet
| Budget line | Example | Evidence to enter |
|---|---|---|
| Period | One consistent planning period | Start and end dates |
| Baseline saleable litres | 1,000,000 | Milk statements and records |
| Baseline realised price | 40p/litre | Consistent treatment of payments and deductions |
| Expected saleable litres | 975,000 | Farm forecast, with assumptions |
| Extra costs less savings | £10,000 | Itemised changes, quotes and timing |
| Required adjusted price | 42.05p/litre, rounded | Formula above; retain full precision |
For wider planning, use our financial-analysis tools for farmers. Record the milk calculation alongside other income, overheads, finance and cash timing. A milk-cheque target is one part of that larger budget.
Methods and limitations
We checked the cited sources on 22 October 2026. The news hook concerns September GB deliveries; the supporting rolling observation ends on 10 October. We exclude the news report’s inconsistent daily-volume narrative and do not reproduce AHDB’s charts or dataset wholesale.
All five graphics show our own hypothetical calculations. We calculate before rounding, convert pence to pounds explicitly, and use saleable litres as the denominator. No chart is a milk-price forecast or an observed farm-profit comparison.
Refresh your own volumes, net cost changes and contract terms before using the worksheet. Keep revenue preservation, additional cost recovery and whole-farm profitability as separate questions.