




Grapevine drought stress soil moisture research can be easy to misread when two different percentages look alike. A relative value of 0.33 is not a sensor instruction to wait for 33% volumetric water. The conversion depends on the soil's field capacity and permanent wilting point.
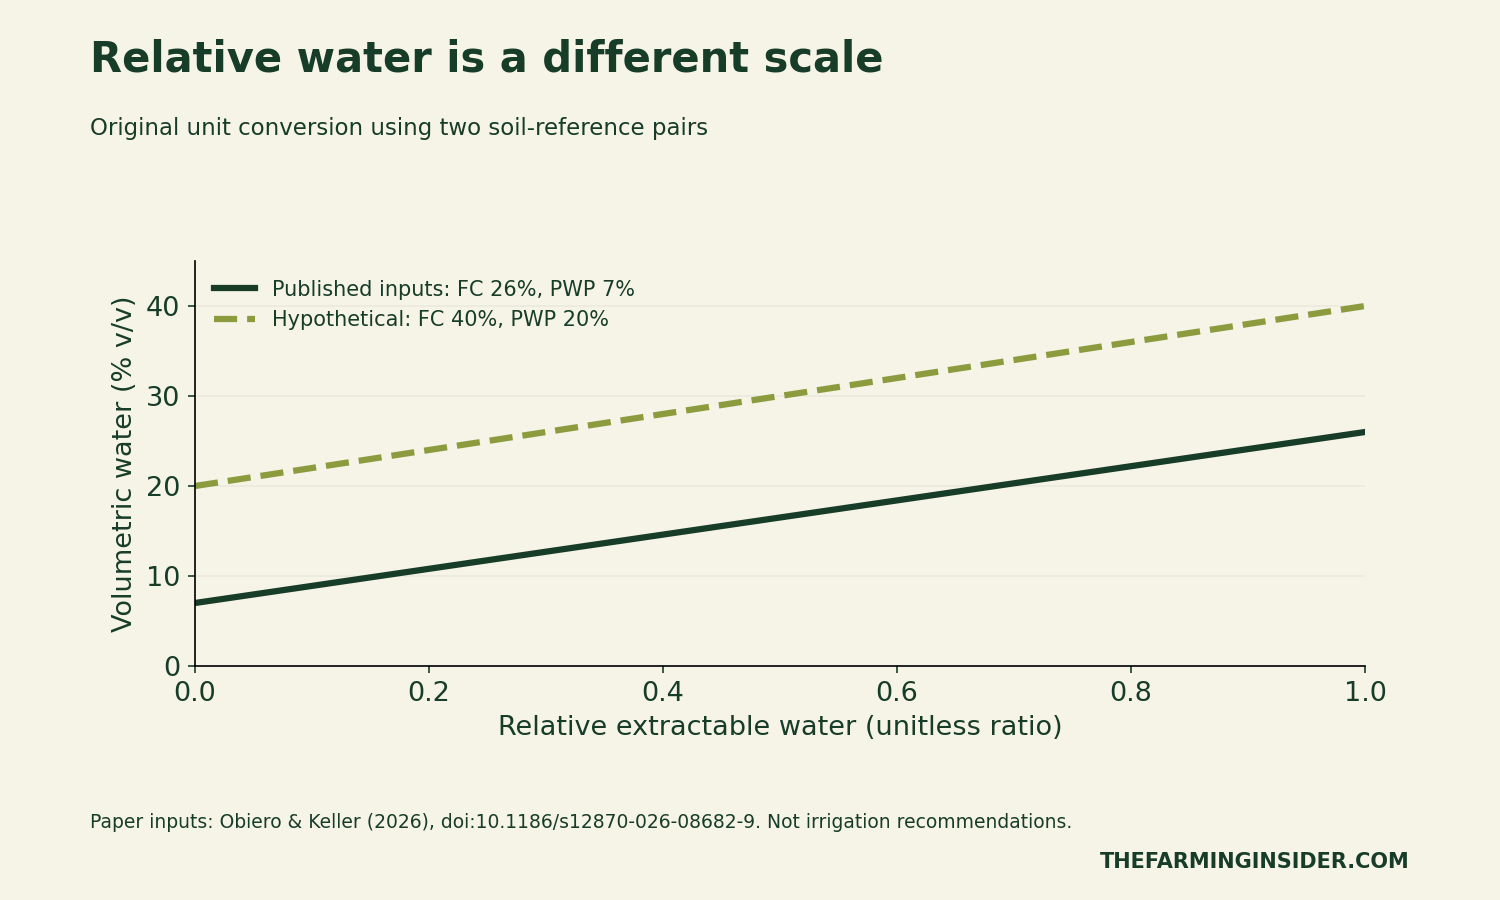
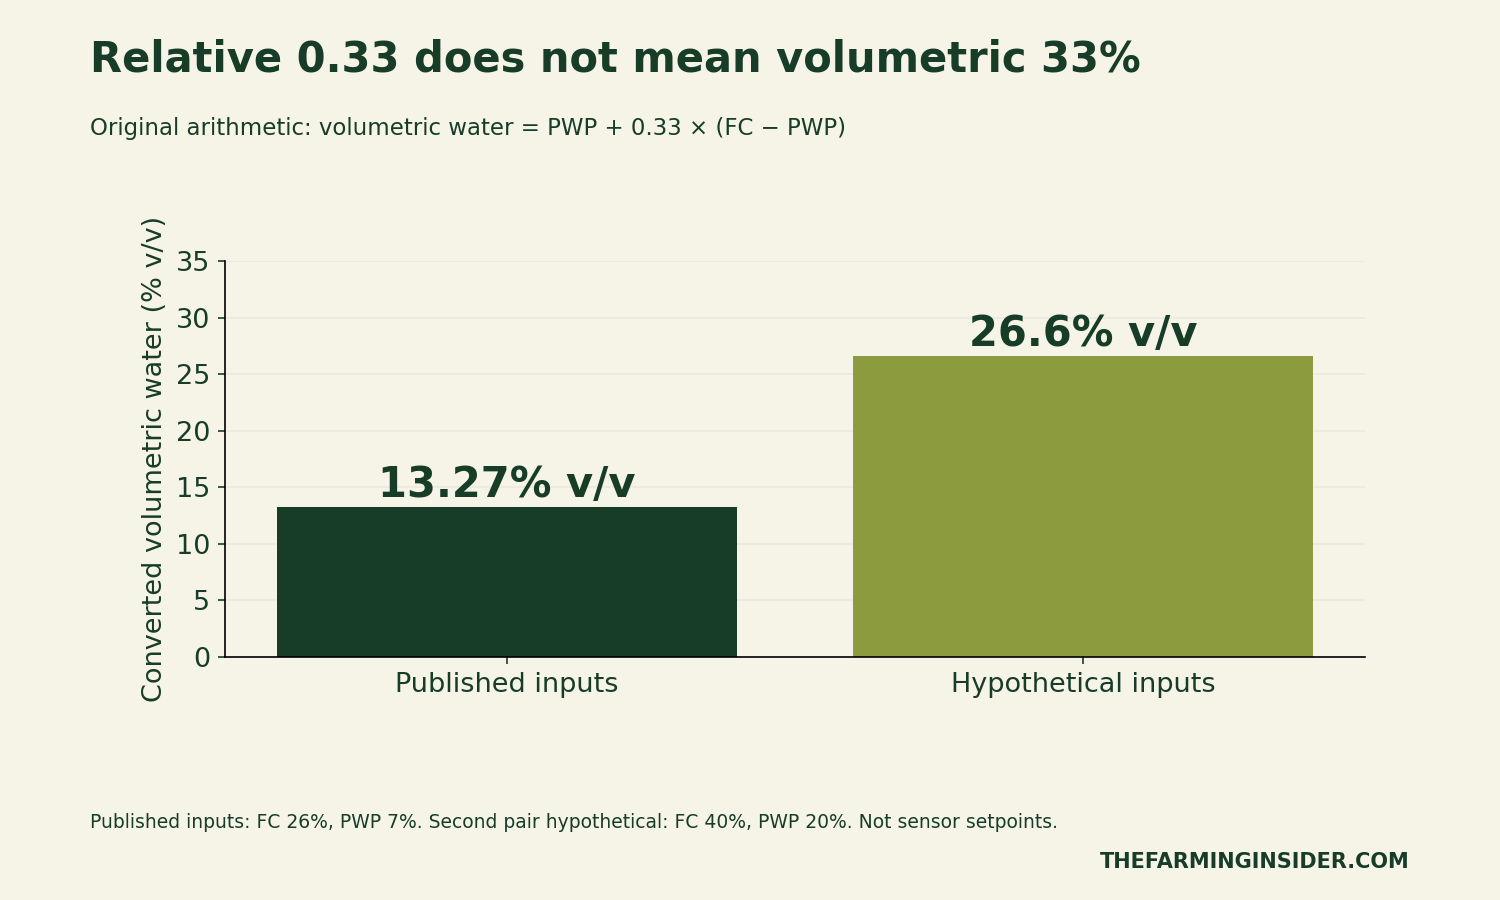
Using the published study's inputs, the conversion gives 13.27% volumetric water. With a different, hypothetical pair of soil inputs, the same relative value gives 26.6%. Neither number is an irrigation recommendation. Our original charts and four CSV tools explain the arithmetic and the records needed before comparing research with a vineyard sensor.
What the grapevine drought stress study measured
Washington State University's 2 November 2026 report highlights a study whose observations are older than the news. The paper by Charles Obiero and Markus Keller was published on 6 April 2026 and used 2021–2022 Washington vineyard observations.
The research covered 30 own-rooted cultivars with fivefold canopy-size variation, on Warden silt loam over hardpan. It reported declining stomatal conductance below approximately 0.33 relative extractable soil water. Its conversion used field capacity of 26% v/v and permanent wilting point of 7% v/v. Measurements at 30 and 60 cm used a neutron probe. Values above field capacity occurred after irrigation. These are study conditions, not universal management settings.
The practical reading task is therefore to identify the variable before transferring a number. Similar measured physiological patterns do not establish identical irrigation needs across vines or sites. This guide does not rank cultivars, infer a yield response or recommend a sensor trigger.
Two soil moisture measures with different meanings
Volumetric water content describes water volume relative to soil volume. A value written as 13.27% v/v means 0.1327 as a volume fraction. Relative extractable soil water instead expresses a position between two specified soil-water reference values. It is a unitless ratio, even when people express it as a percentage.
For the conversion used here, subtract permanent-wilting-point water from measured volumetric water. Then divide by field-capacity water minus permanent-wilting-point water. Use the same units for all three water-content inputs. Mixing a fraction such as 0.26 with a percentage such as 7 produces a meaningless result.
Relative value = (measured water − wilting-point water) ÷ (field-capacity water − wilting-point water). To work backwards, multiply the relative value by that reference interval and add the wilting-point value.
Reproduce the 13.27% calculation
Start with a relative value of 0.33. The study input interval is 26 − 7 = 19 percentage points. Multiplying 19 by 0.33 gives 6.27 percentage points. Adding the starting value of 7 produces 13.27% v/v.
You can check the result in reverse: (13.27 − 7) ÷ (26 − 7) = 0.33. This inverse check helps catch unit and transcription errors. The two decimal places show the arithmetic on the stated inputs; they do not imply a sensor or field threshold accurate to 0.01 percentage point.
Now use hypothetical inputs of 40% field capacity and 20% permanent wilting point. The calculation becomes 0.33 × (40 − 20) + 20 = 26.6% v/v. This second example changes the soil inputs, rather than changing the relative value.
Why substituting 33% changes the calculation
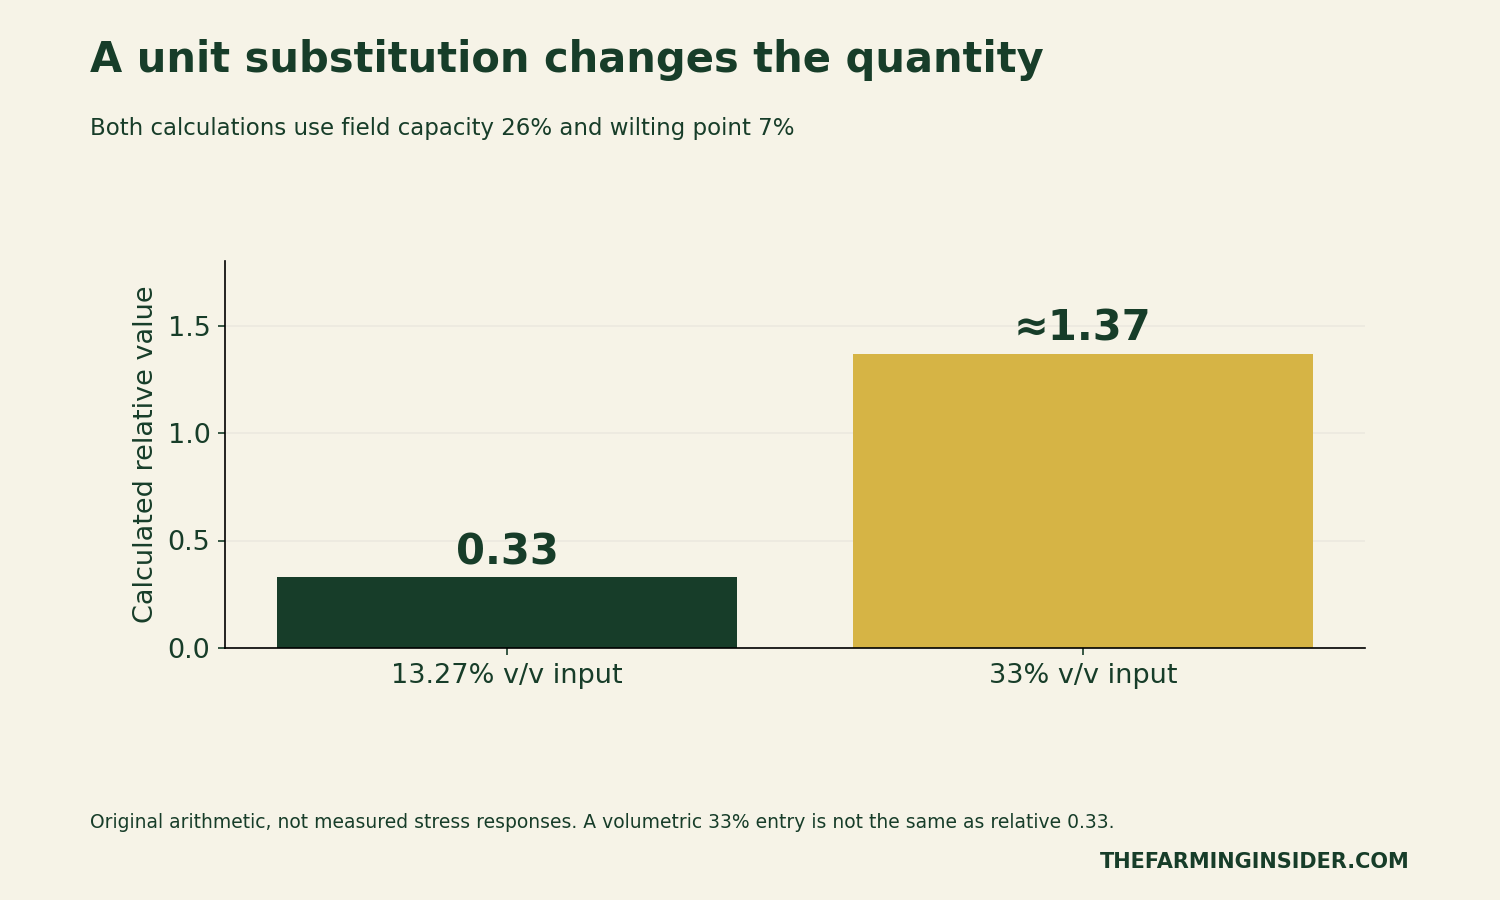
Entering 33 as a volumetric percentage is a different calculation from entering 0.33 as the relative ratio. With the study reference inputs, (33 − 7) ÷ 19 equals approximately 1.37, rather than 0.33. That is a unit interpretation error, not a small rounding difference.
Nor should a spreadsheet automatically cap every relative value at one. A value above one says that the measured input exceeds the specified field-capacity input within this conversion. It does not, by itself, show whether the observation, input values or measurement conditions are appropriate. Preserve the reading and investigate its context.
Sensor readings still need site-specific inputs
Even the same volumetric reading can have different meanings under different reference pairs. Consider a fictional reading of 15% v/v. With hypothetical inputs of 25% and 5%, its relative value is 0.50. With hypothetical inputs of 30% and 10%, its relative value is 0.25.
These examples hold the displayed reading constant to show why the reference values matter. They do not identify two actual soils or assign either vineyard a stress category. An adviser needs the appropriate soil layer, measurement method and local context before interpreting a real reading.
Transform Your Agribusiness
Unlock your farm's potential with expert advice tailored to your needs. Get actionable steps that drive real results.
Get Started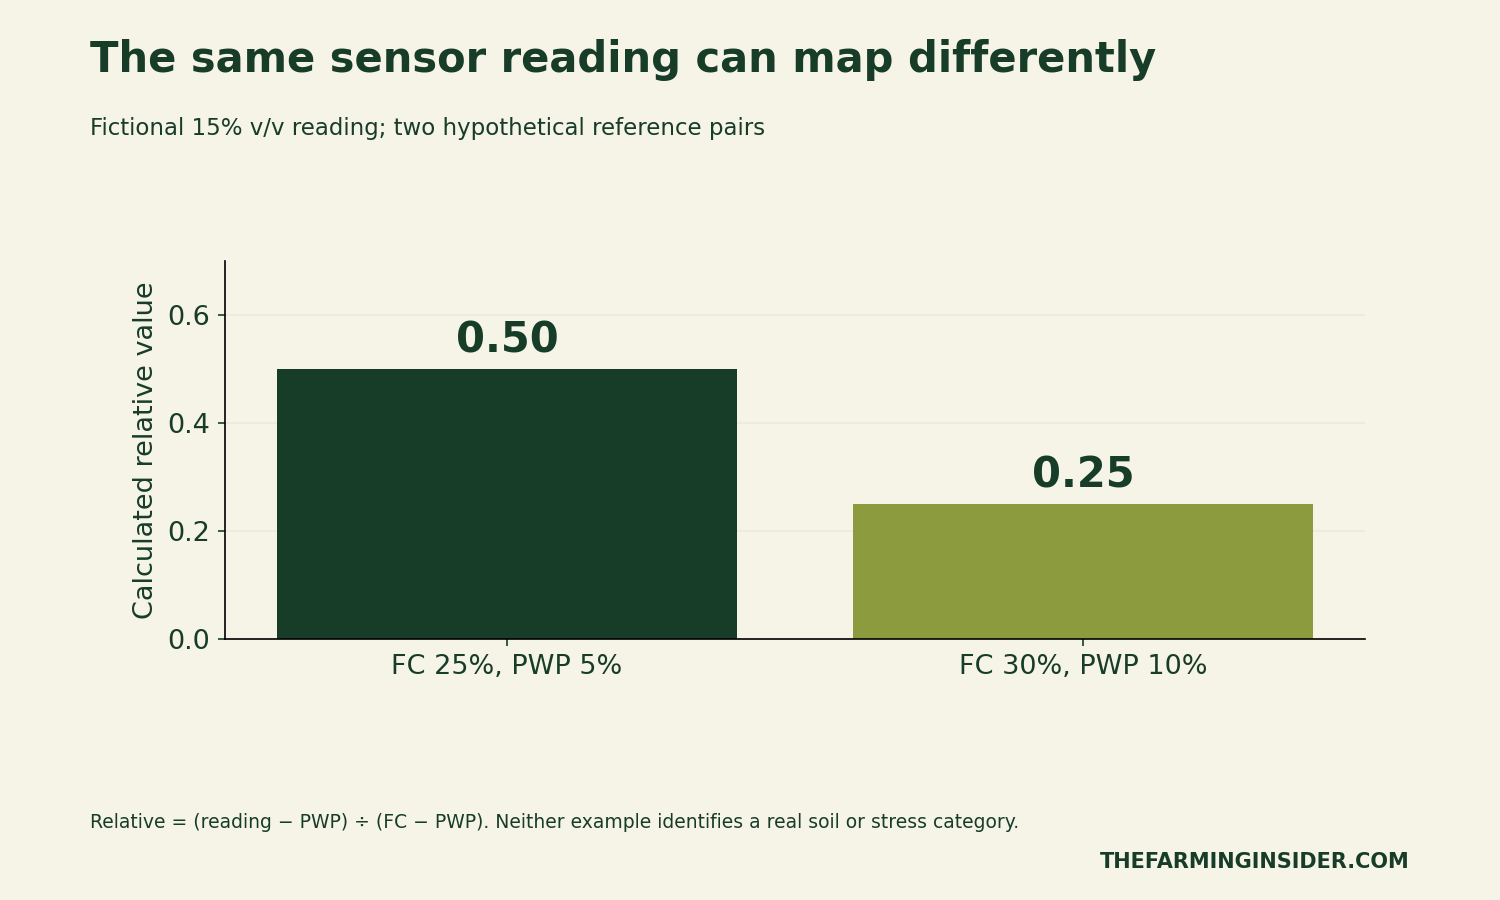
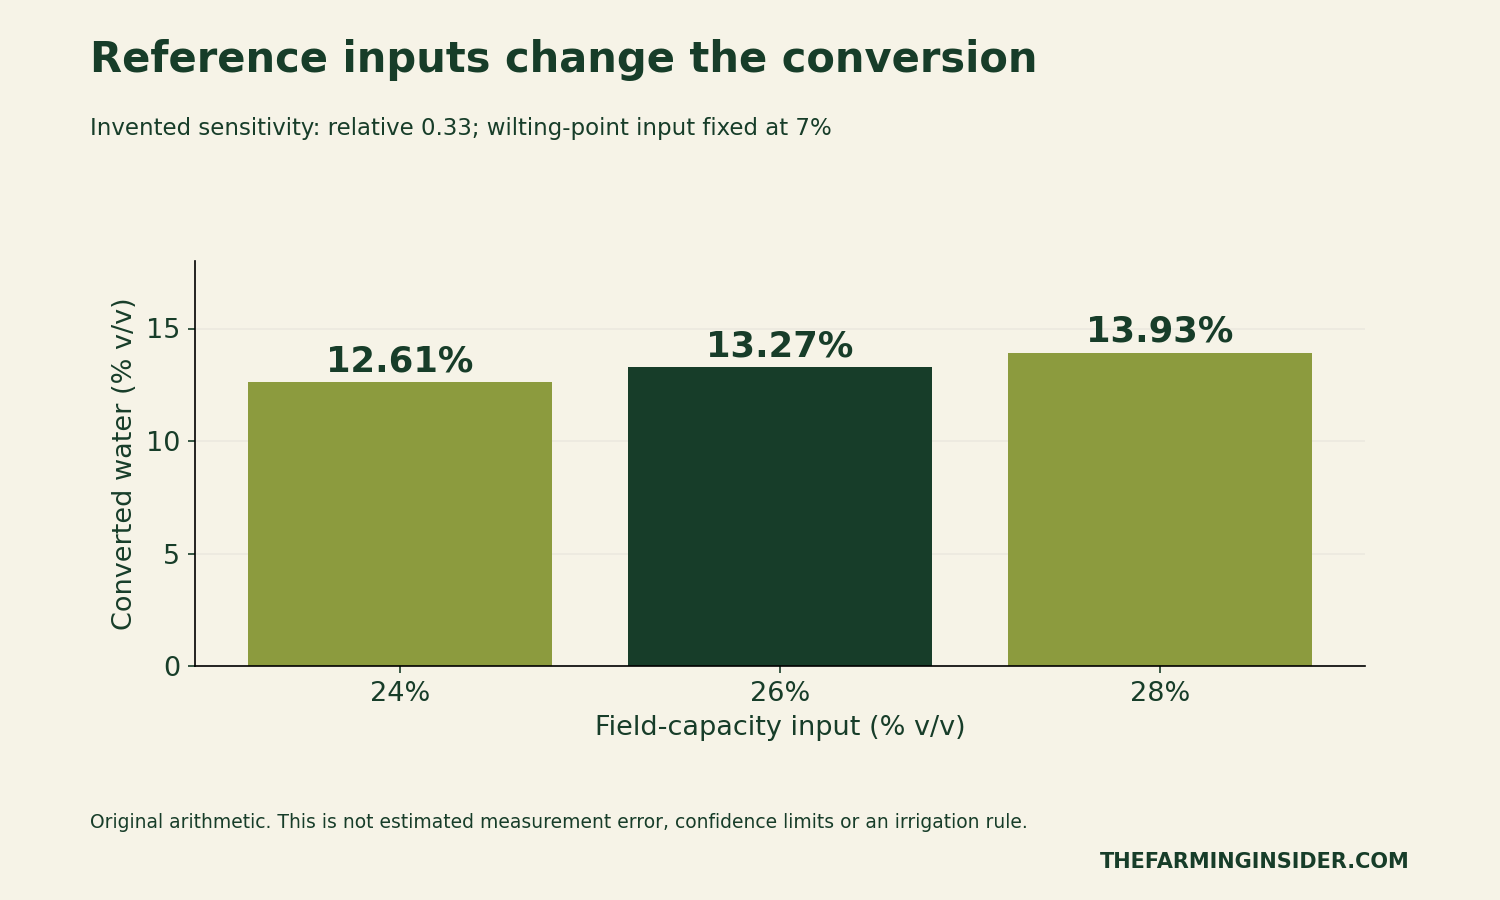
Input uncertainty also carries through the arithmetic. For example, holding a hypothetical wilting-point input at 7% and the relative value at 0.33, field-capacity inputs of 24%, 26% and 28% give 12.61%, 13.27% and 13.93% v/v. This is a sensitivity calculation, not an uncertainty interval from the paper.
A recordkeeping sequence for vineyard measurements
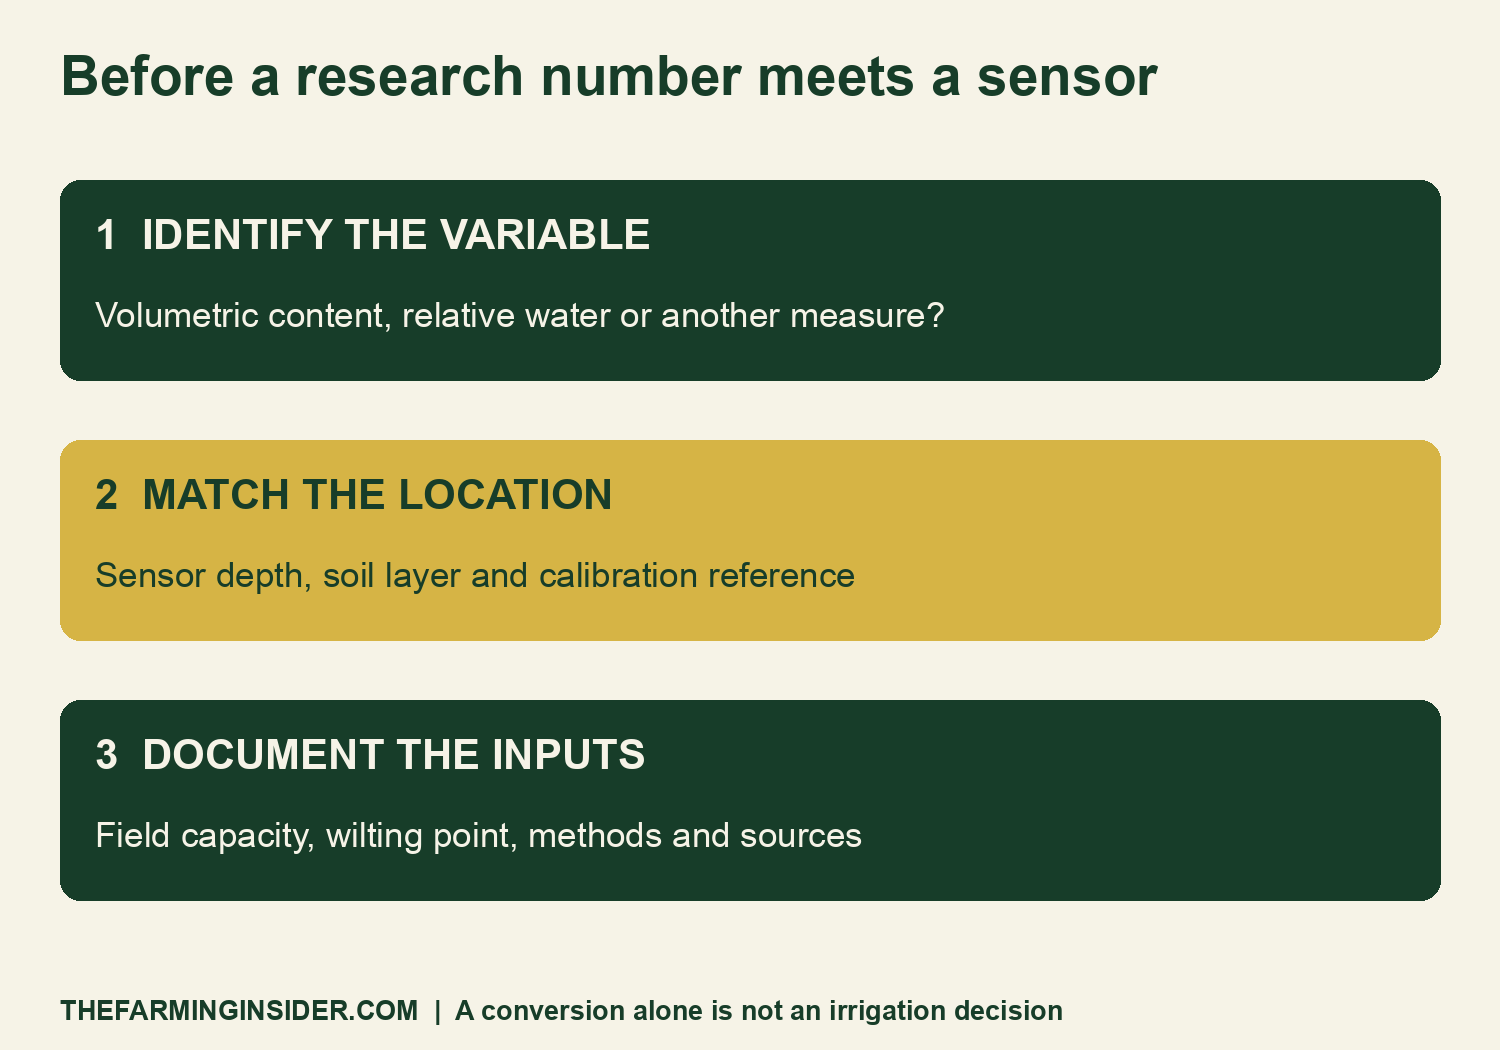
First, identify whether the device reports volumetric content, a relative measure or another variable. Next, record the sensor depth, soil layer, calibration reference and date. Finally, identify the origin and method of the field-capacity and wilting-point inputs used in any conversion.
Keep separate rows for distinct depths or soil layers. Also retain the unrounded reading and the original display units. This makes it possible to correct an interpretation without losing the measurement that produced it.
Download the four original CSV tools
- Worked unit-conversion examples (CSV) contains the published-input arithmetic and clearly labelled hypothetical comparisons.
- Original relative-to-volumetric mapping (CSV) supplies the calculated points in Figure 1, without reproducing the paper's figures or tables.
- Blank sensor and soil-input ledger (CSV) records variable, units, depth, calibration and reference sources.
- Illustrative input-sensitivity calculations (CSV) shows how changing a reference input changes the output.
The files contain plain data, without macros or embedded formulas. For a local calculation, keep all volumetric inputs as percentages or all as fractions. Check that field capacity exceeds the wilting-point input before dividing. Leave unknown inputs blank and seek an appropriate source rather than filling them with this vineyard's values.
Our deep-liming evidence guide offers a related example of preserving moisture definitions. For a different farm calculation, see how our wheat premium analysis keeps the headline amount separate from the relevant decision measure.
Grapevine drought stress soil moisture: methods and limits
We checked the university report and original paper on 6 November 2026. The charts are our own arithmetic explanations, not digitised experimental curves, replicated study figures or a fresh statistical analysis. The paper's specific site, own-rooted plants and observation years limit direct transfer to other vineyards.
A mathematical conversion cannot establish a suitable irrigation schedule, water volume or cultivar choice. It also does not account for canopy demand, weather, rooting conditions or the intended production outcome. Discuss those questions with a locally qualified viticulture or irrigation adviser using site-specific evidence.
Suggested citation: The Farming Insider (6 November 2026), “Grapevine Drought Stress: Check Soil Moisture Units”, original conversion charts and CSV tools. Cite Obiero and Keller's linked paper separately for experimental findings and reference inputs. The original article carries an Attribution-NonCommercial-NoDerivatives licence; we link to it and do not redistribute its figures, tables or supplementary files.