



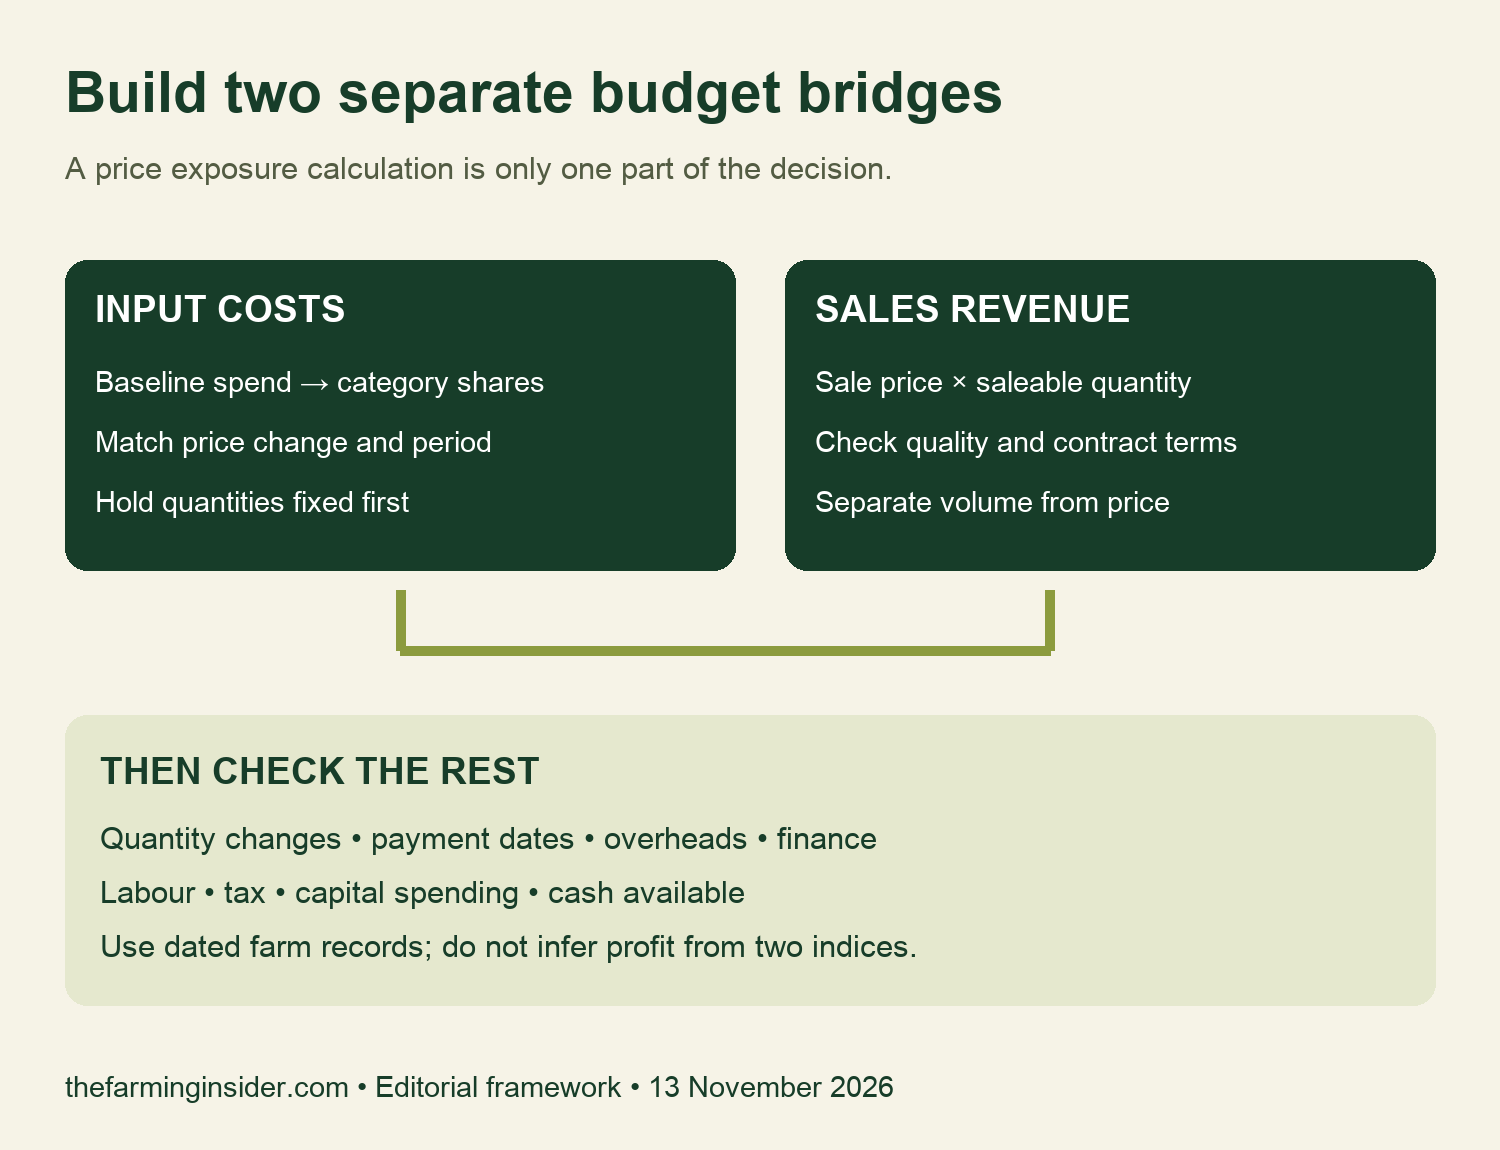
UK farm input costs and output prices can move in opposite directions. Yet the gap between two national indices is not your farm’s profit change. Start with your own spending mix, match each category to an appropriate price measure, and test sales quantities separately.
This guide uses Defra’s latest published release, updated on 11 November 2026, covering August 2026. Five original charts distinguish official measures from a fictional budget example. A comparison infographic and four free CSV files make the method reusable. Research checked on 13 November 2026.
UK farm input costs: what the latest release measures
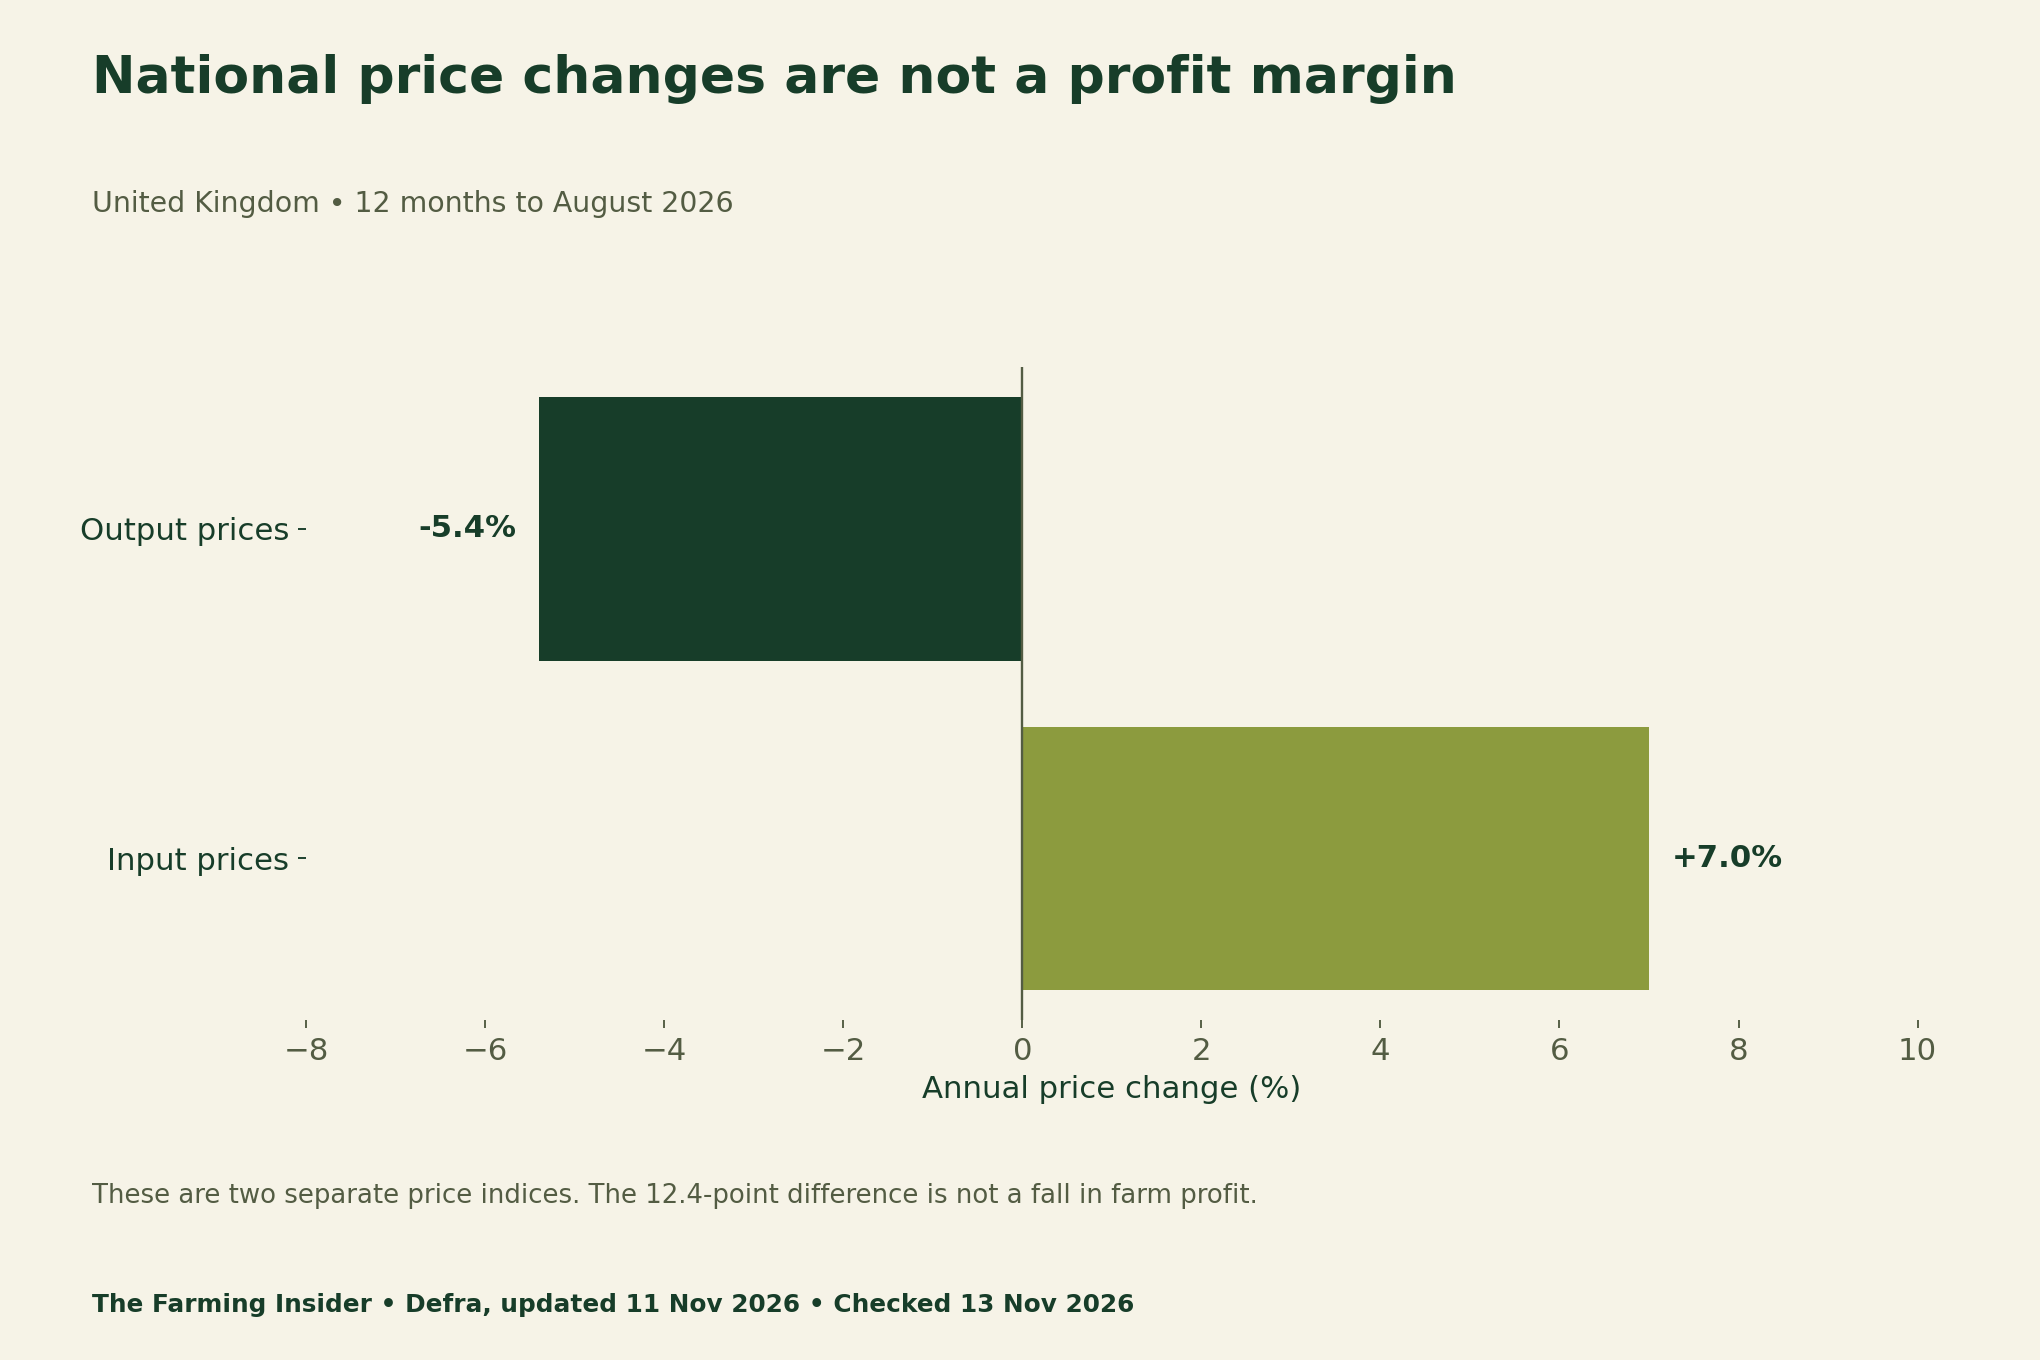
The Defra Agricultural Price Indices release reports a 7.0% annual increase in input prices and a 5.4% decrease in output prices. Inputs describe purchased goods and services; outputs describe farm-gate prices received. Their difference is 12.4 percentage points, not a percentage fall in profit.
Match the price measure to the actual expense
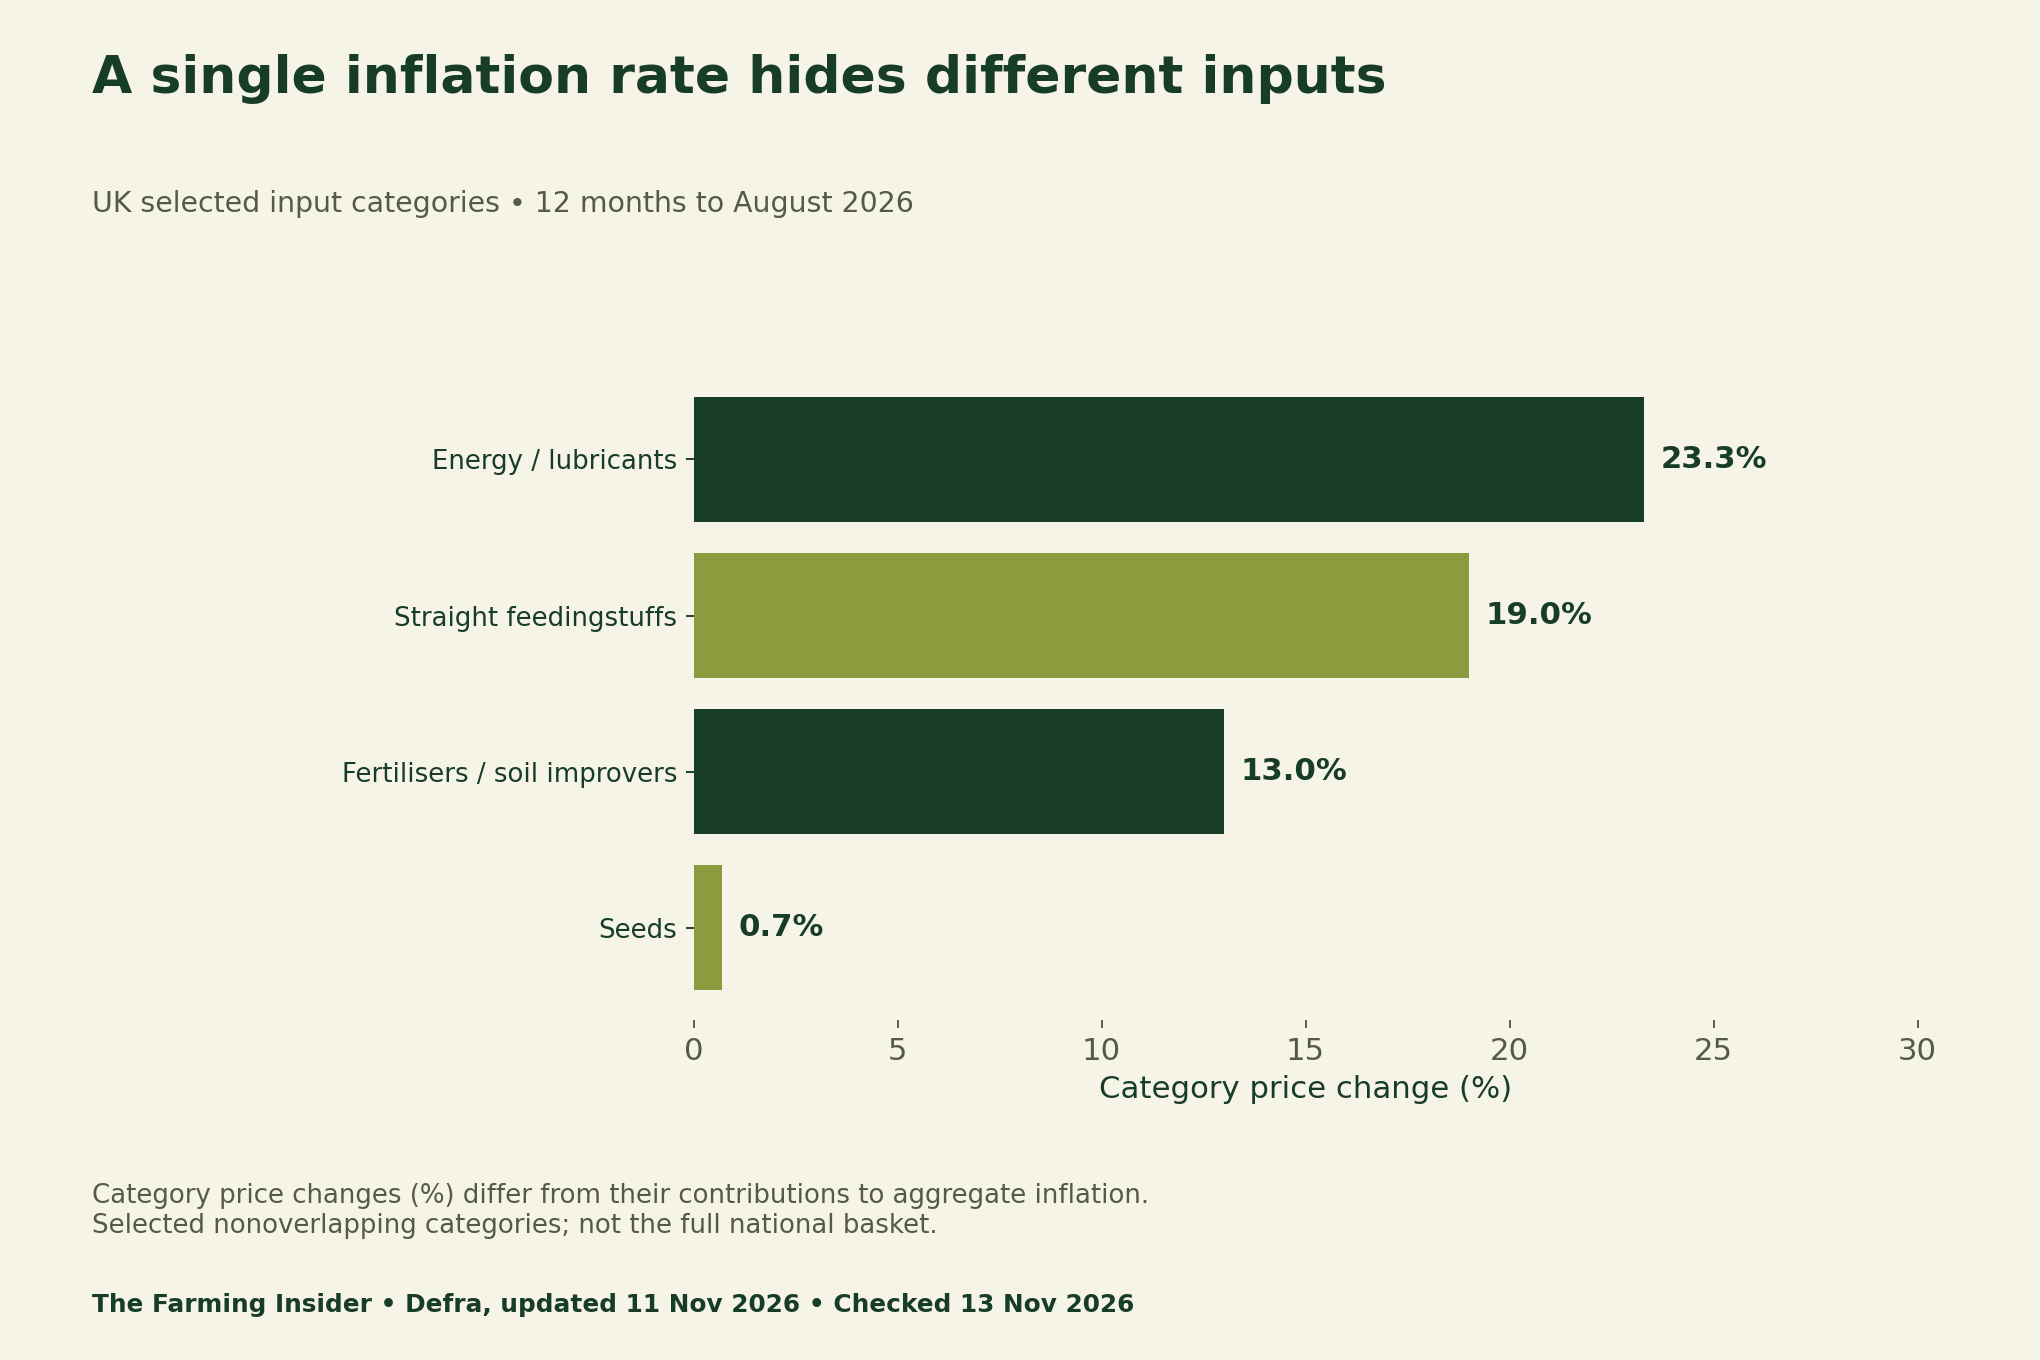
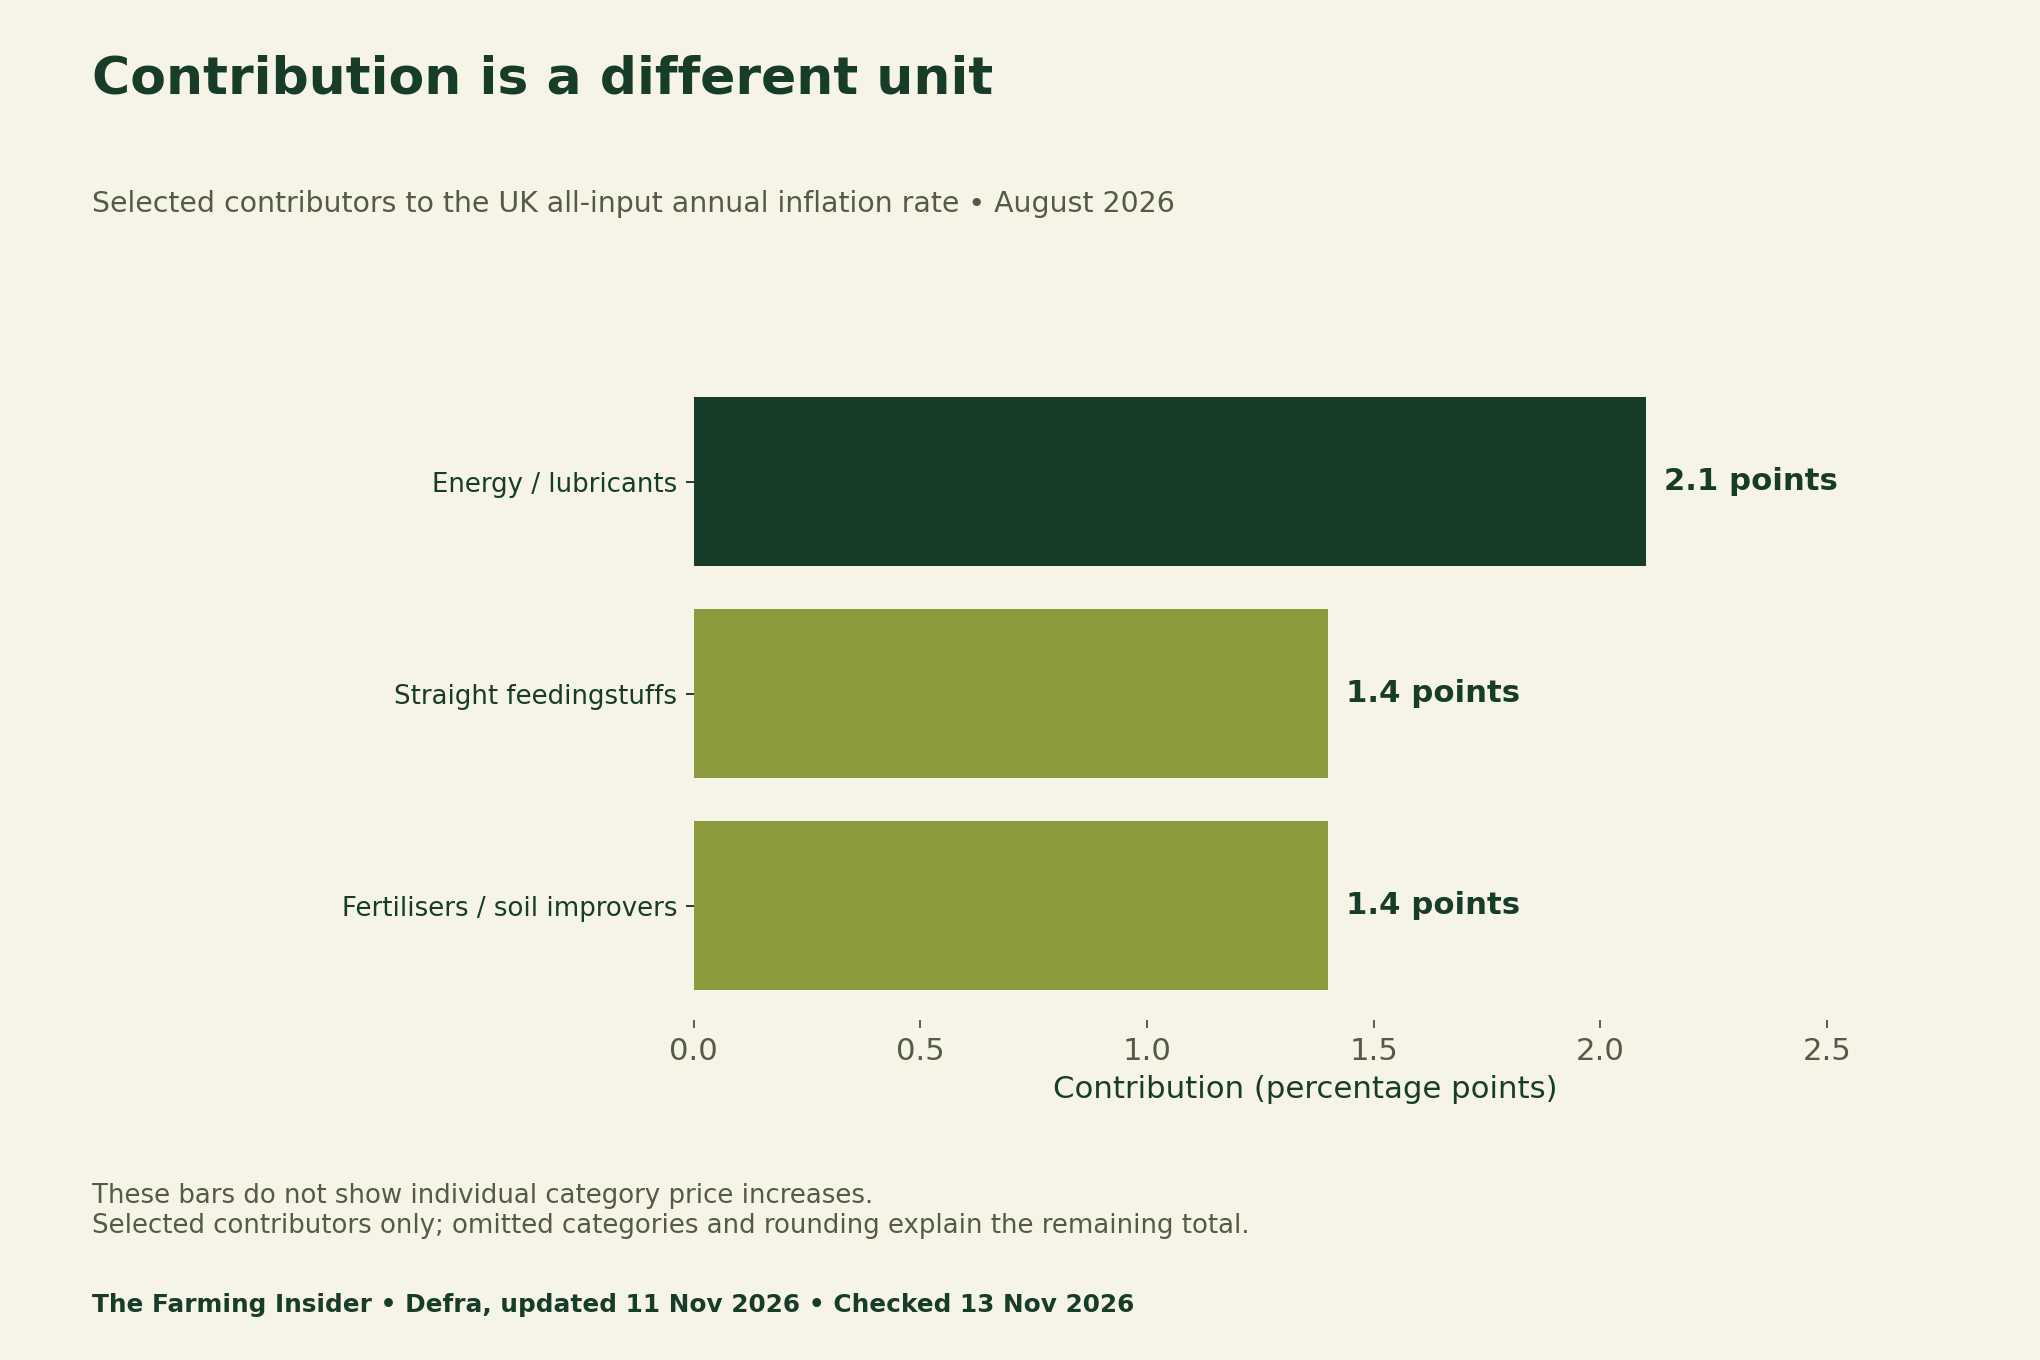
A cost category’s own price change differs from its contribution to the overall index. For example, energy and lubricants rose 23.3%, while their contribution to all-input inflation was 2.1 percentage points. The first describes the category; the second reflects its effect within the national weighting system.
Therefore, do not apply the national 7% to every invoice. Start with an expense register. Record the product, quantity, unit, supplier price and date. Note whether the price includes delivery or tax. A contract already fixing next season’s cost may need different treatment from an unpriced purchase.
Build an enterprise-specific exposure bridge
First, define the basket you are analysing. Use nonoverlapping categories and one baseline period. Next, divide each category’s baseline cost by total baseline costs in that basket. Those shares must sum to one. Finally, multiply each share by the matching price change and add the results.
Price-only exposure (%) = Σ [baseline expenditure share × matched price change (%)]
Hold quantities constant in this first calculation. This isolates a price effect. If you also change feed use, cropped area or application rates, record those physical changes in a separate scenario. Otherwise the result mixes decisions with market price movements.
A fictional example of UK farm input costs
Consider a fictional £80,000 four-category basket. It assigns 20% to energy, 30% to straight feed, 30% to fertiliser and 20% to seeds. These are invented weights, not a representative British enterprise. Matching the published category changes produces 14.40% price-only exposure.
| Category | Fictional share | Matched price change | Basket contribution |
|---|---|---|---|
| Energy | 20% | 23.3% | 4.66 points |
| Straight feed | 30% | 19.0% | 5.70 points |
| Fertiliser | 30% | 13.0% | 3.90 points |
| Seeds | 20% | 0.7% | 0.14 points |
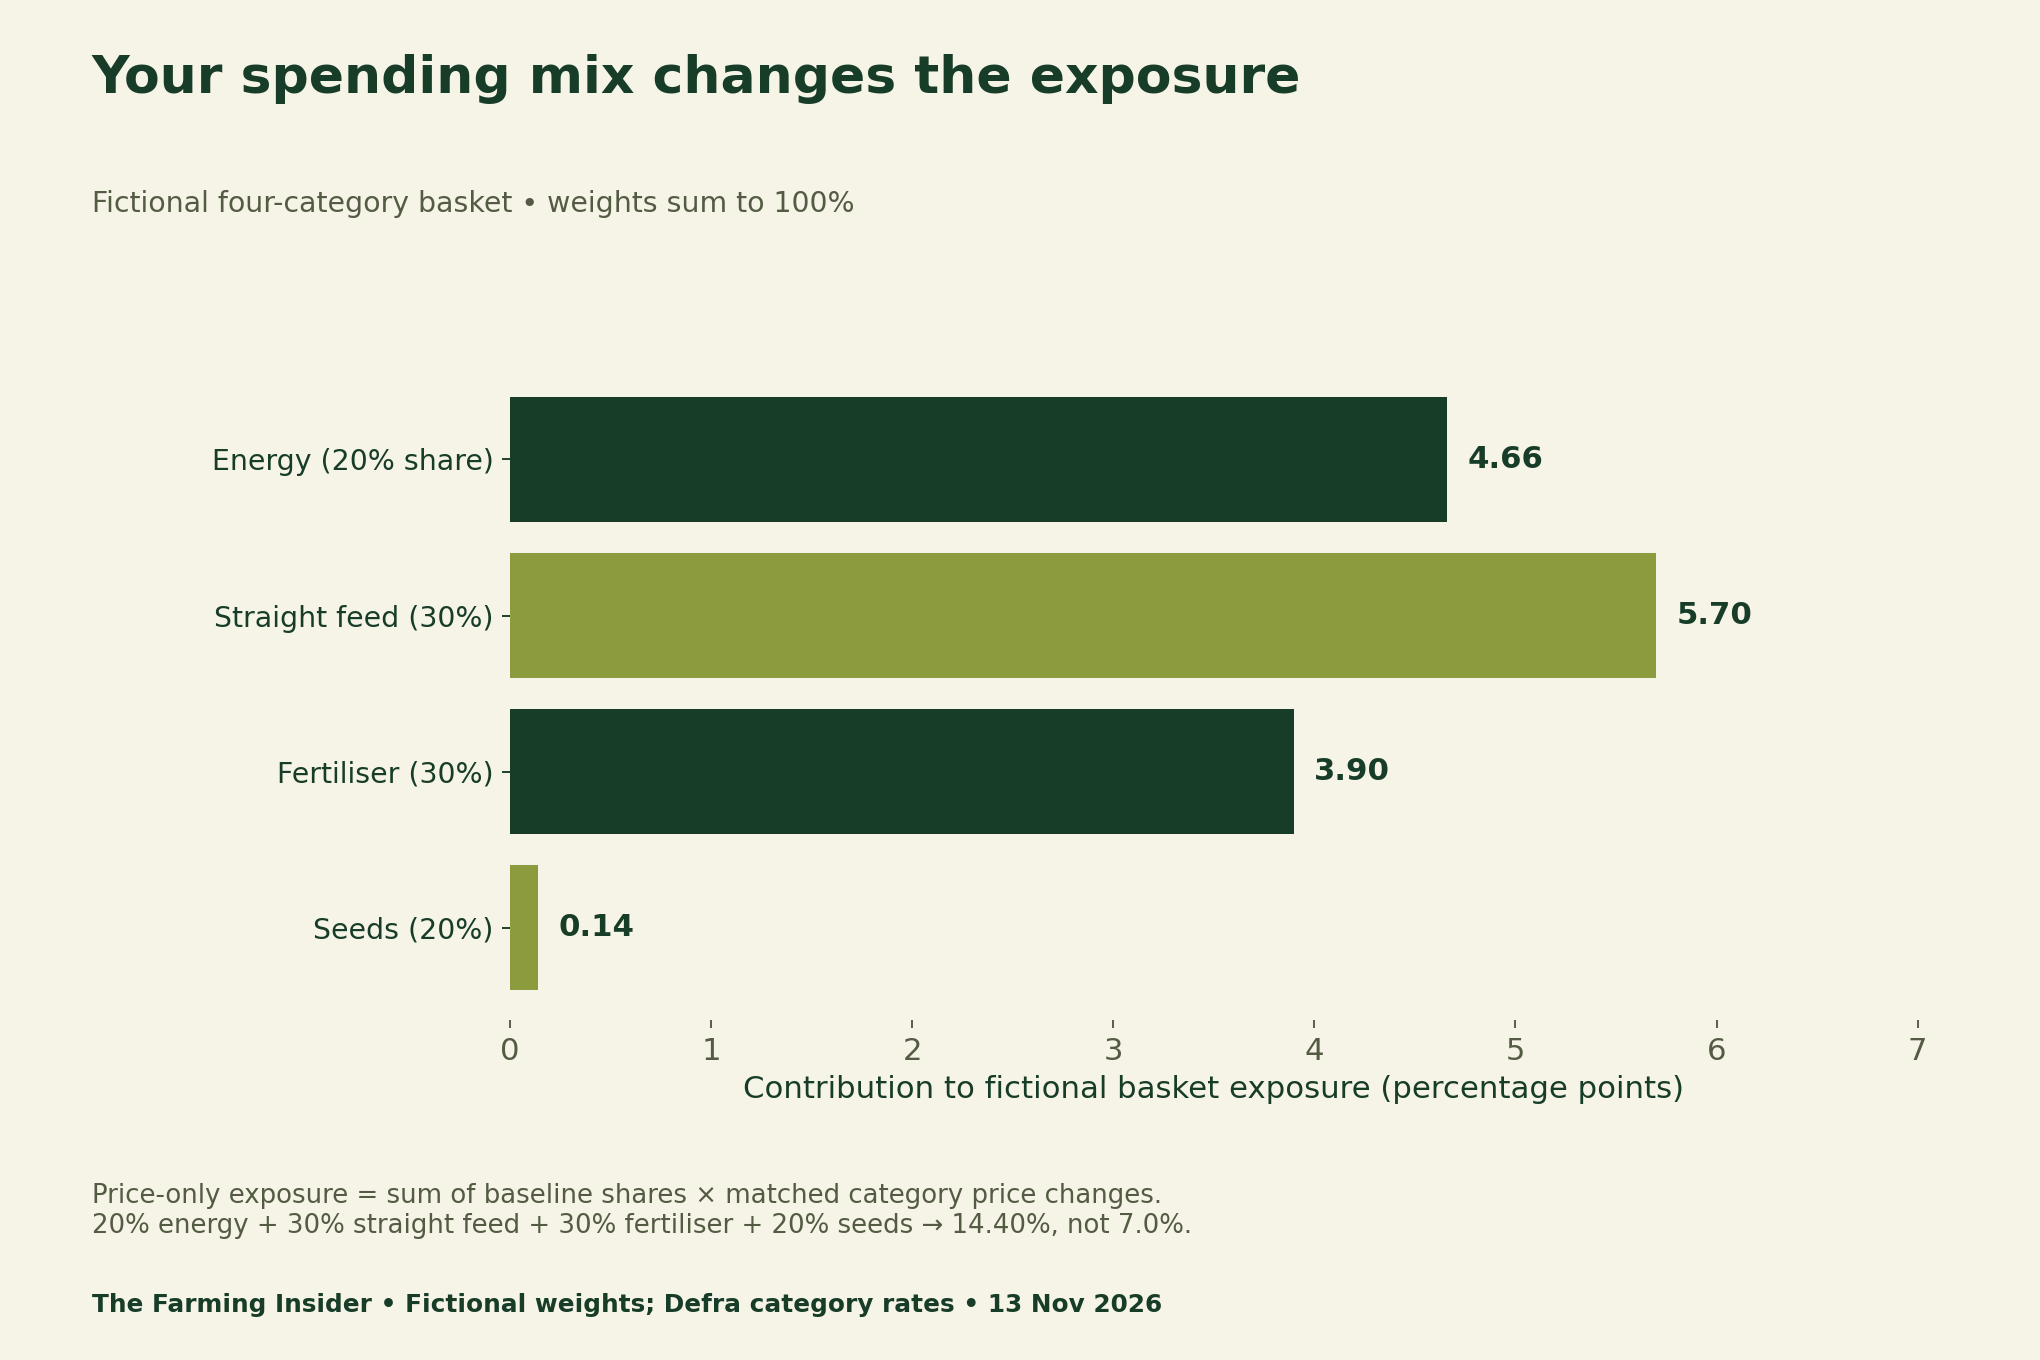
At fixed quantities, this basket rises from £80,000 to £91,520: an £11,520 increase. The calculation excludes all unlisted expenses. It also assumes the category changes match the farm’s purchase specification and timing. Your actual paid prices may be better evidence than a national proxy.
Test sale price and saleable output independently
Now give the fictional business £100,000 baseline revenue. A 10% price decrease and a 10% quantity decrease produce £81,000 revenue, because 0.9 × 0.9 equals 0.81. Adding the two percentage changes would miss that interaction. Keep product quality and rejected output in view as well.
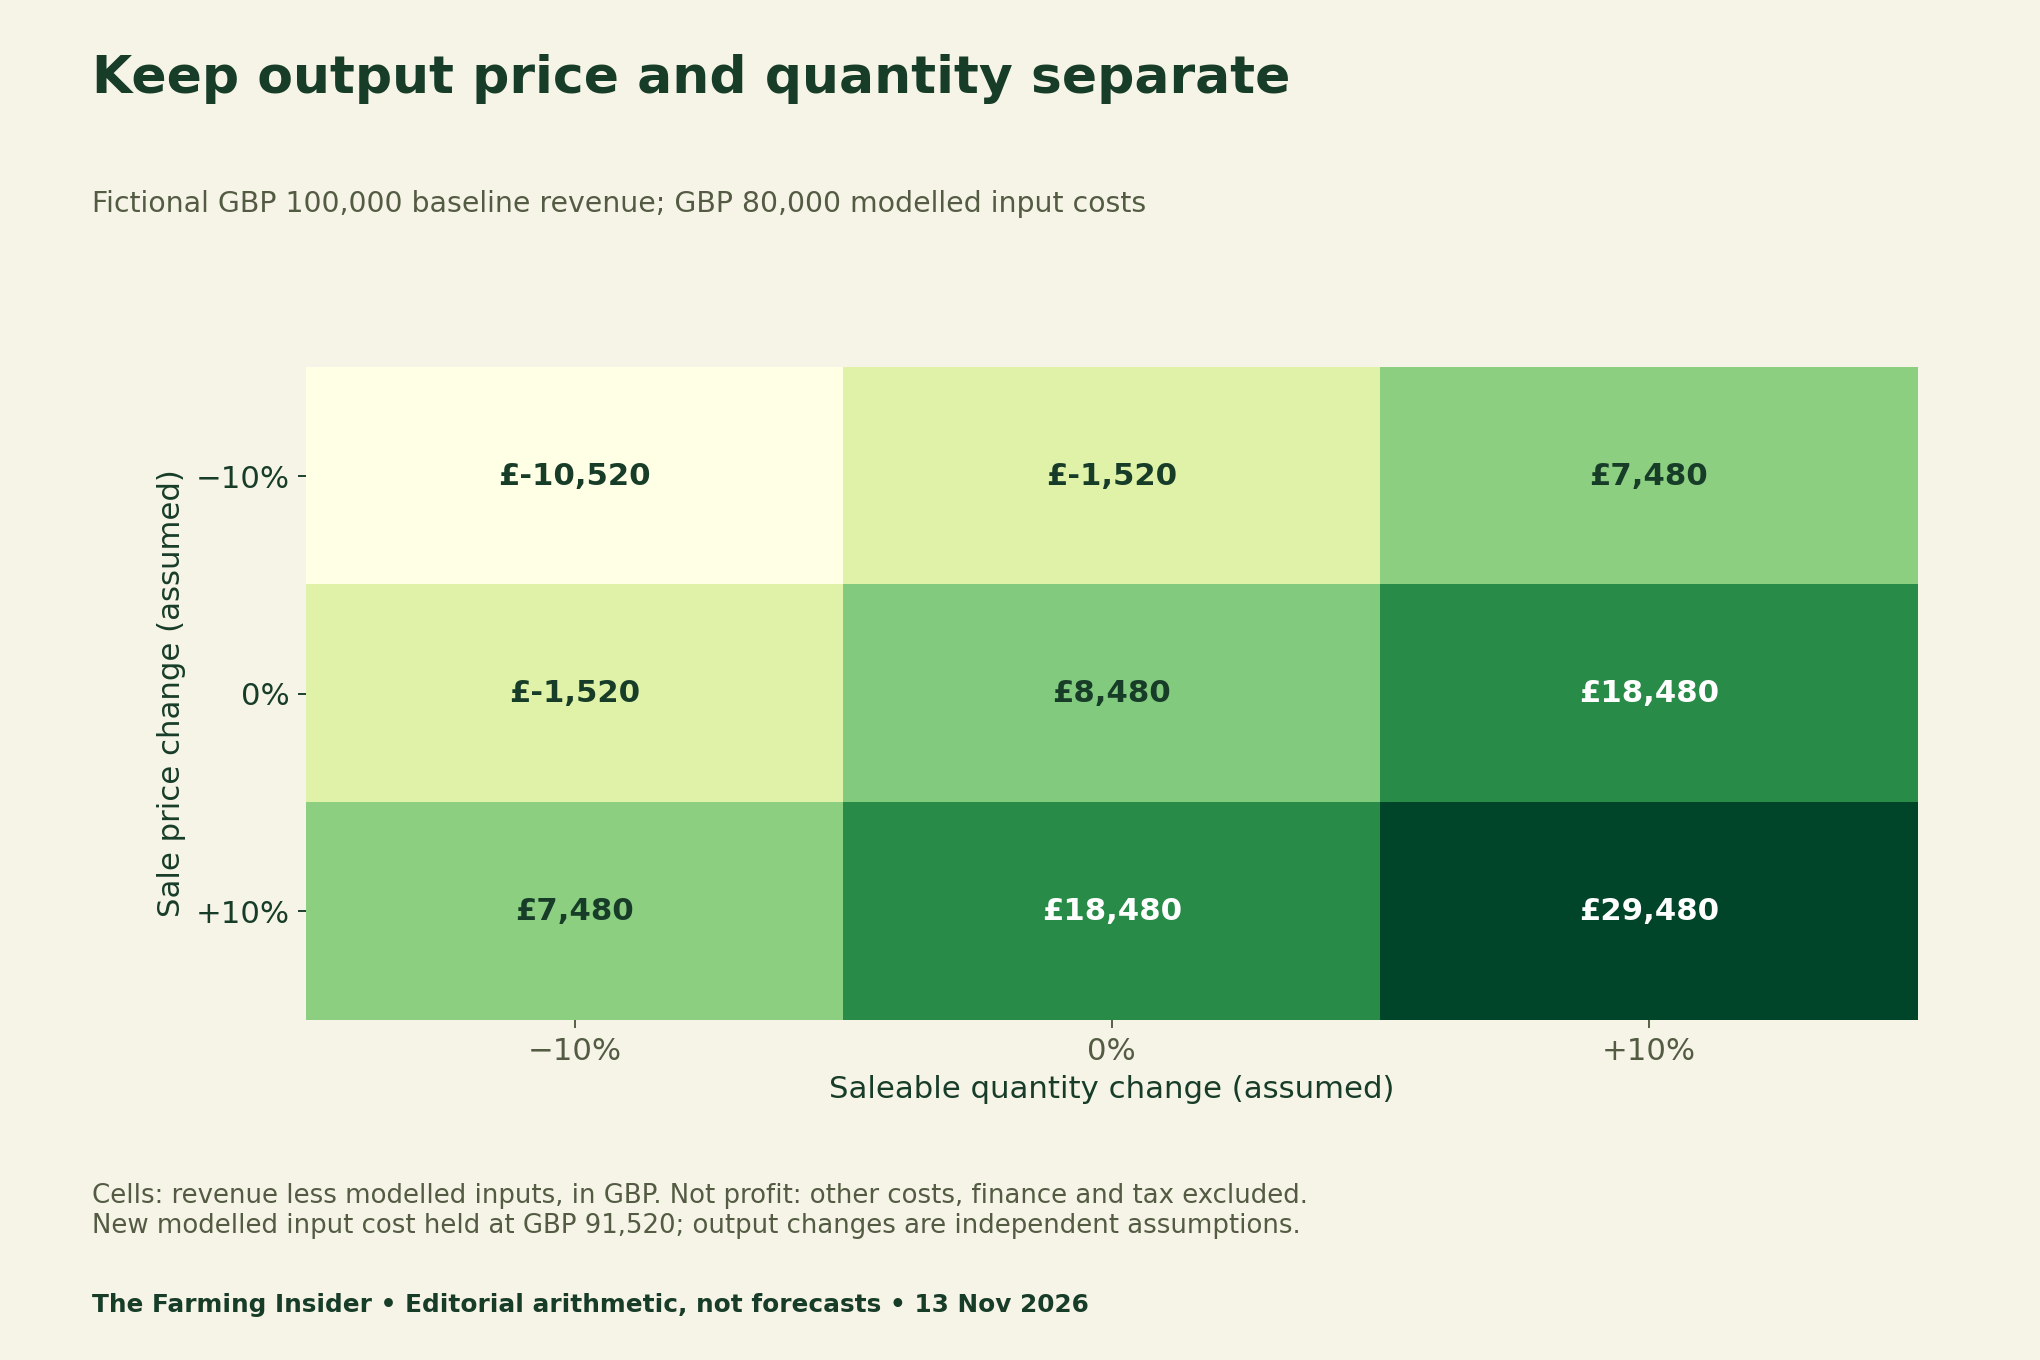
The matrix is a discussion aid. It neither predicts a local sale price nor identifies an optimal purchase. For a related distinction, our UK milling-wheat premium guide separates a quoted premium from the net result after specification and transaction costs.
Use the four files privately
Begin with the blank worksheet and replace every placeholder with dated records. Leave unknown values blank rather than entering zero. Keep source references beside assumptions. Review the example arithmetic before adapting it, and retain the fictional labels whenever you share an example.
- Selected official price measures and definitions (CSV)
- Fictional cost-share example and calculations (CSV)
- Blank farm price-exposure worksheet (CSV)
- Fictional revenue and cost sensitivity matrix (CSV)
Methods, limitations and refresh checklist
We transcribed selected published figures and calculated the weighted example from stated inputs. No farm accounts were surveyed. The official release collection records revisions, including a November update to plant-protection weights. The release also contains small narrative differences about contributor counts; this guide uses the explicit numerical tables rather than those counts.
National indices do not measure your productivity, profit or cash available. They can be revised and may not match a particular contract. Before refreshing this tool, check the release date, observation period, definitions, units and any revisions. Avoid combining an aggregate feed category with its straight-feed component in the same cost basket.
Transform Your Agribusiness
Unlock your farm's potential with expert advice tailored to your needs. Get actionable steps that drive real results.
Get StartedFor a complete budget, add overheads, labour, borrowing costs, tax, capital spending and receipt dates as applicable. Seek suitable accounting or agricultural advice for decisions specific to your enterprise. This worksheet is educational arithmetic, not a forecast or a lending assessment.
Suggested citation: The Farming Insider (13 November 2026), “UK Farm Input Costs vs Output Prices: Test Your Budget”, analysis of Defra’s August 2026 Agricultural Price Indices and original illustrative worksheets. Preserve the source period, units and scenario labels when reusing a figure.