






Egg price benchmarks for producers are useful only when the product and transaction match. In USDA’s 6 November 2026 overview, national loose white Large eggs were $0.46 per dozen, Midwest cartoned producer eggs were $0.52, and the conventional caged retail advertised average was $1.30. Those figures describe different channels, not a single batch changing hands.
Featured image: AI-generated conceptual egg-market still life. The objects do not represent a matched batch of eggs or observed transactions.
This report separates the definitions, reconstructs prior values from the stated weekly changes and supplies three original charts, a matching decision tree and four free CSV tools. It does not measure retailer profit, recommend a selling price or predict the next market move. Research checked on 9 November 2026.
Define egg price benchmarks for producers before comparing
The primary source is the USDA AMS Egg Markets Overview dated 6 November 2026. Its narrative gives simultaneous price references with different forms, locations and delivery stages. The report URL is a rolling PDF; we retained the dated edition used here. Check the document’s date before using a later download to reproduce these numbers.
| Benchmark | Current USD/dozen | Reported weekly change | What the quote covers |
|---|---|---|---|
| National loose wholesale | $0.46 | +0.11 | National; Graded loose white Large; caged; Truck-lot wholesale trading |
| Midwest cartoned producer | $0.52 | +0.16 | Midwest; Large cartoned shell eggs; Price to producers; colour/housing not separately restated in narrative |
| Conventional caged retail ad | $1.30 | -0.12 | National retail features; Conventional caged shell eggs; size/colour not separately restated in narrative; Advertised promotion, not realised all-retail average |
“Loose” and “cartoned” describe different presentation. “Price to producers,” “delivered to warehouses” and “delivered to retailers” describe different transactions. An advertised retail price describes a promotion, not the average price actually collected across every retail sale. A shared dollars-per-dozen unit does not remove these differences.
Read each egg price benchmark against its own prior quote
For national loose white Large eggs, the overview reports a rise of $0.11 to $0.46 per dozen. Subtracting that change gives a derived prior value of $0.35. For the Midwest cartoned producer quote, $0.52 minus $0.16 gives $0.36. For the retail advertised average, $1.30 minus a negative $0.12 gives $1.42.
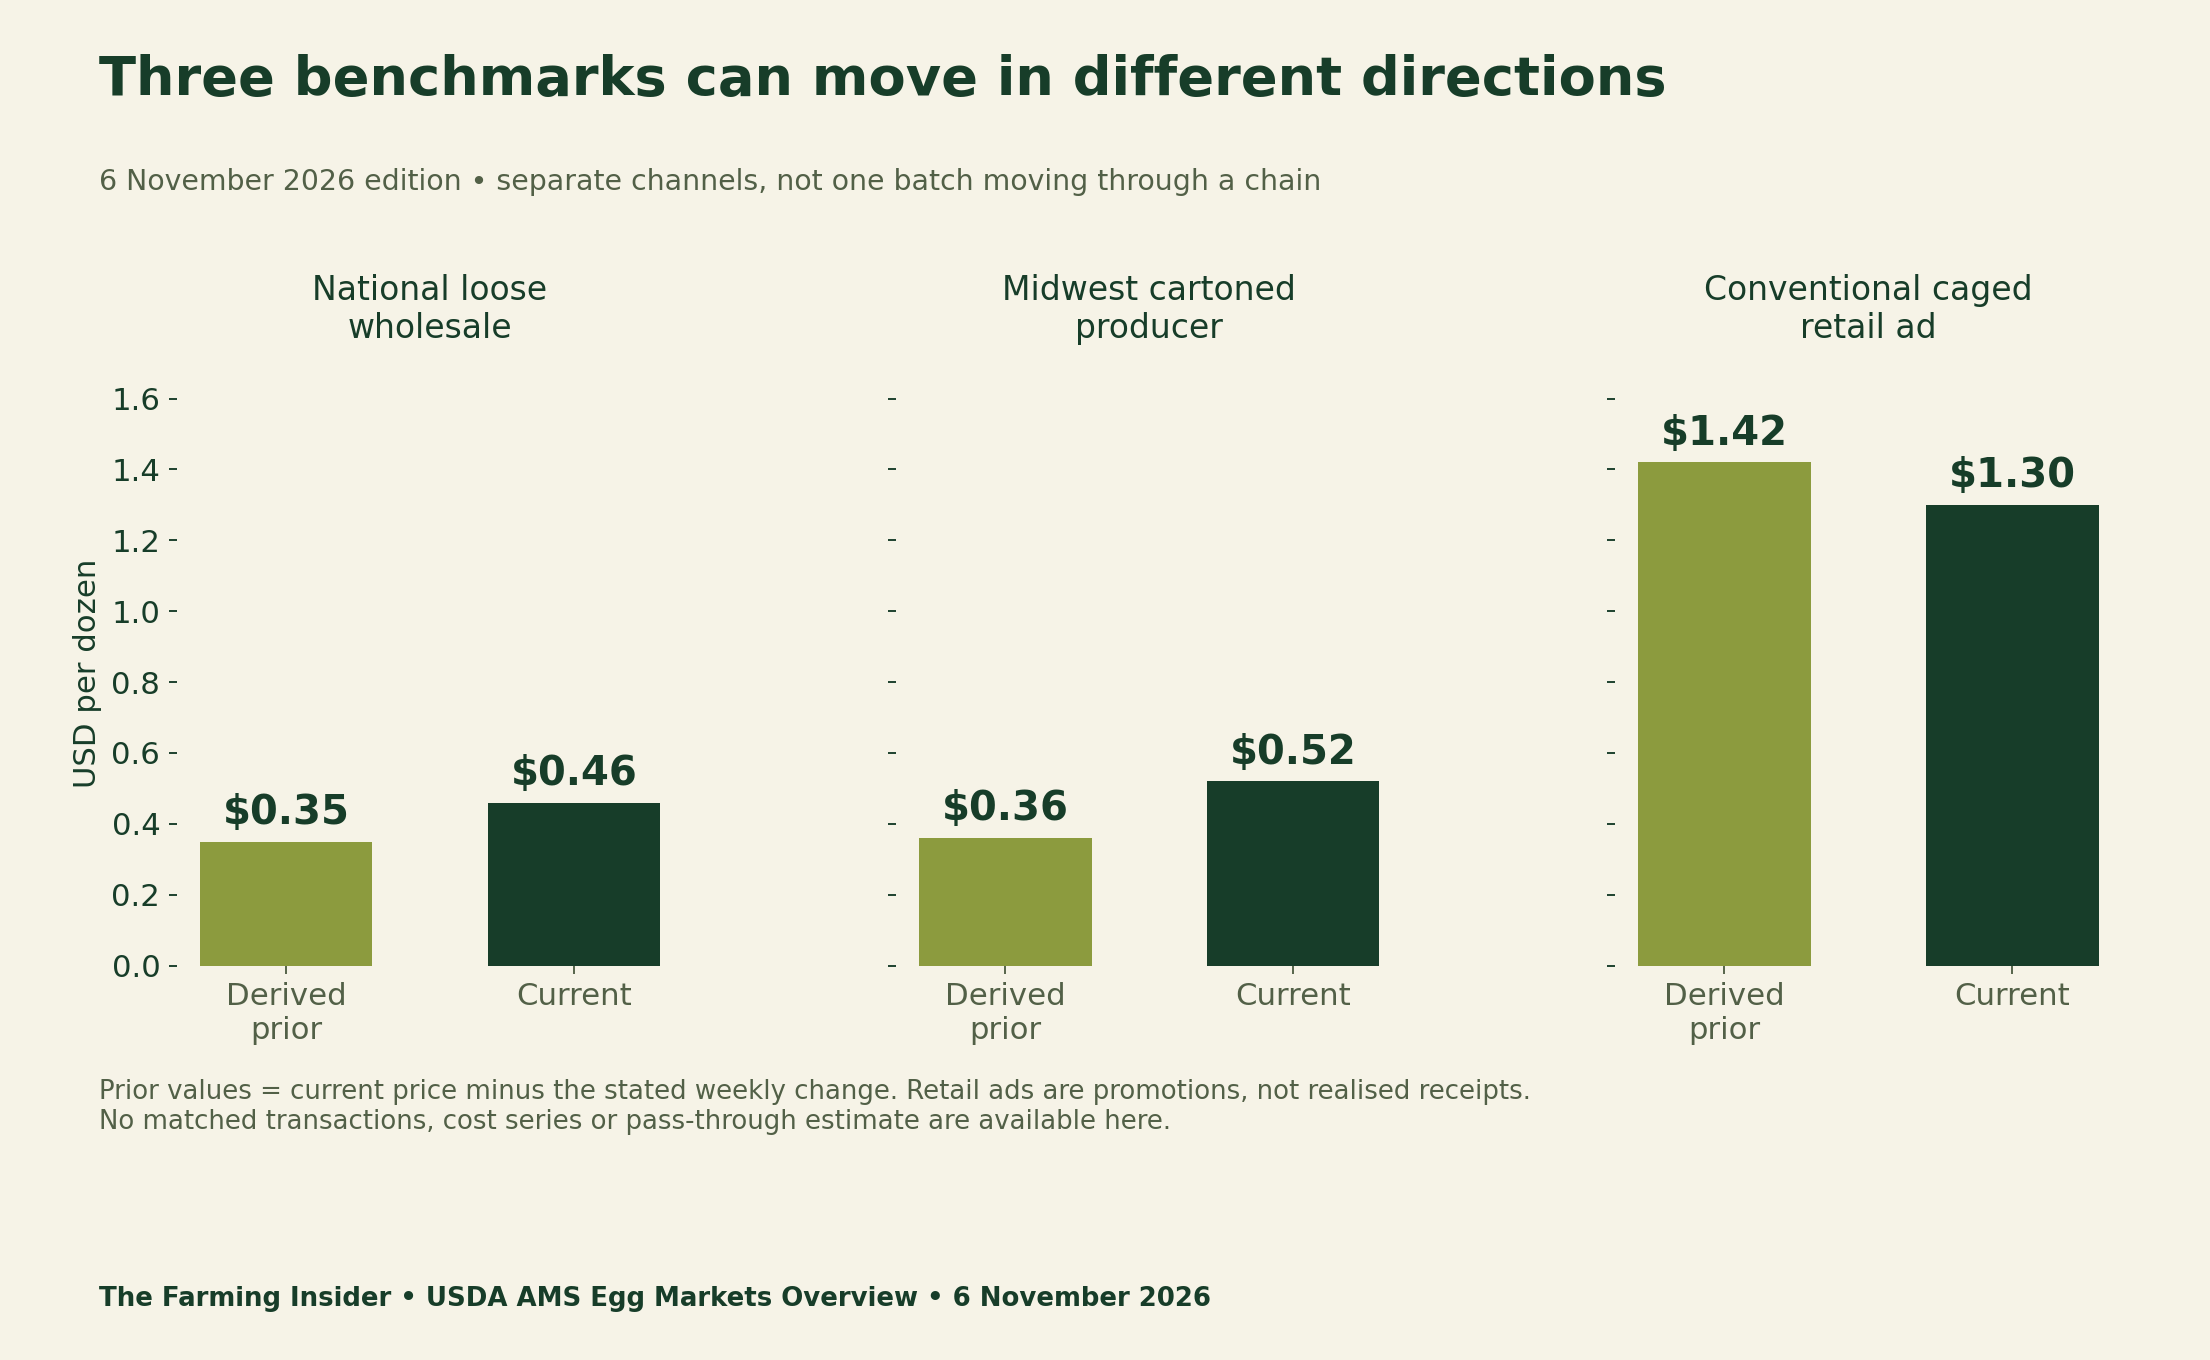
The corresponding derived percentage changes are +31.4%, +44.4% and −8.5%. Each uses its own prior price as the denominator. They must not be averaged or called relative bargaining power. A low starting price can produce a large percentage movement without a larger dollar change than another series.
Rising upstream references and falling advertised retail prices can coexist because their coverage differs. Promotions, contracts, delivery timing and product specifications can matter. This overview does not isolate the contribution of those explanations. Listing plausible differences is not the same as estimating a cause or measuring a lag.
Other egg price benchmarks preserve regional and delivery differences
The same narrative reports a New York formula wholesale price of $0.85 for Large cartoned eggs delivered to retailers, up $0.13. Midwest Large white eggs delivered to warehouses were $0.70, up $0.16. California’s Large benchmark was $1.33, up $0.23, while California-compliant delivered loose eggs were $0.89, up $0.29.
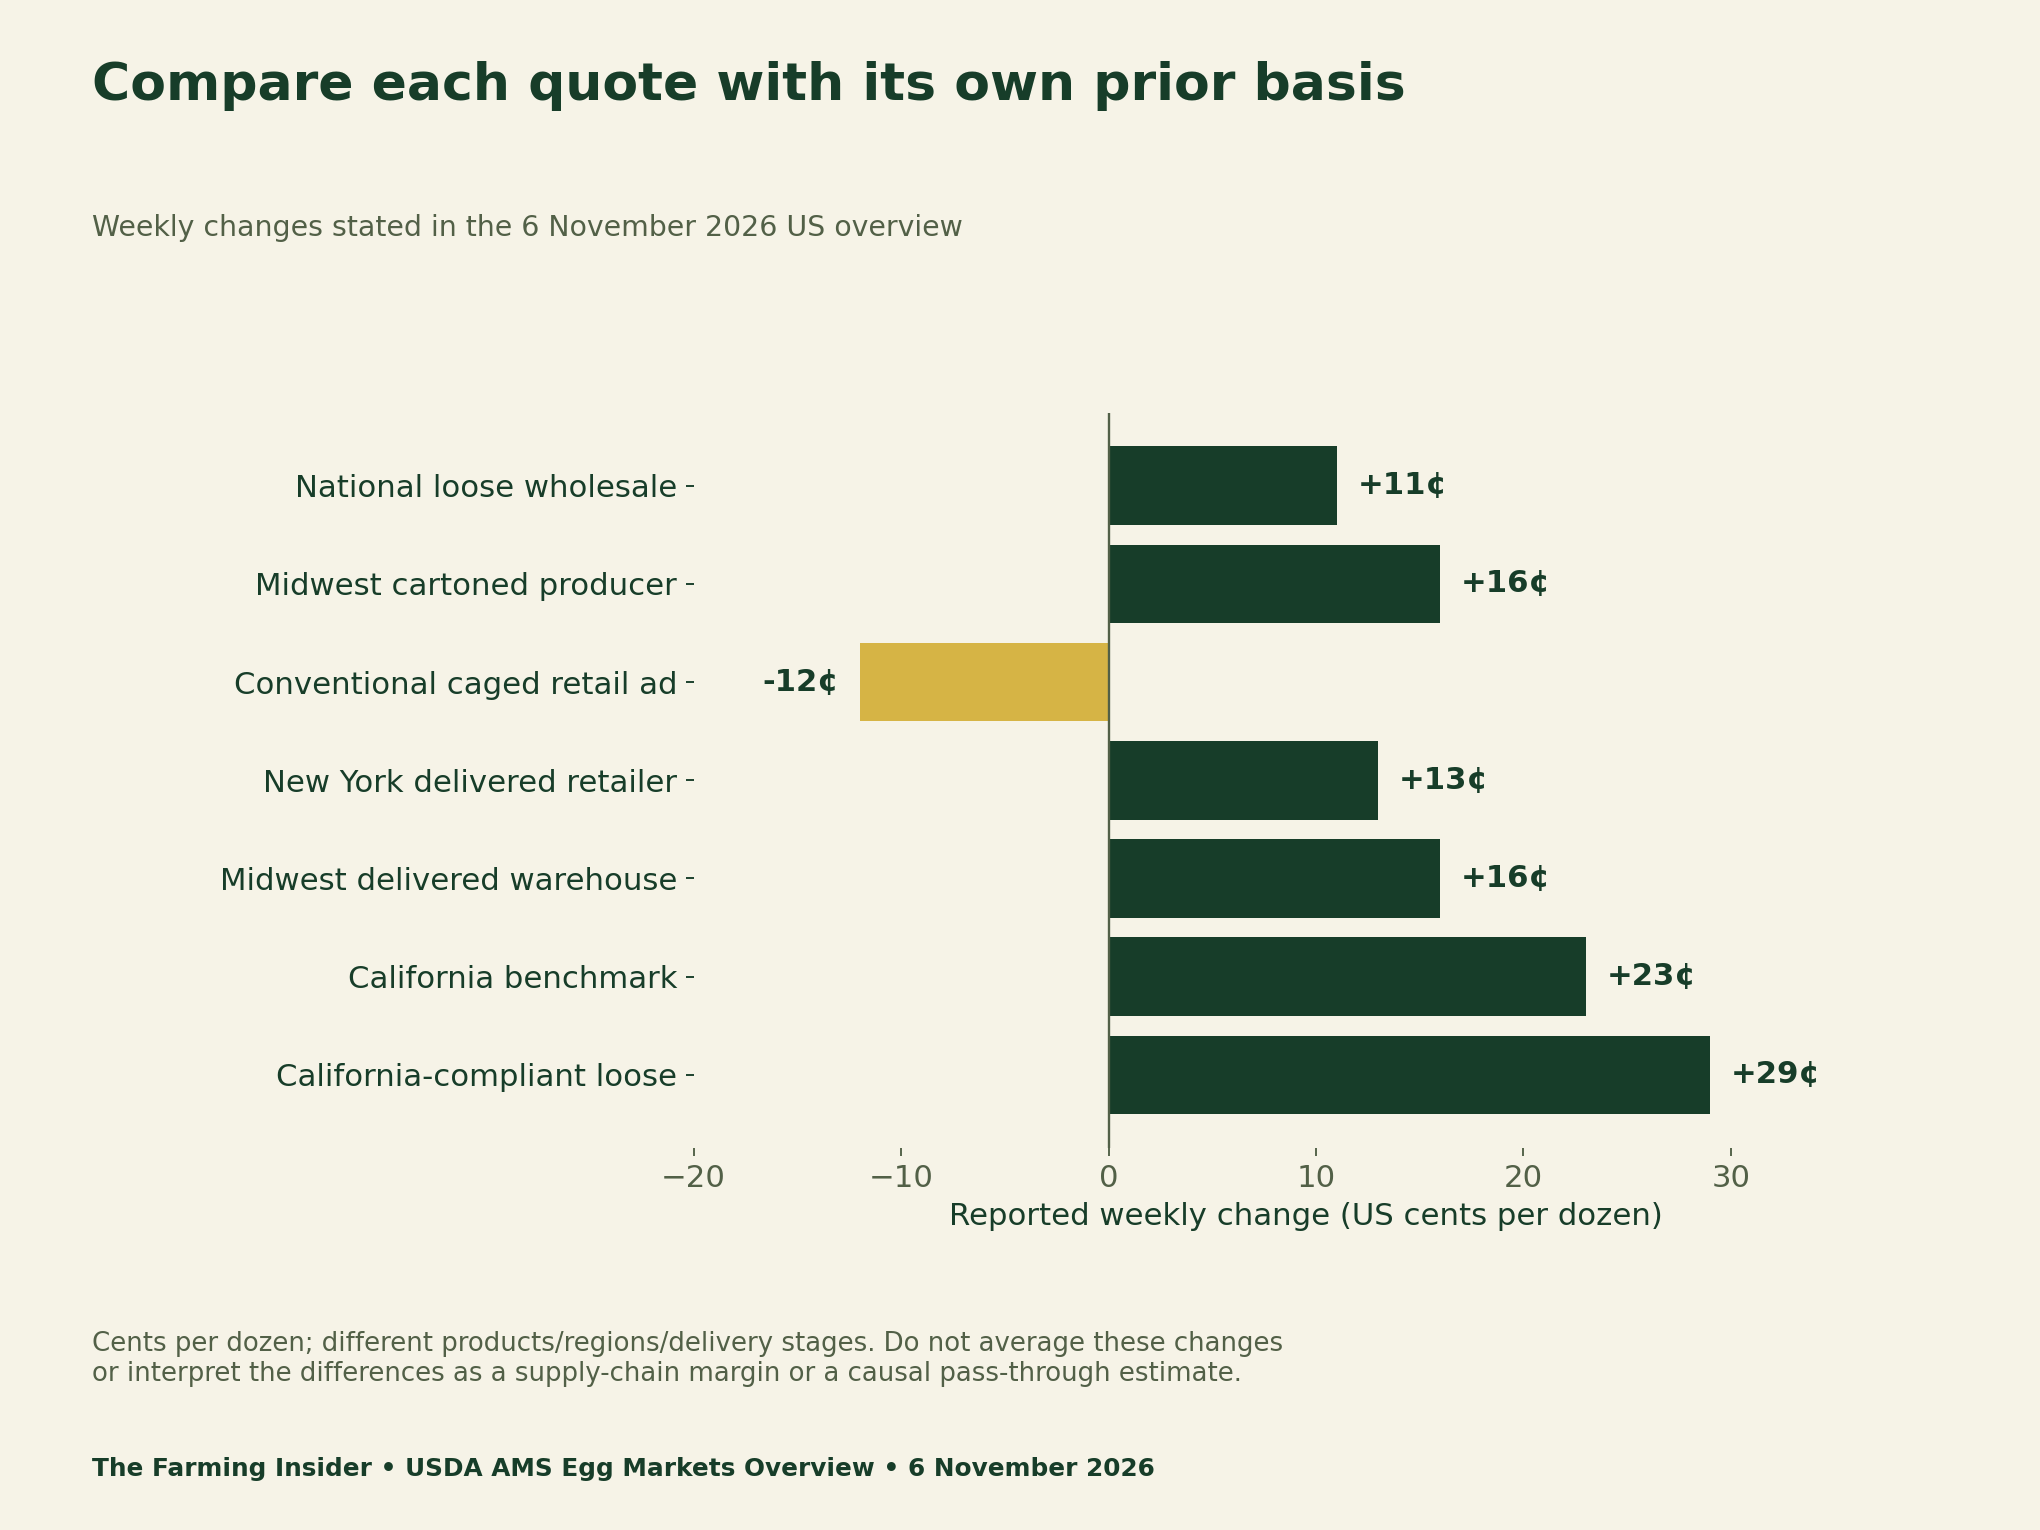
These extra references can help identify an unsuitable comparison. A buyer’s delivered-warehouse offer should not automatically be assessed against a producer-stage or California-compliant quote. Keep the source’s geography, product form and transaction wording beside every number. Do not transfer a premium between series without evidence that it applies to the actual offer.
The 84-cent difference is not measured retailer profit
Subtracting $0.46 from $1.30 produces $0.84 per dozen. The subtraction is arithmetically correct, but the interpretation can be wrong: it subtracts unlike benchmark observations. It does not identify the acquisition price, sale price or costs for one retailer’s eggs. We therefore label it a non-comparable-series difference, not a margin.
A defensible profit calculation would need matched transaction records and the relevant costs, quantities, timing and accounting basis. This report supplies none of those private inputs. Do not infer that the numerical difference is money available to a farmer, a retailer’s markup on the same batch or a measured pass-through response.
Inventory context cannot turn a benchmark into a forecast
At the week’s start, inventory available for marketing was reported up 4% overall and 6% for the national Large class. Midwest Large inventory was up 7%, and cage-free stocks were up 3%. These groups overlap. Adding their percentage changes would not describe a valid total inventory change.
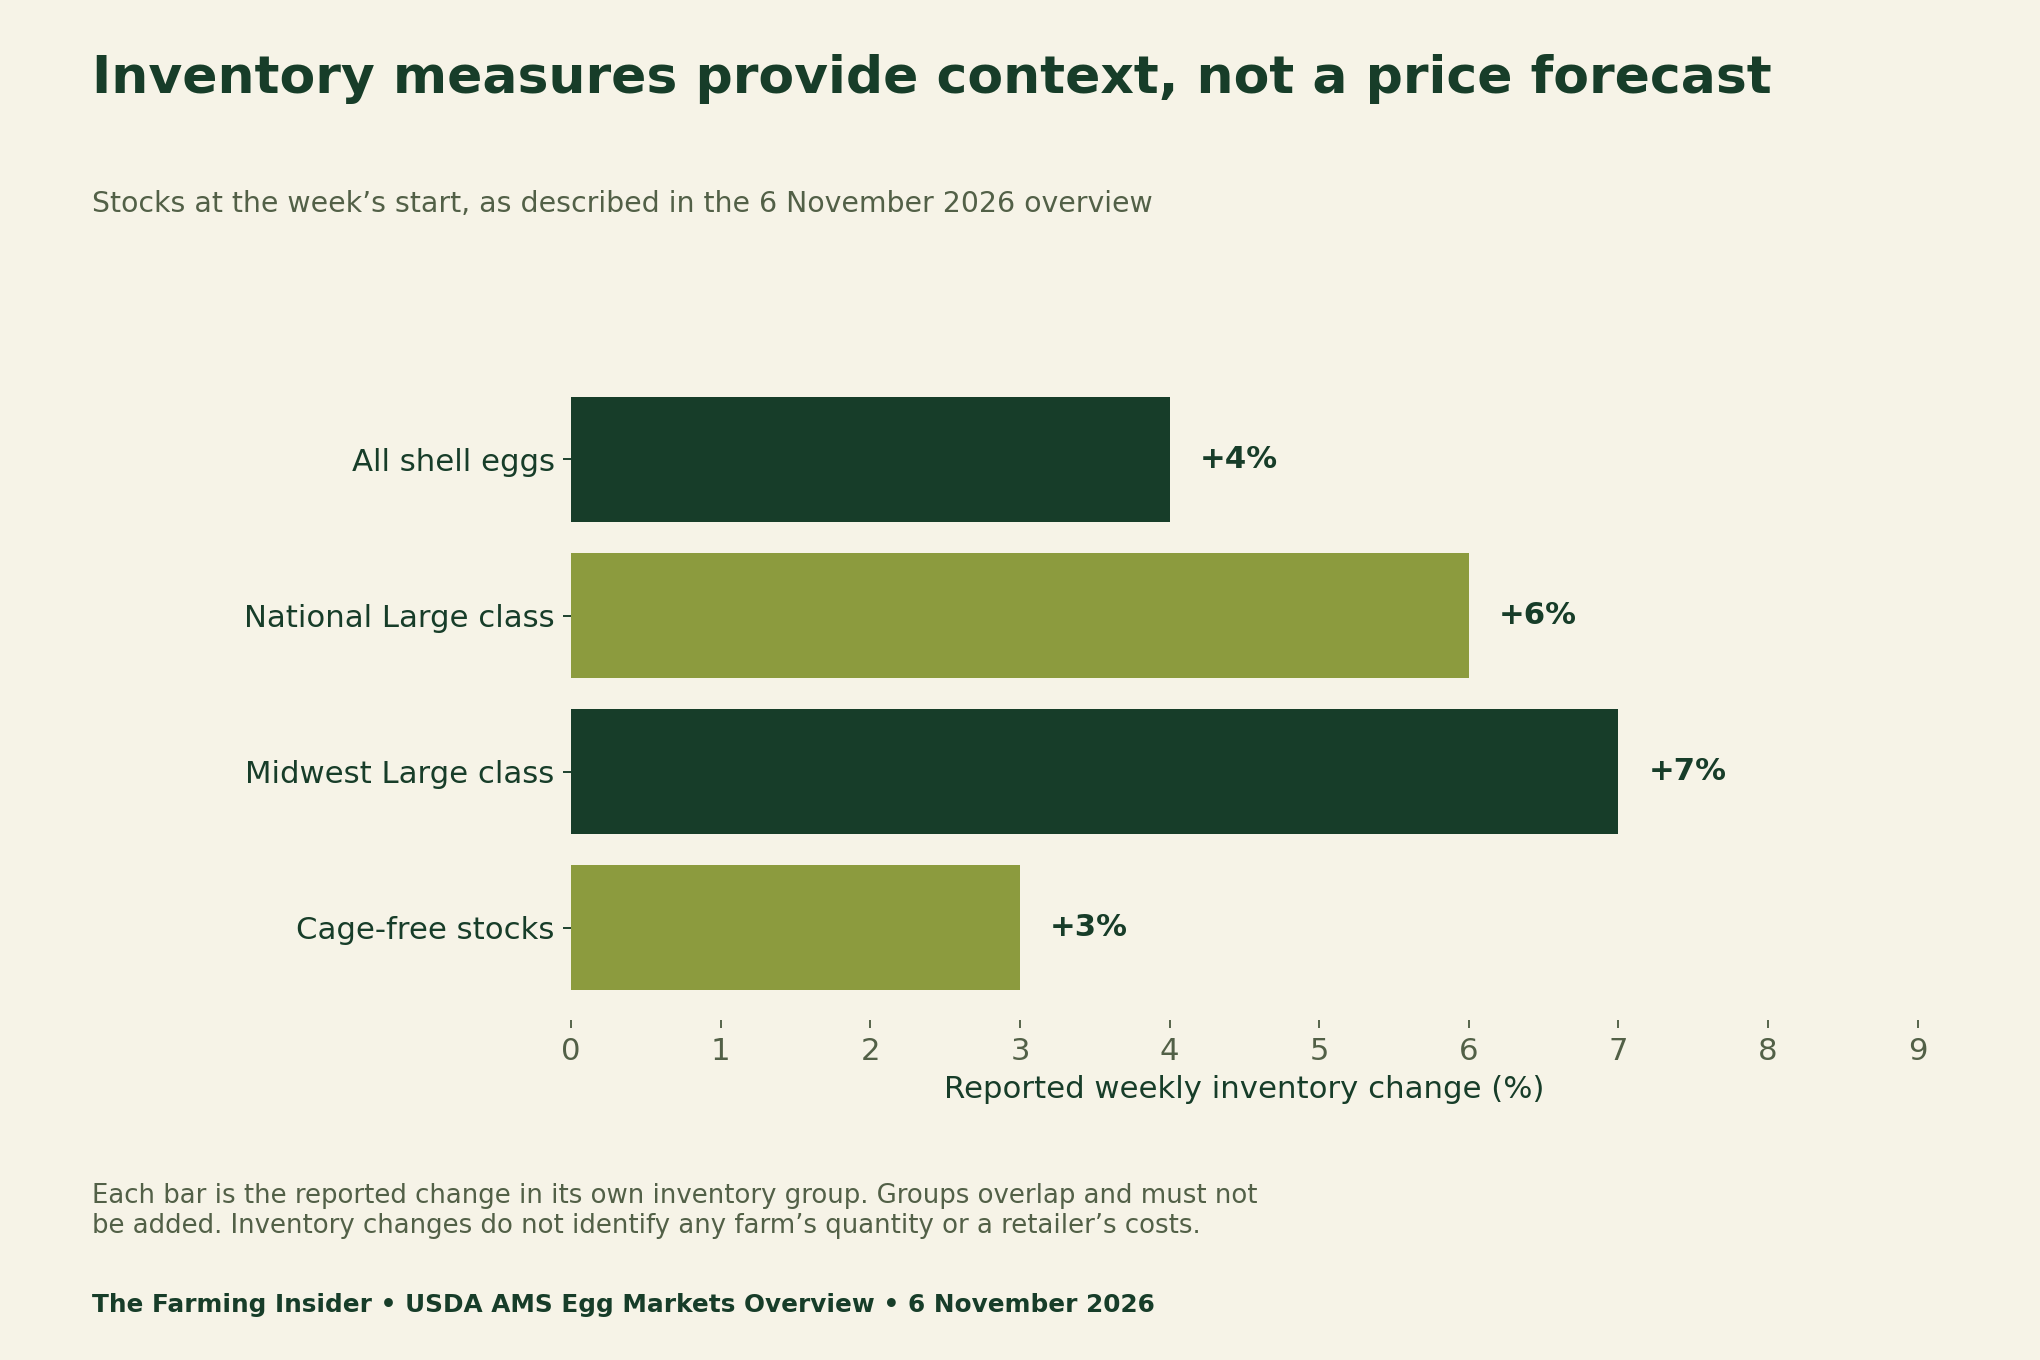
Supply context can help an adviser frame questions, but it is not a farm-level quantity record or a price forecast. The overview’s weekly changes also cannot establish why an individual contract changed. Preserve the reference period and the group definition rather than presenting all figures as measurements of one interchangeable market.
Use a matching checklist for egg buyer offers
Start with size, colour, housing or certification basis, and loose versus cartoned form. Next record pack size, quantity, geography and delivery stage. Finally keep quote validity, freight terms and documented deductions separate. If a field is unknown, record that gap instead of treating an apparent match as proven.
Transform Your Agribusiness
Unlock your farm's potential with expert advice tailored to your needs. Get actionable steps that drive real results.
Get Started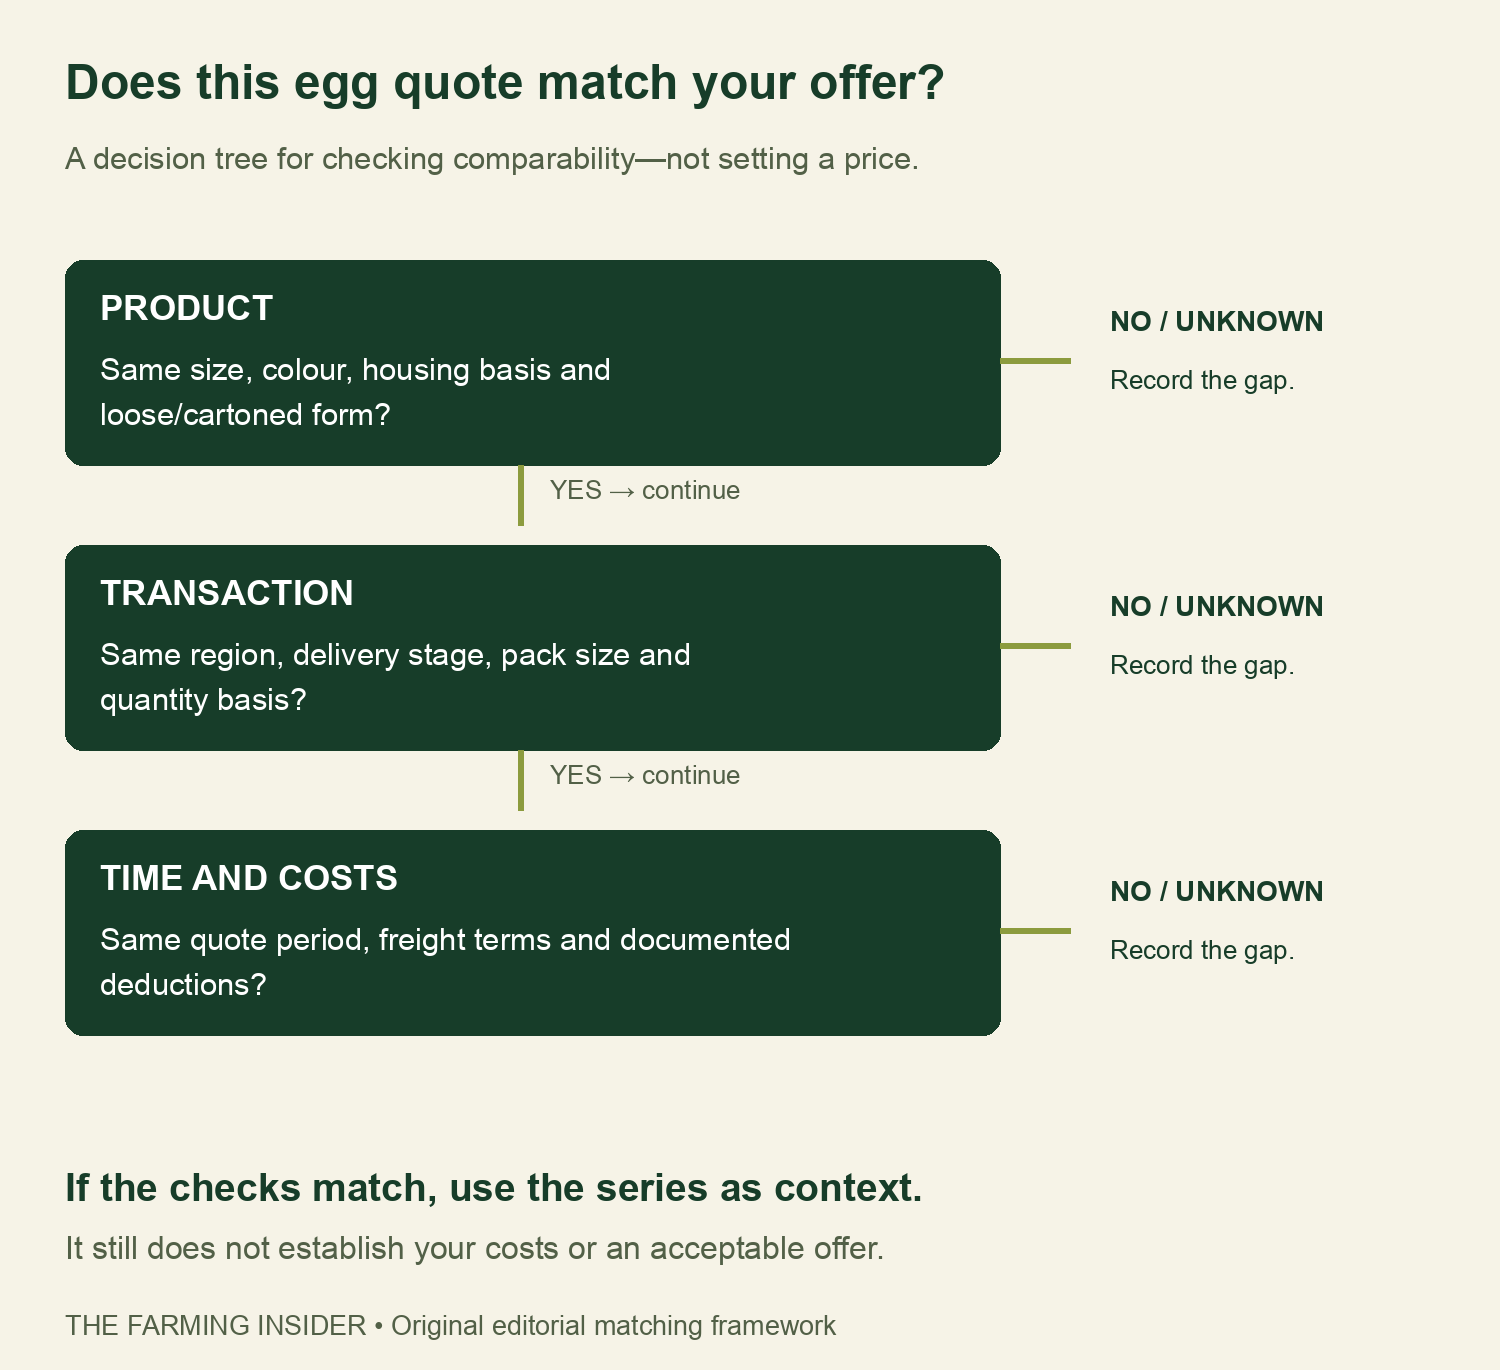
Our peanut price-mix analysis demonstrates another reason a national average can differ from a crop-specific reference. The site’s broader egg-farming guide addresses management context; this report’s narrower task is checking price definitions and evidence.
Download the benchmark dictionary and offer checklist
The source dictionary preserves product and transaction wording, location, date and units. A separate file marks reconstructed prior values and percentage changes as derived. The inventory context file keeps overlapping groups separate. The blank offer checklist contains no collected buyer quotes or farm costs.
- Egg benchmark source dictionary (CSV)
- Derived prior quotes and within-series changes (CSV)
- Dated inventory context and overlap notes (CSV)
- Blank egg buyer-offer matching checklist (CSV)
Methods, source limits and citation
We transcribed the selected narrative quotes and weekly changes from page 1 of the dated overview. Prior values equal current minus stated change; derived percentages divide that change by the derived prior. No historical graph was digitised, no matched-batch dataset was assembled and no cost model was fitted.
The overview also contains a market-comparison graphic with additional measures and labels. We do not substitute those graphic values for the explicitly selected narrative series or combine them into a margin model. This analysis uses one dated edition, cannot establish causal price transmission, and is not a price-setting recommendation.
Suggested citation: The Farming Insider (9 November 2026), “Egg Price Benchmarks for Producers: Match the Transaction.” Attribute original observations to USDA AMS, Egg Markets Overview, 6 November 2026; attribute the derived prior-value file, original charts and matching tools to this analysis.