



A farm operating loan interest budget needs a borrowing calendar, not just a land valuation. Stronger collateral can sit beside tight cash flow. Record what you actually draw, how long it remains outstanding and when repayments fall due. Keep expected receipts separate from money already collected.
Fresh Kansas City Fed evidence provides regional context. Four original charts then explain interest arithmetic with clearly fictional examples. A two-ledger infographic and four free CSV tools help organise a renewal discussion. Research checked on 13 November 2026; this is educational budgeting, not a loan recommendation.
Farm operating loan interest budget: start with the evidence
The Kansas City Fed’s 12 November Agricultural Credit Survey report discusses third-quarter 2026 conditions in the Tenth District. Average operating-loan rates were about 7.5%, versus about 7% for real-estate loans. Both average fixed and variable rates. They are not national offers or a forecast of your renewal terms.
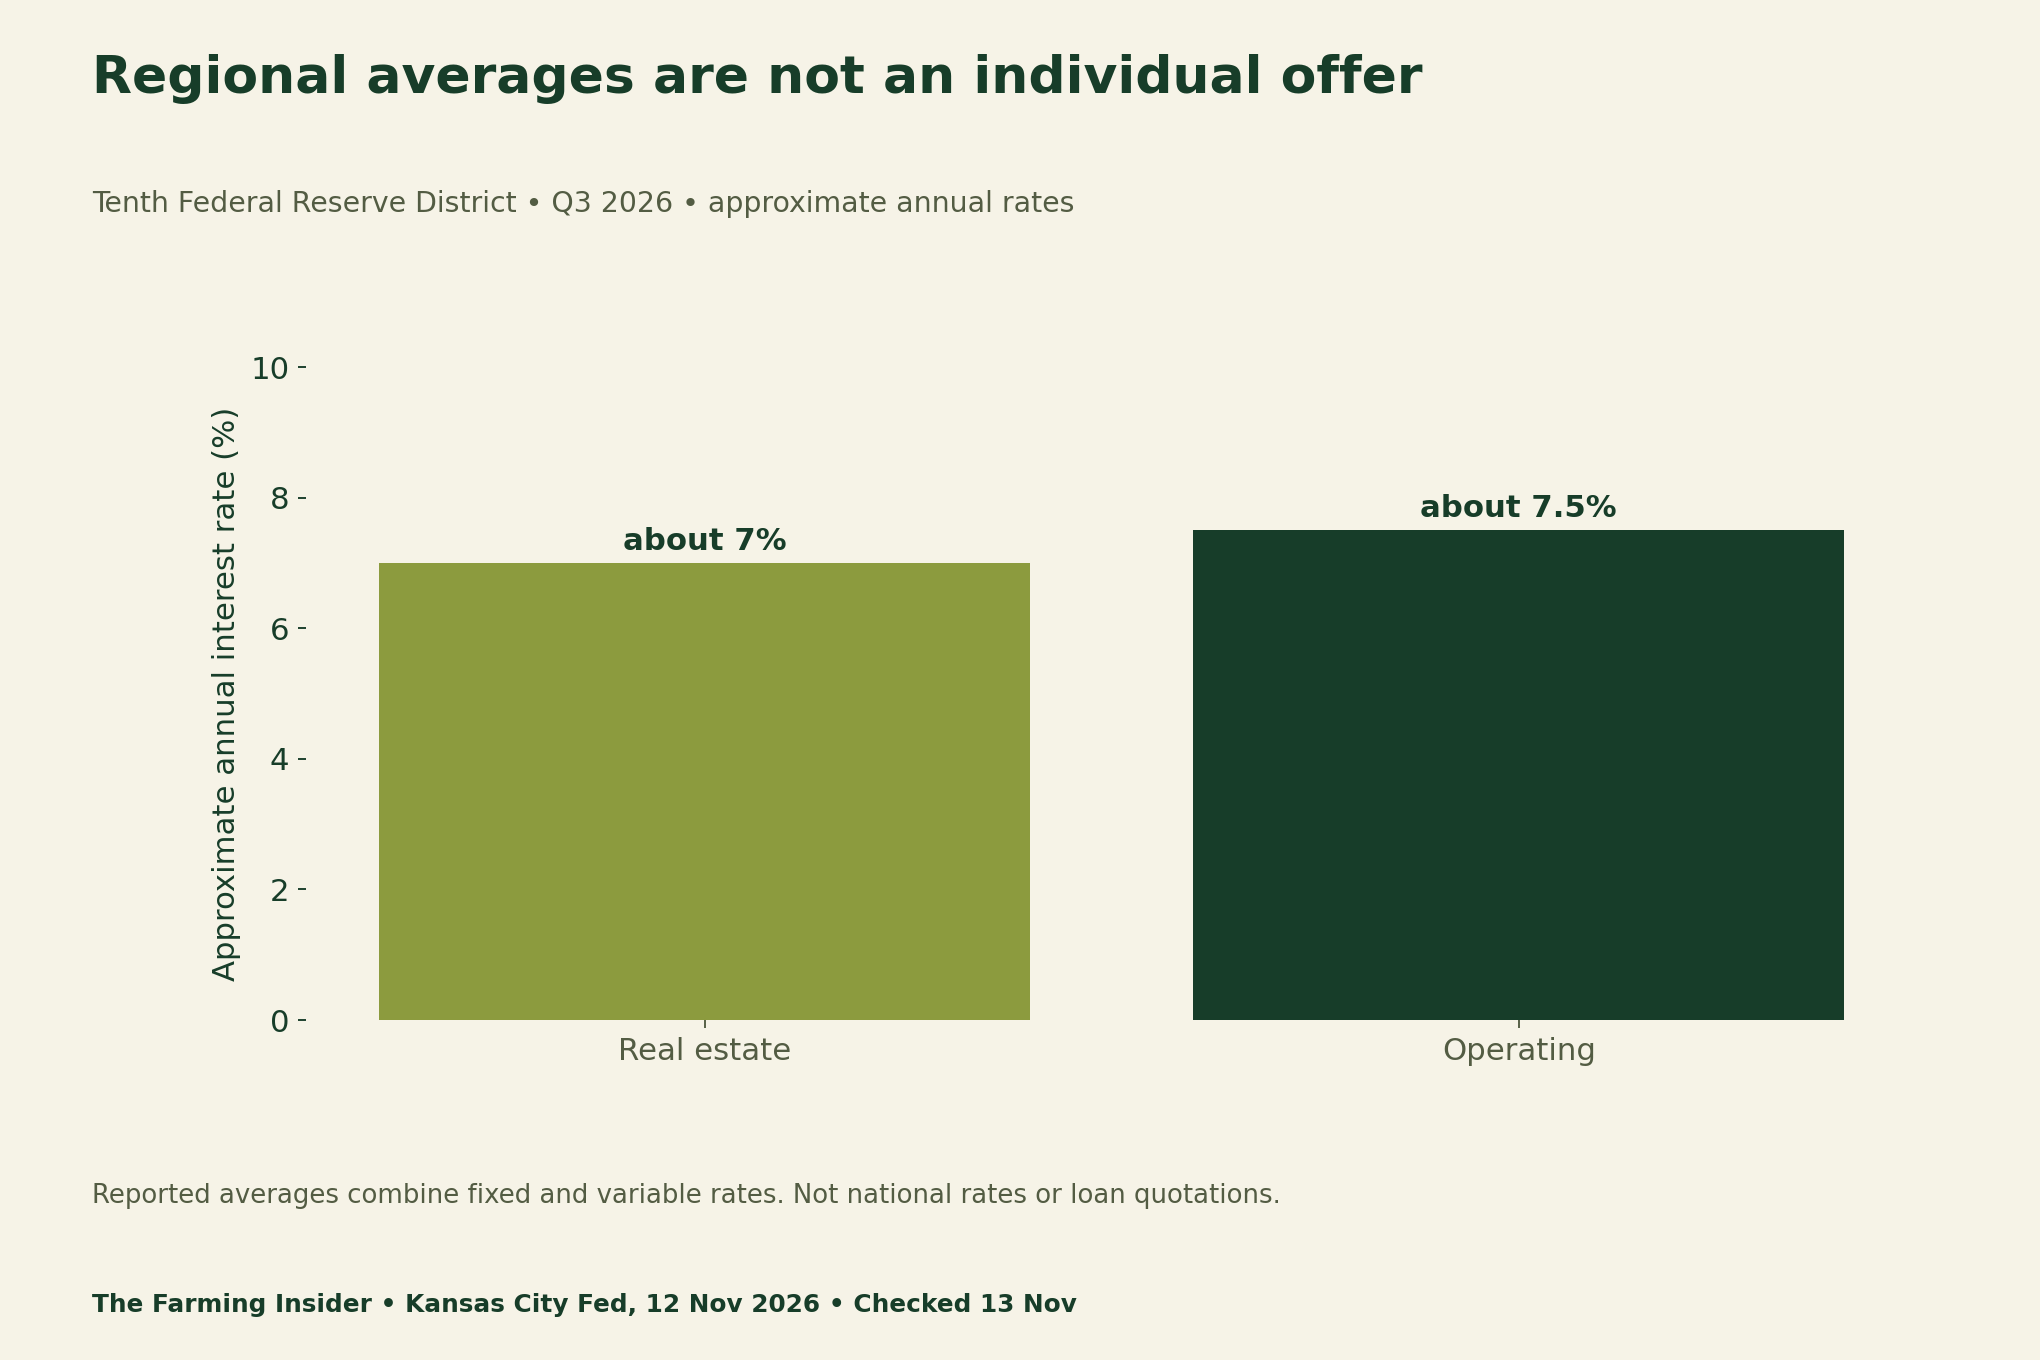
The report also describes ranchland values rising almost 10% year over year, irrigated cropland rising 5% and nonirrigated values holding steady. Those are valuation measures. A valuation gain does not itself deposit cash into an operating account.
Keep collateral and repayment cash in different ledgers
A balance sheet asks what the business owns and owes at a particular date. A cash calendar asks when receipts and payments occur. They answer related questions, but one cannot replace the other. Record an updated land valuation in the asset ledger, with its date and supporting basis.
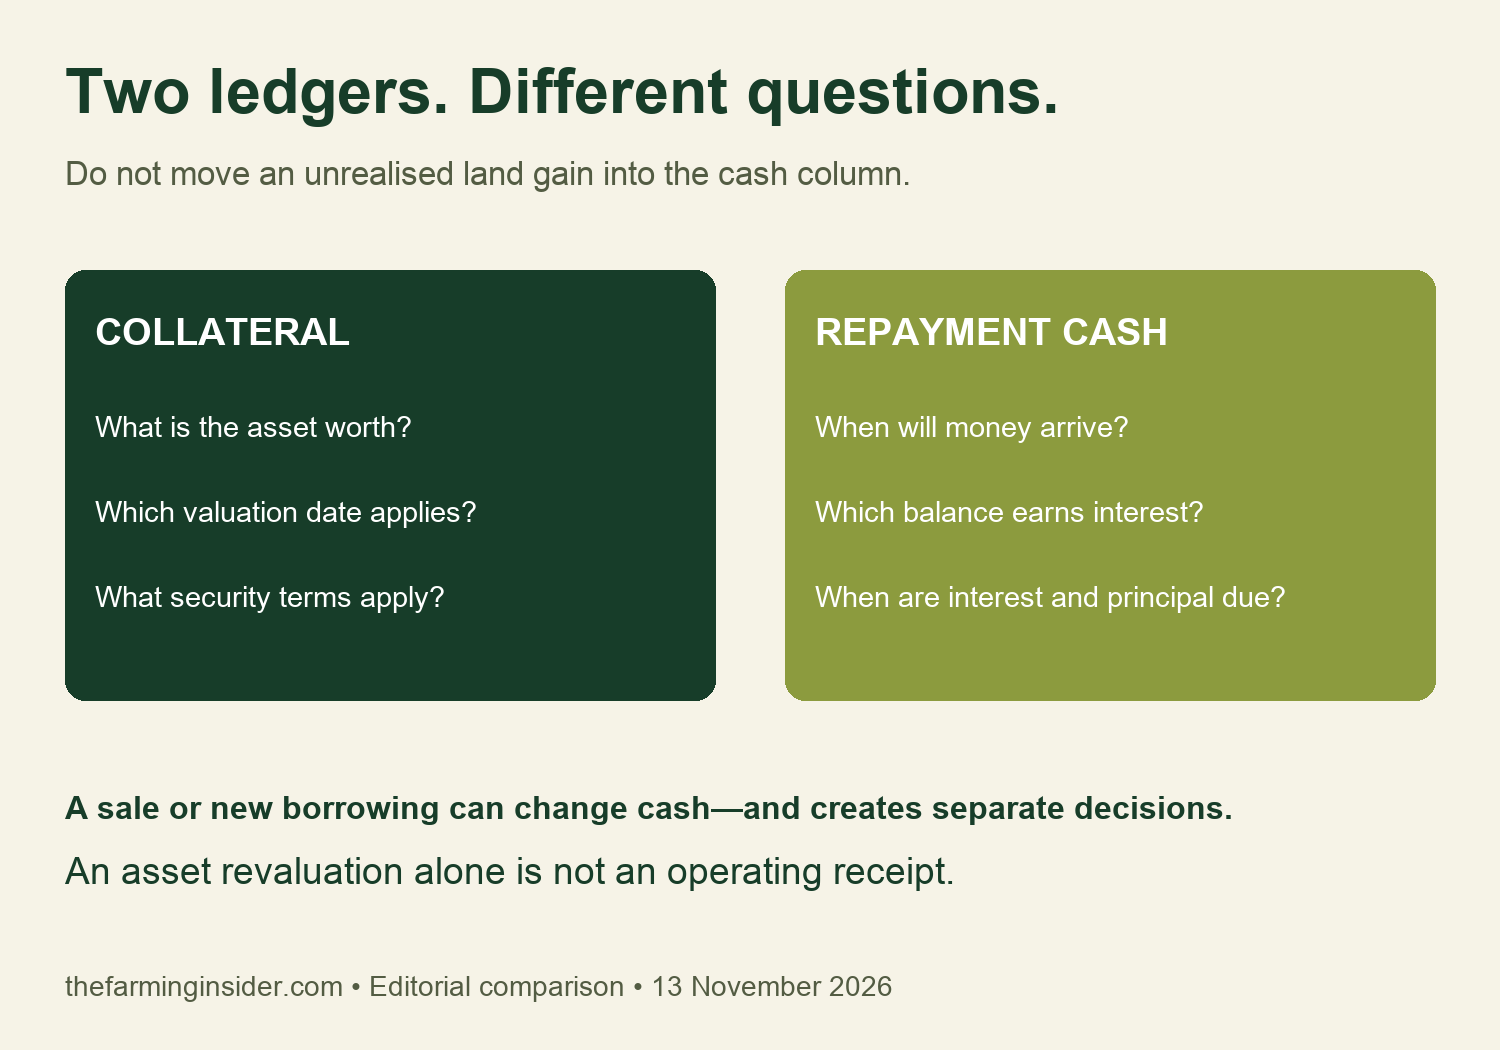
For the cash ledger, list each payment date and the funds expected before it. Distinguish a signed sale contract from an unconfirmed price assumption. Note collection delays, fees and principal repayments. A facility can look affordable over a whole year yet face a difficult payment date before sales arrive.
Calculate a simple interest scenario transparently
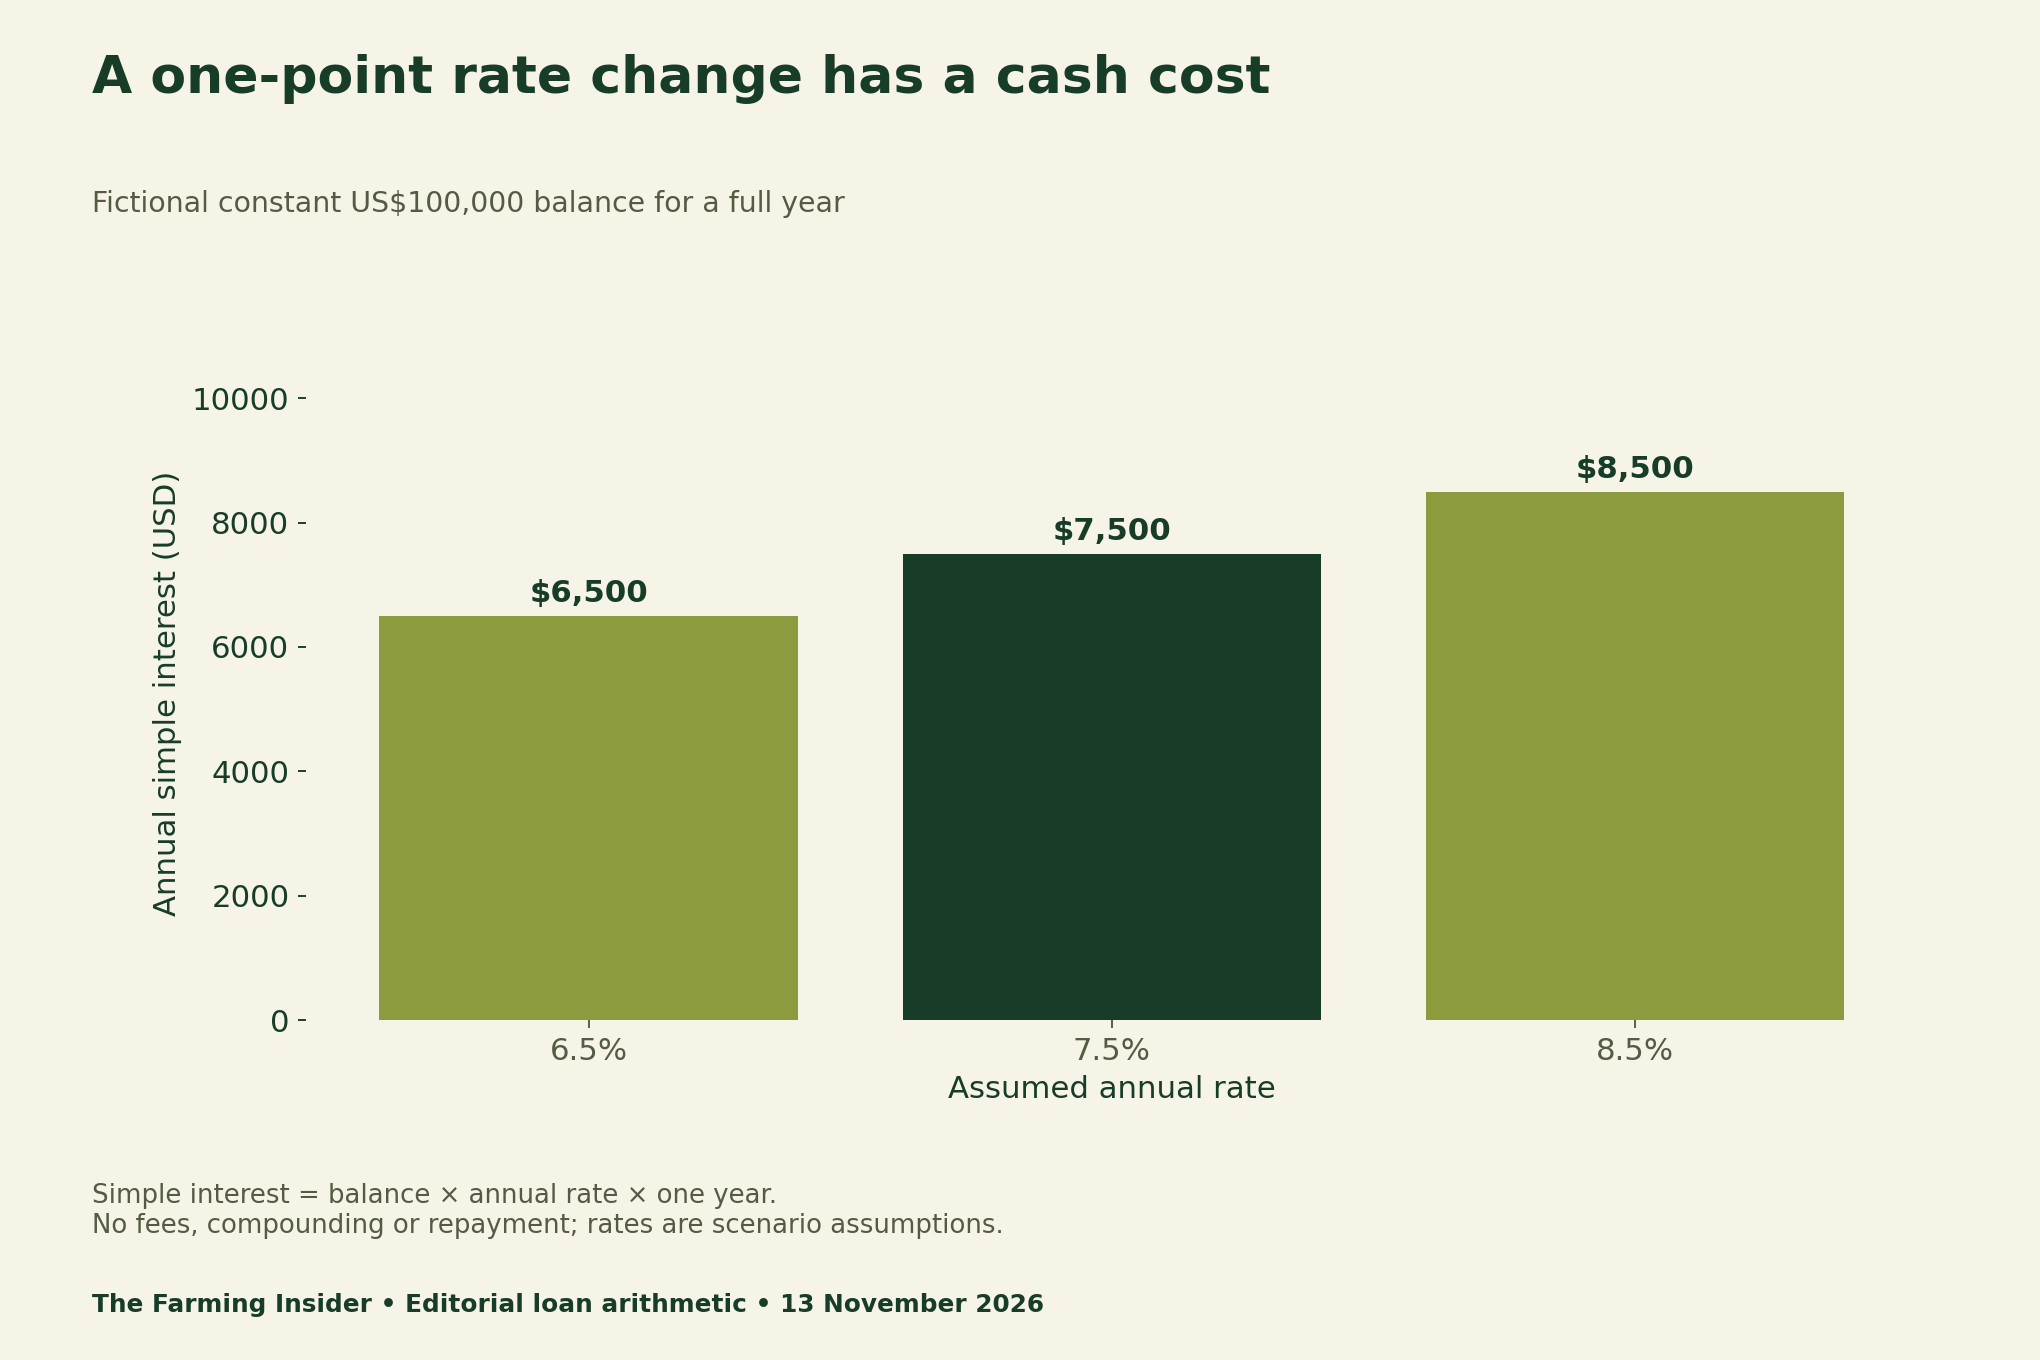
For a constant US$100,000 balance over one full year, simple interest at 7.5% is US$7,500 before fees. At 8.5%, it is US$8,500. The US$1,000 difference follows from the stated balance and time; it is not a predicted increase in anyone’s bill.
Simple interval interest = outstanding balance × annual rate as a decimal × days ÷ contractual year basis.
The contract controls the actual calculation. Check its day-count basis, rate-reset terms, compounding, fees and treatment of transactions within a day. A simple Actual/365 example cannot reproduce every lender statement. Ask the lender to explain a worked interval if the calculation is unclear.
Put drawn balances into the borrowing calendar
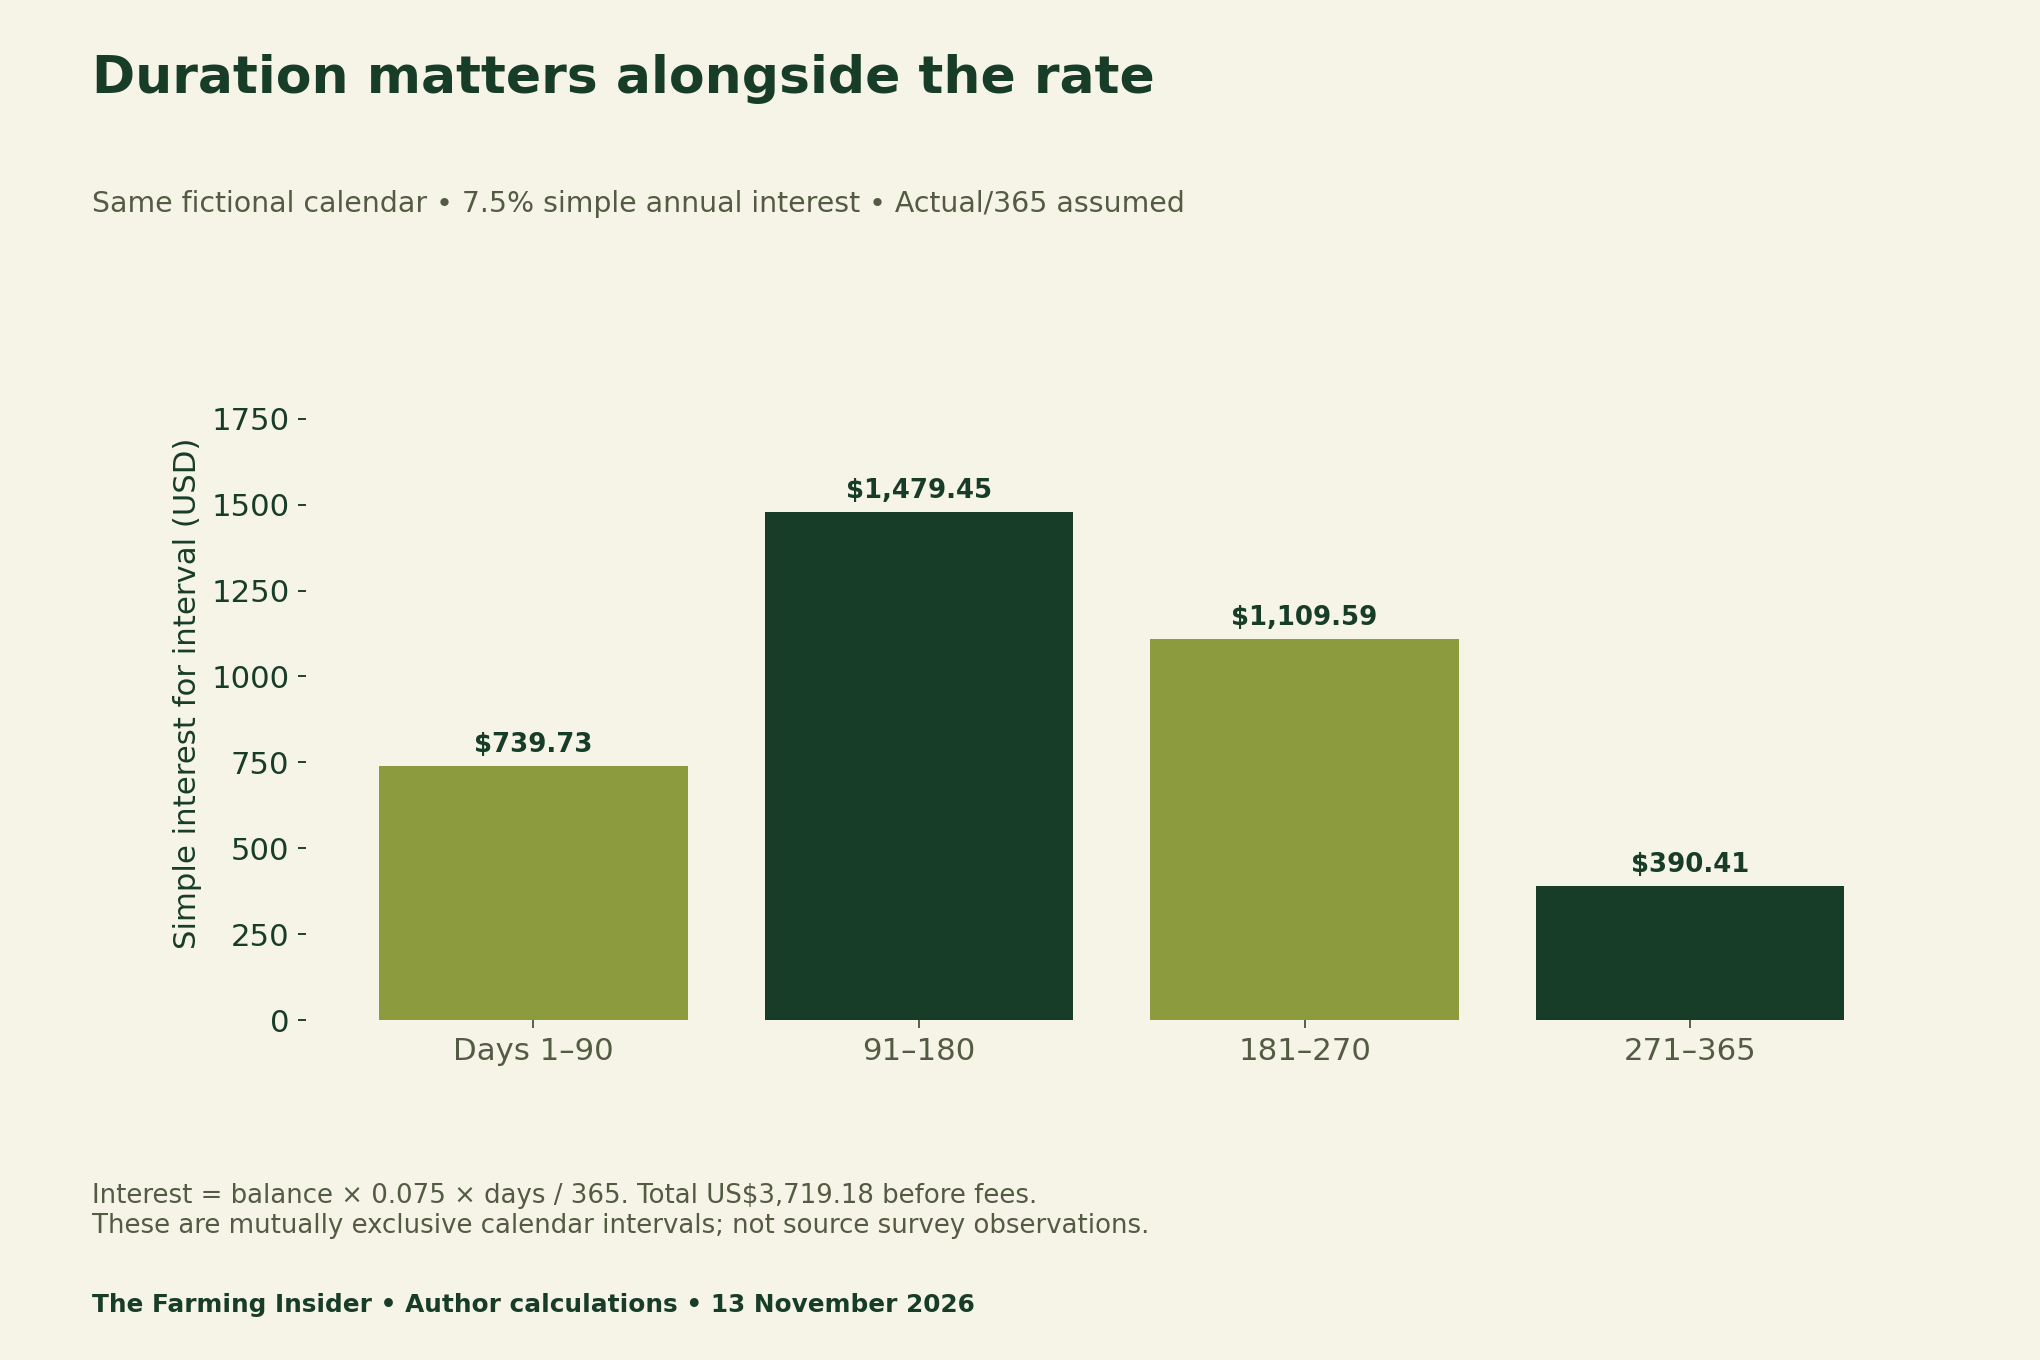
Now consider a fictional US$100,000 facility that is never fully drawn. It carries US$40,000 for days 1–90, US$80,000 for 91–180, US$60,000 for 181–270 and US$20,000 for 271–365. These windows cover exactly 365 days without overlaps. They do not describe a typical farm.
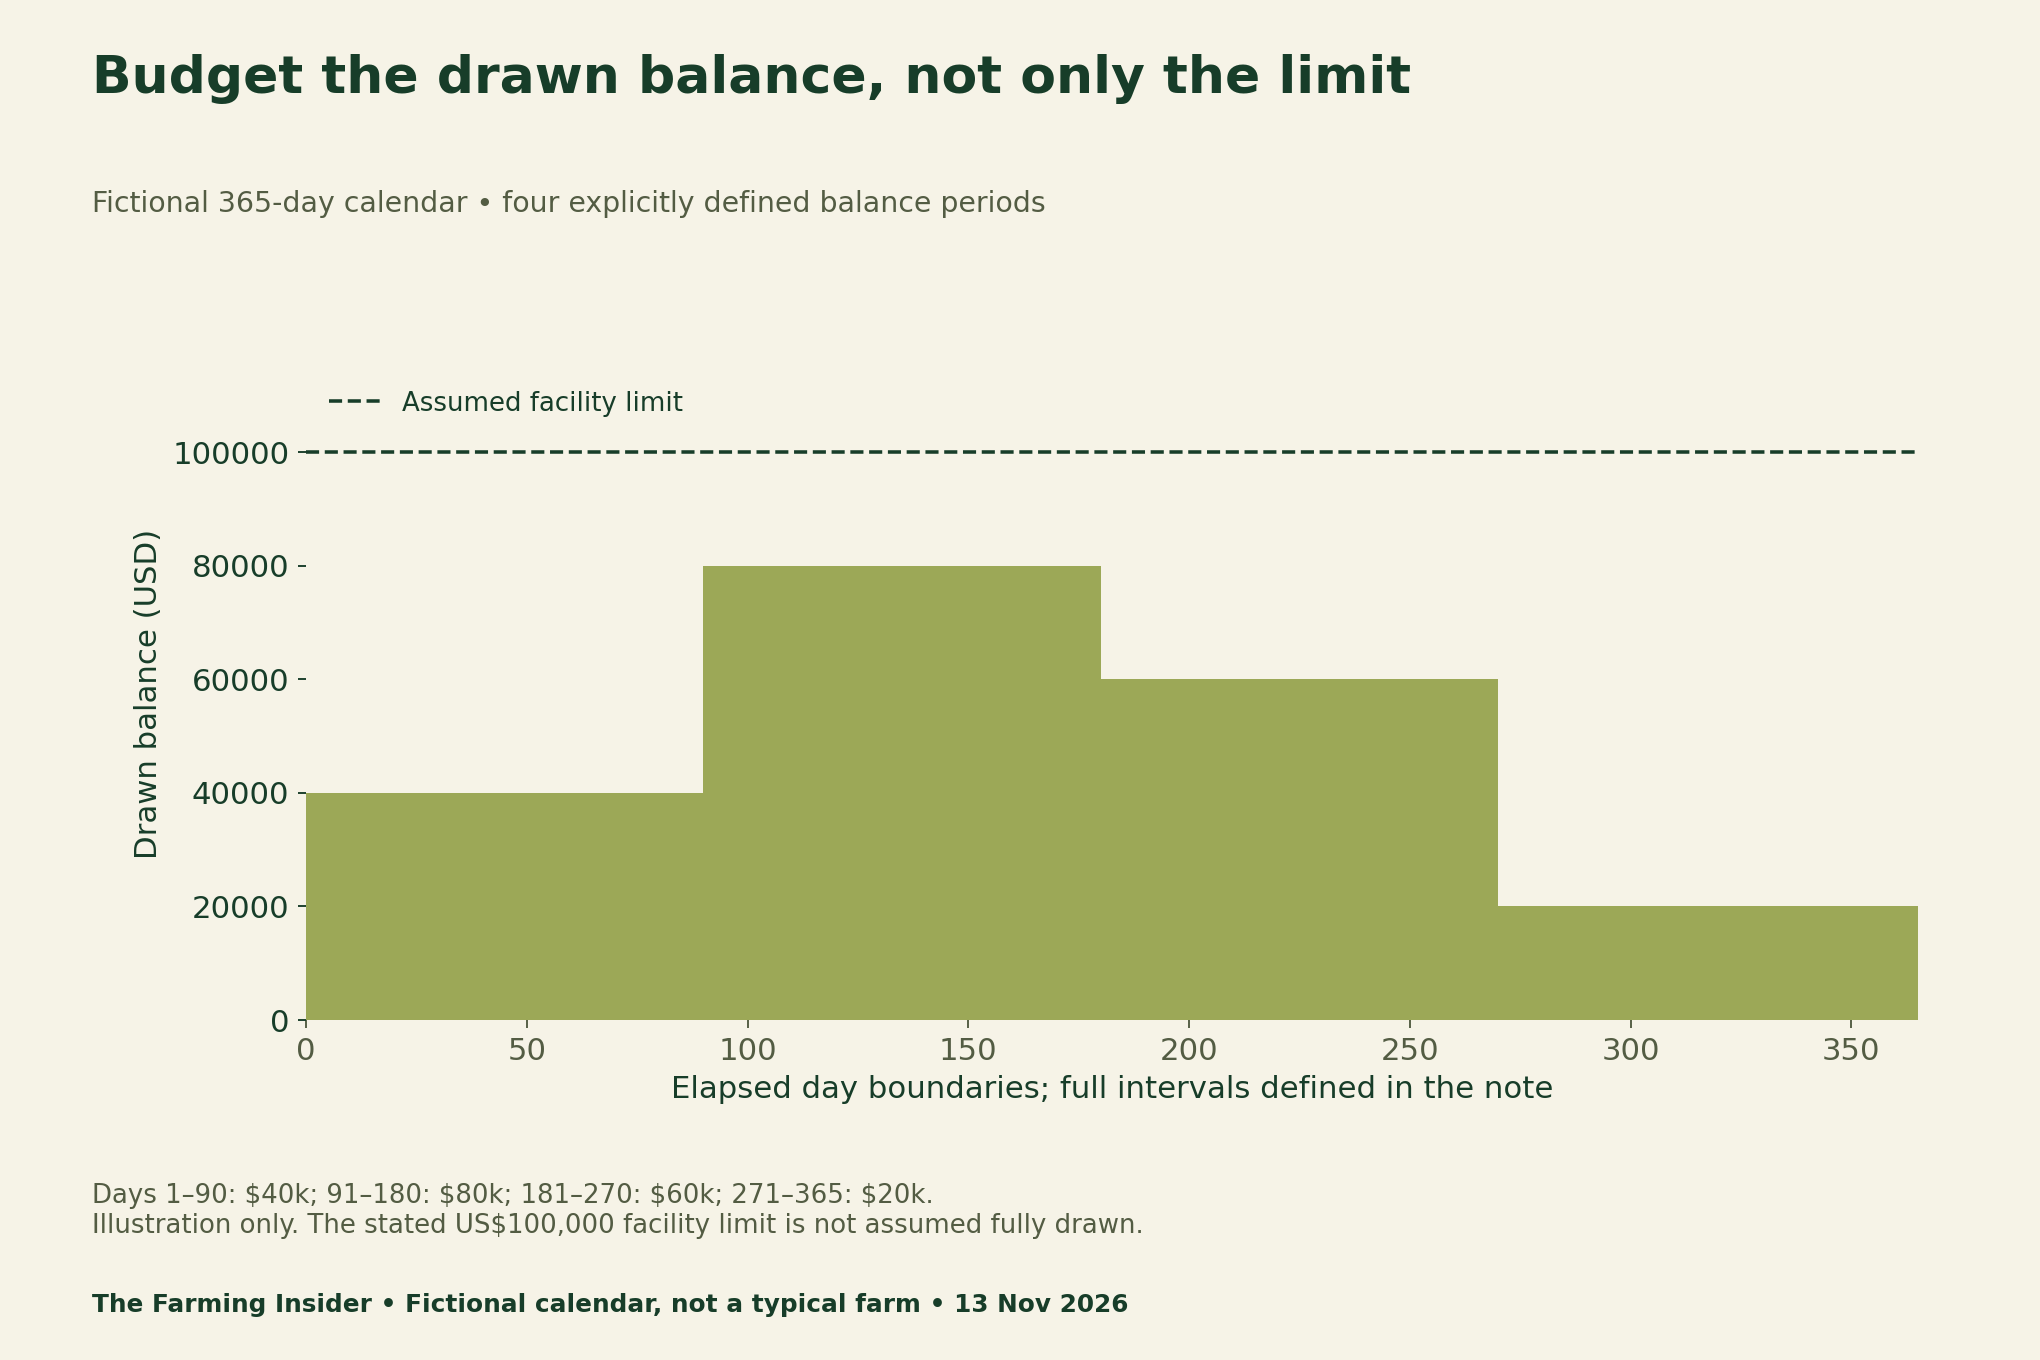
At a constant assumed 7.5% rate and an Actual/365 basis, interval interest totals US$3,719.18. Applying 7.5% to the full facility limit for a year would instead give US$7,500. That difference demonstrates the effect of the invented draw calendar, not savings available to every borrower.
Prepare questions before renewing a facility
Start with statements and the existing contract. Reconcile opening balances, draw dates, repayment dates and charges. Next, mark every future receipt as confirmed, conditional or only a planning assumption. Keep private financial records locally; these worksheets do not require sending us borrower information.
Then test a delay in receipts. A late payment may leave a balance outstanding for longer even if the annual rate is unchanged. Consider rate resets separately. If both change at once, retain a clear record of the new dates and rates rather than attributing the whole result to one cause.
Our farm input-cost exposure guide uses a similar separation of price and quantity assumptions. Its UK price measures cannot be substituted directly for a US farm’s costs; use it for the method, with locally appropriate records.
Download the four planning files
The source summary preserves approximate regional wording. The example file supplies every chart input and formula assumption. Fill the blank calendar with your own dates and contract details, then use the renewal checklist to record questions that remain unanswered.
Transform Your Agribusiness
Unlock your farm's potential with expert advice tailored to your needs. Get actionable steps that drive real results.
Get Started- Regional credit measures and scope notes (CSV)
- Fictional borrowing and interest calculations (CSV)
- Blank private farm borrowing calendar (CSV)
- Loan-renewal evidence and questions checklist (CSV)
Methods and limits
We transcribed selected approximate findings and calculated simple interest from fictional balances, rates and durations. We did not estimate borrower approval, default risk, land values, profitability or expected loan savings. A survey average does not establish a fair offer for a particular borrower.
The report’s closing sample note says “Second Quarter” despite the third-quarter analysis. Therefore, we do not treat its stated respondent count as a verified Q3 sample size. Regional survey results also do not establish national credit conditions. The source and chart notes retain these boundaries.
Use a qualified adviser and the actual lender documents for a financing decision. Suggested citation: The Farming Insider (13 November 2026), “Farm Operating Loan Interest Budget: Separate Cash From Collateral”, regional-source analysis and original illustrative worksheets. Keep fictional inputs and exclusions attached when reusing a chart.