





Australia farm support figures from the OECD are national indicators, not a promise of money for an individual business. The 2026 Australia chapter reports producer support at 1.8% of gross farm receipts for 2023–25. Multiplying your own revenue by 1.8% does not calculate a grant entitlement.
Featured image: AI-generated conceptual farm-planning scene, not a documentary photograph of a named farm or support recipient.
This denominator-first guide supplies two original charts, an evidence-status infographic and four free CSV tools. Use them to distinguish aggregate statistics from a specific programme’s rules and a farm’s actual records. Research checked on 9 November 2026.
Date Australia farm support evidence before interpreting it
The OECD Australia chapter was published on 2 November 2026. Its headline support estimates cover 2023–25, not a snapshot of November 2026 payments. Keep the publication date and the measured period in separate fields when citing the report.
A three-year national measure answers a different question from “what can this business apply for today?” A later publication can describe earlier observations. Conversely, a newer policy announcement can concern funding that falls outside the statistical reference period. Neither date should silently replace the other.
Read Australia farm support with four different denominators
| Measure | 2023–25 figure | Denominator | Reading boundary |
|---|---|---|---|
| Producer support (PSE) | 1.8% | Gross farm receipts | Not an individual payment rate |
| General services (GSSE) | Around 2% | Agricultural production value | Around 2%; not the standard %GSSE share of TSE |
| R&D and innovation | 1.3% | Agricultural production value | Included within GSSE; do not add again |
| Total support (TSE) | 0.1% | Gross domestic product | Not an agricultural receipts denominator |
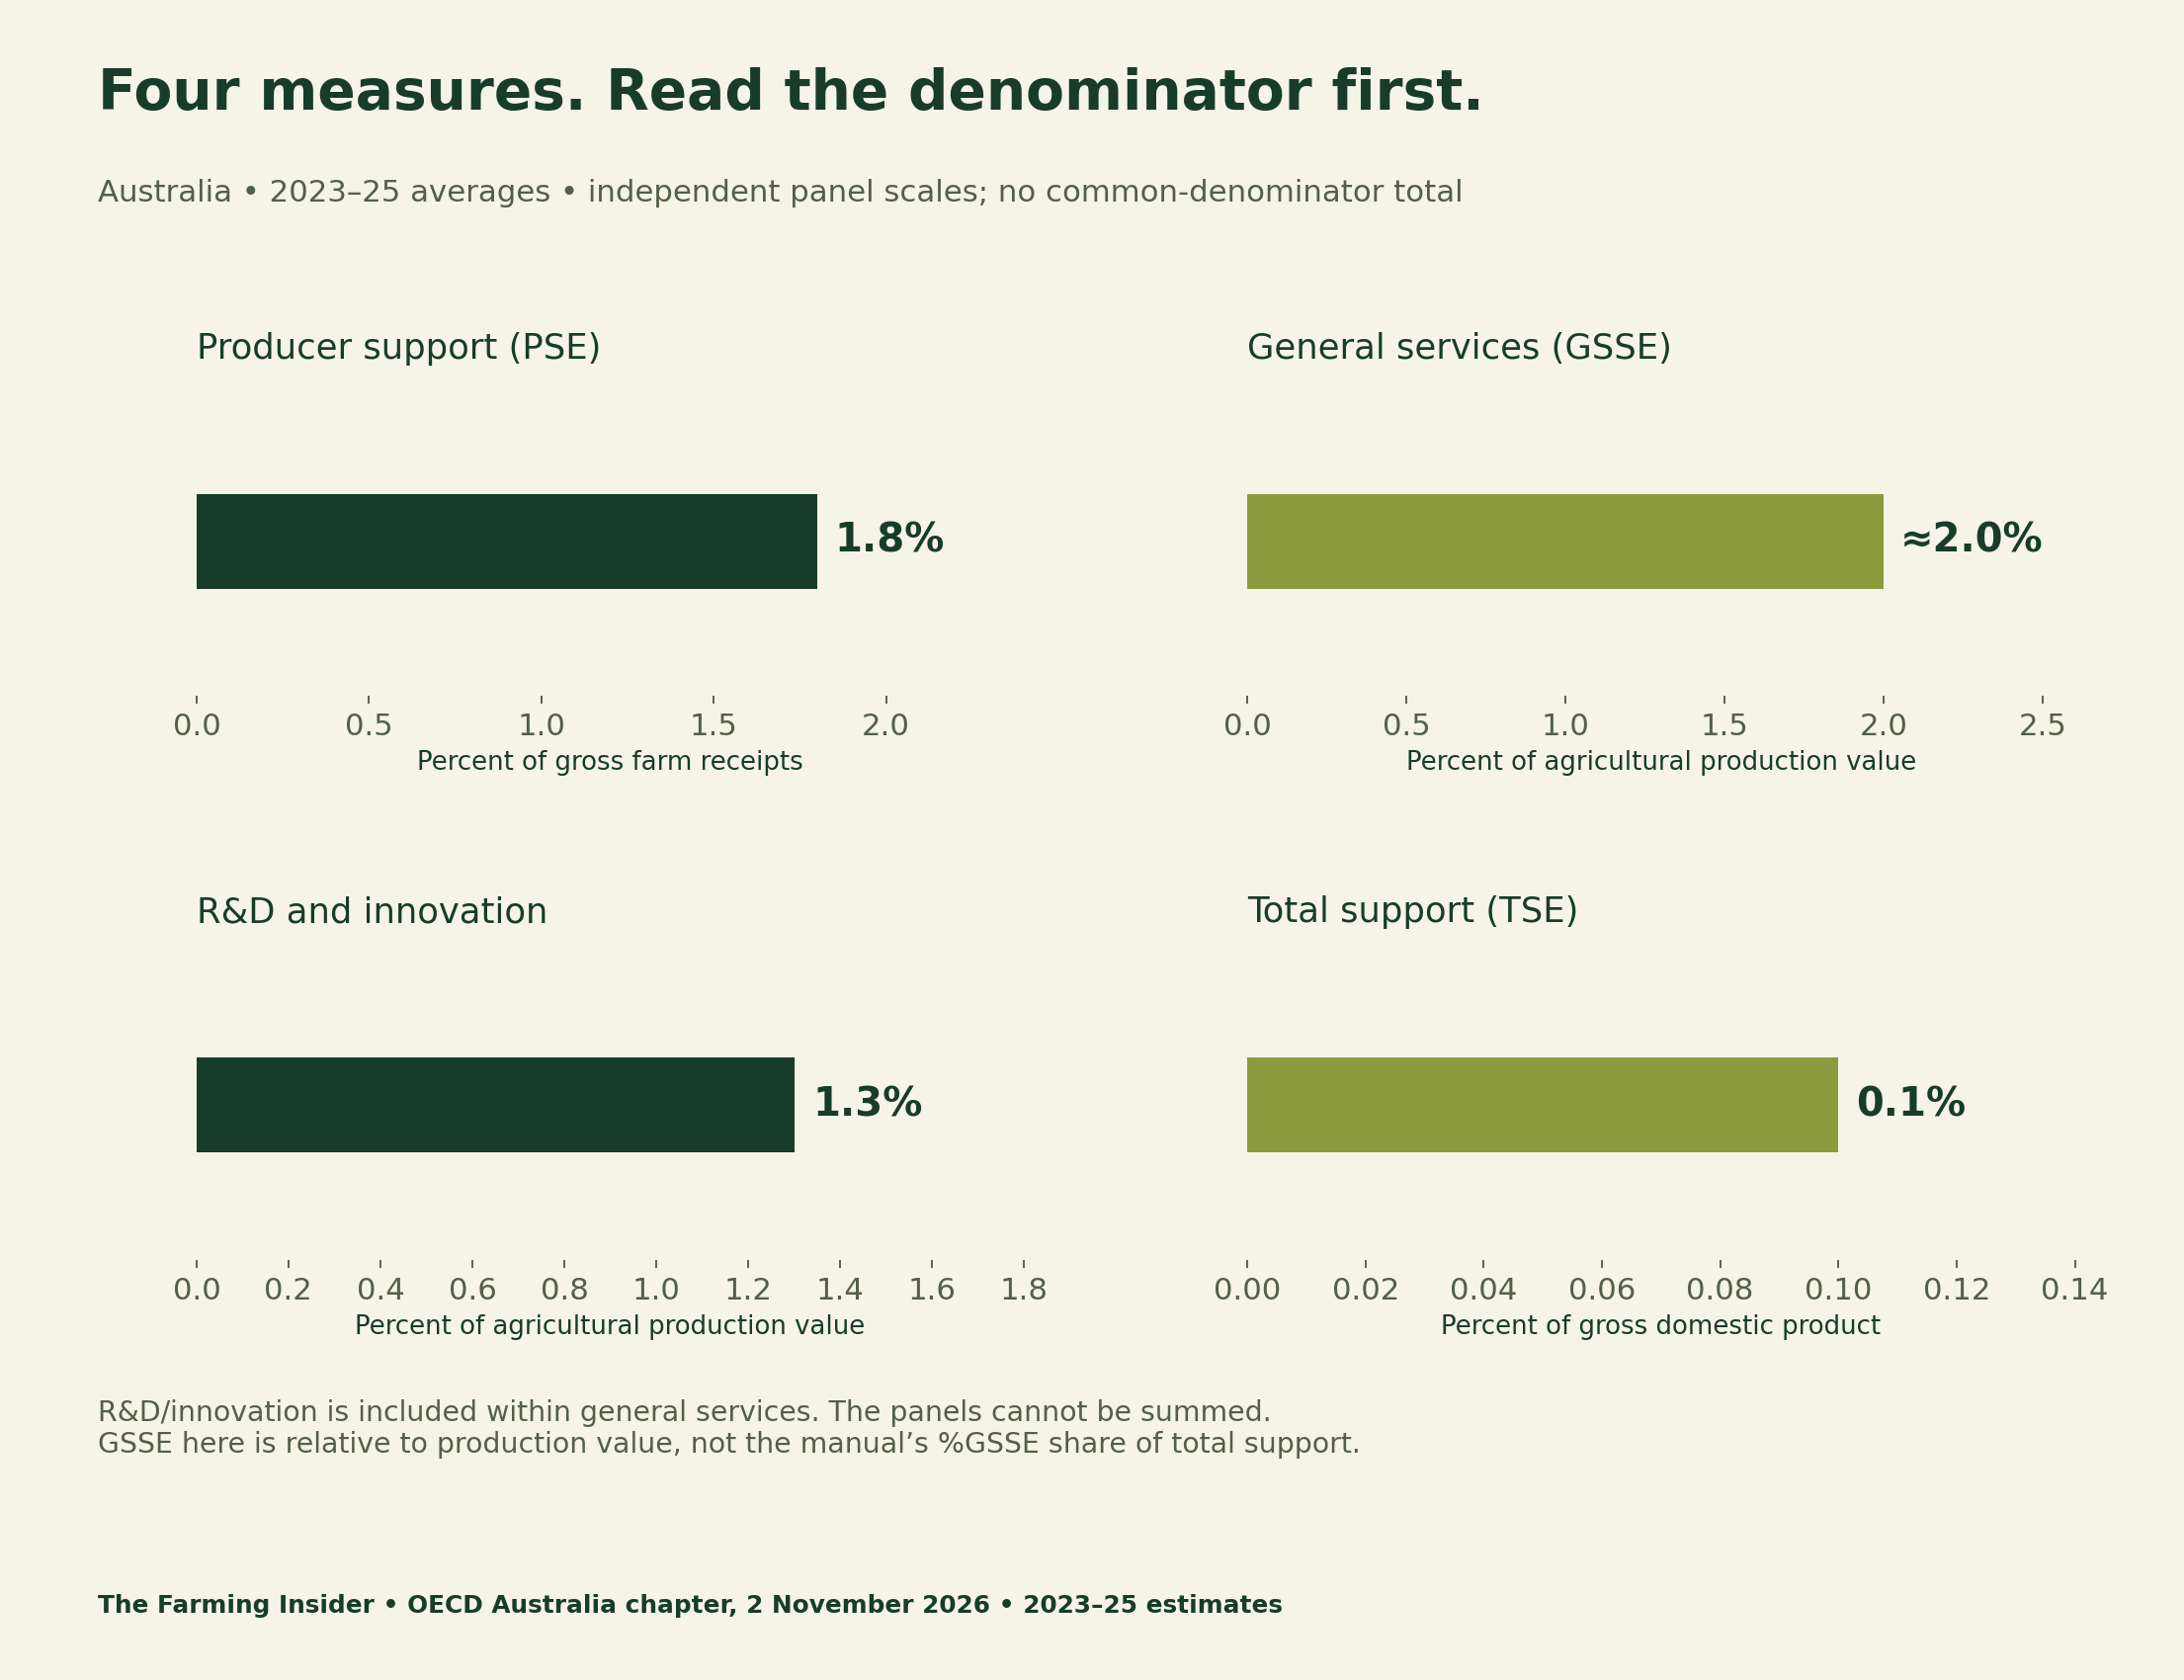
Write the denominator beside the number every time. “Percent” alone is incomplete. Receipts, production value and national GDP are not interchangeable totals. Adding the four displayed rates would also count R&D and innovation again inside the broader services measure. The arithmetic would produce a number without a defensible policy meaning.
The chapter expresses general services relative to agricultural production value. That should not be confused with the manual’s standard percentage-GSSE indicator, which uses total support as its denominator. Preserve the source’s actual ratio rather than assuming that every percentage attached to the same acronym means the same thing.
Producer support is broader than a cash grant
The OECD PSE Manual defines producer support as policy-related transfers measured at the farm gate. Its framework includes budget payments, revenue foregone and market-price support. General services instead concern enabling services for agriculture collectively; they exclude direct payments to individual producers. Total support aggregates transfers net of associated budgetary receipts.
These definitions help classify evidence. A payment shown in a farm bank record, an estimate of a tax concession and sector-wide research expenditure are different objects. A useful farm ledger should preserve their identities rather than merge everything under a single “government cash received” heading.
A national percentage cannot calculate your entitlement
Consider an entirely hypothetical business with A$500,000 in revenue. Multiplying by 0.018 gives A$9,000. This is an arithmetic illustration only. It is not an estimate of an award, a forecast of support, an eligible loan amount or a line that should be inserted into a cash-flow budget.
To turn a possible programme into a budget assumption, you would need its current rules, the applicant’s circumstances and appropriate evidence of a decision. The national ratio supplies none of those missing inputs. It also does not identify how support is distributed between industries, regions or individual farms.
Compare periods without inventing a farm-level result
The OECD’s rounded PSE rate was 3.6% in 2000–02 and 1.8% in 2023–25. The difference is −1.8 percentage points. This comparison preserves the same denominator label across two multi-year periods; it does not reconstruct the intervening annual path.
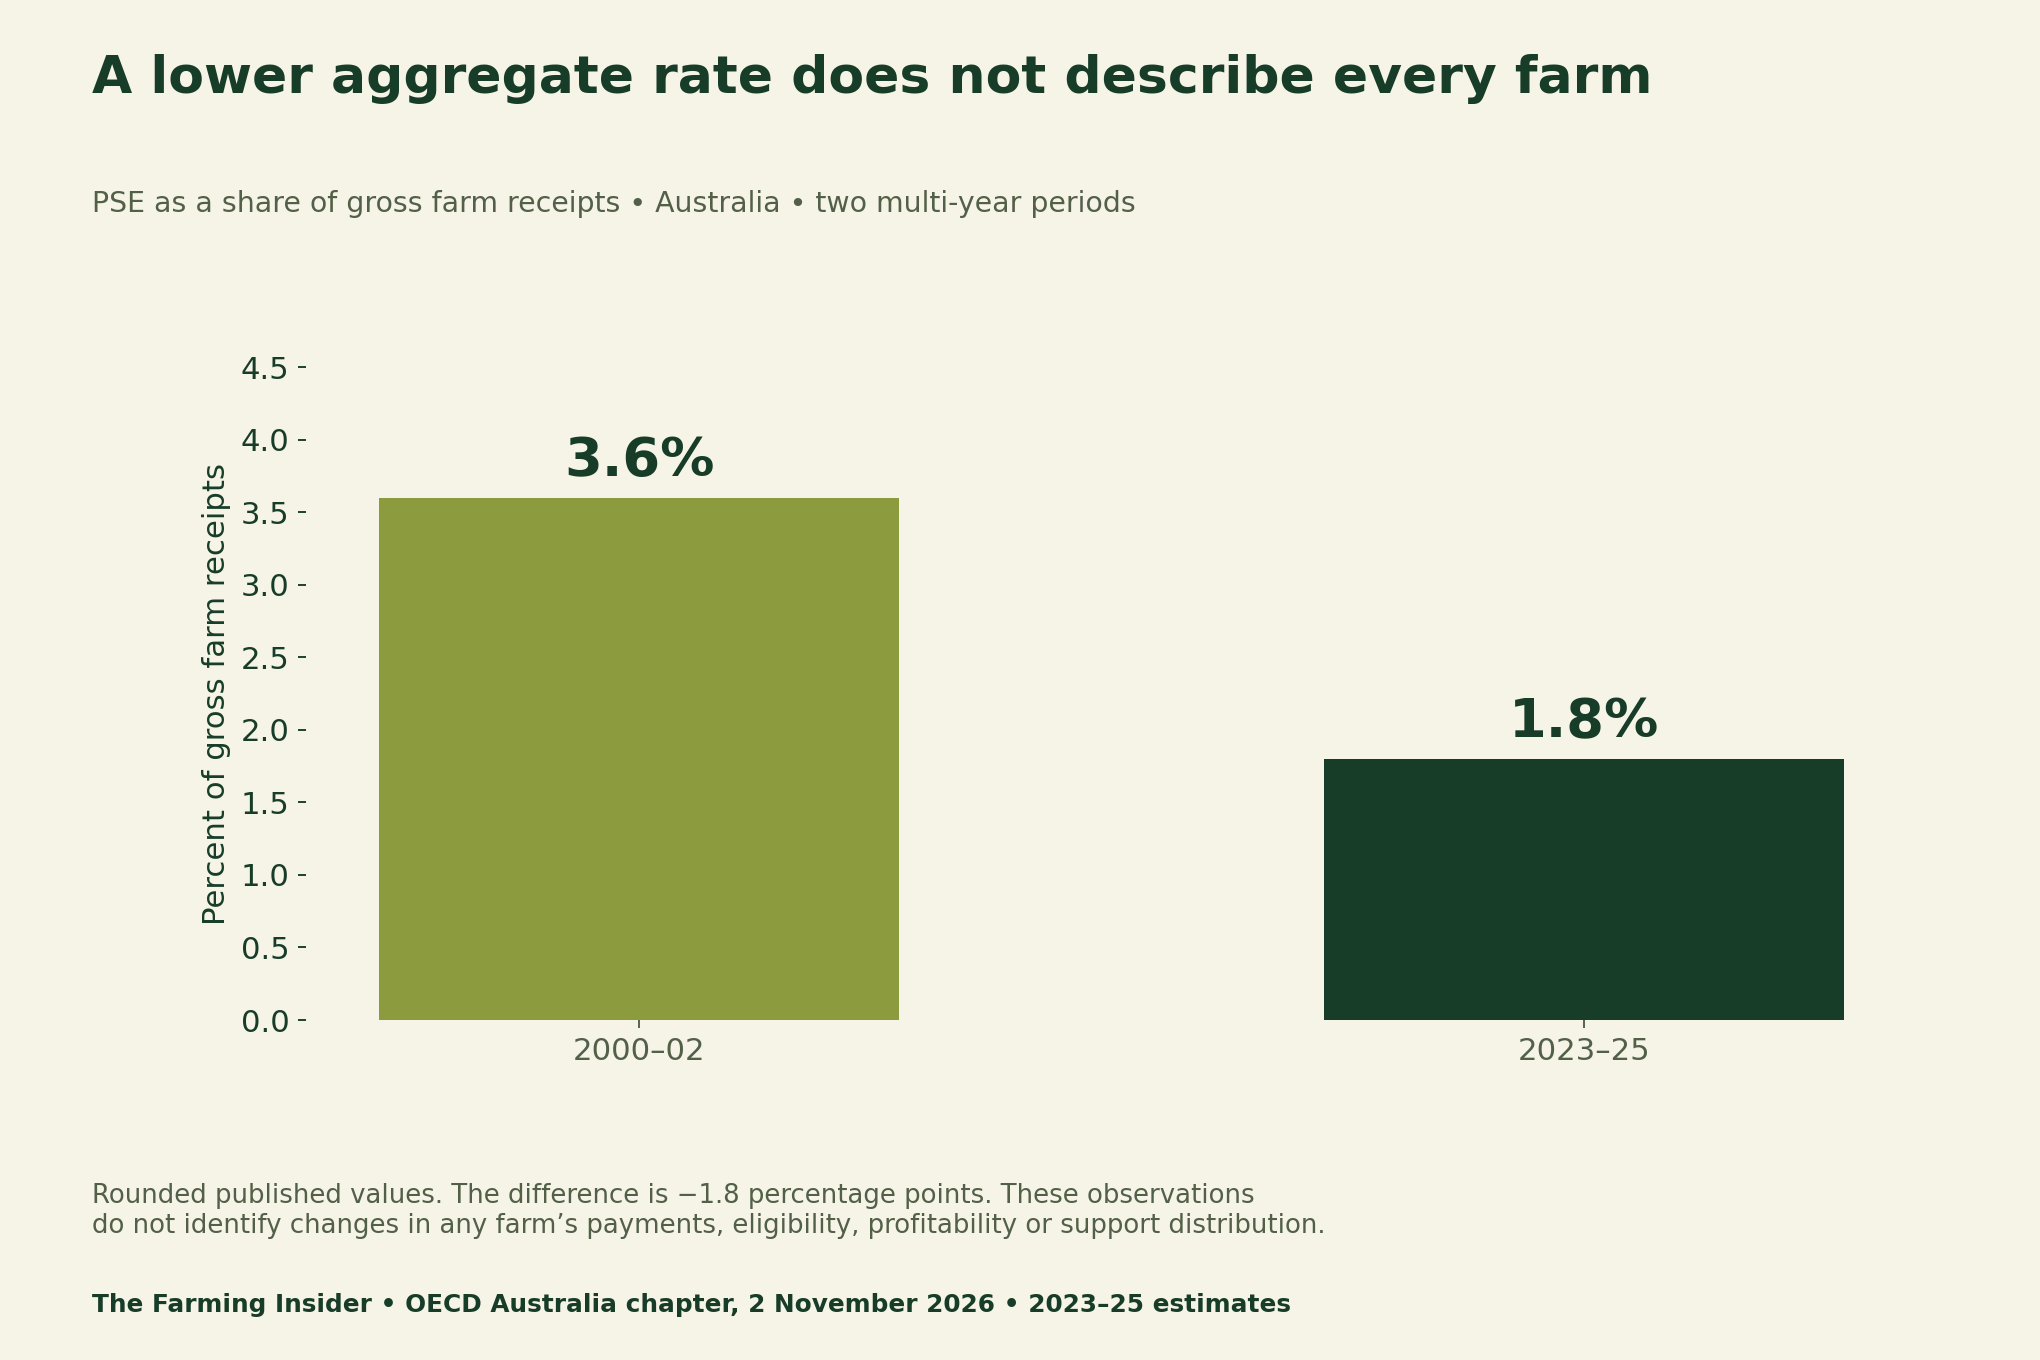
A lower national ratio could be discussed alongside many other records, but this chart alone cannot isolate its causes. Avoid describing the difference as money every farmer lost. For a local discussion, attach the business’s own dated evidence and explain what remains incomparable before drawing a conclusion.
Loan funding needs a separate policy-status ledger
The chapter describes an additional A$1 billion for producer loans over three years from 2026–27. Independently, RIC’s 1 July 2026 announcement states that the additional loan funding became available from that date. These describe the same funding envelope, not two separate billions to add.
Availability does not document an individual approval or drawdown. Loan principal is not equivalent to grant income, and the headline amount is not a measure of the concessional benefit to a particular borrower. This article does not establish current eligibility, interest terms, repayment obligations or tax treatment for any reader.
Transform Your Agribusiness
Unlock your farm's potential with expert advice tailored to your needs. Get actionable steps that drive real results.
Get Started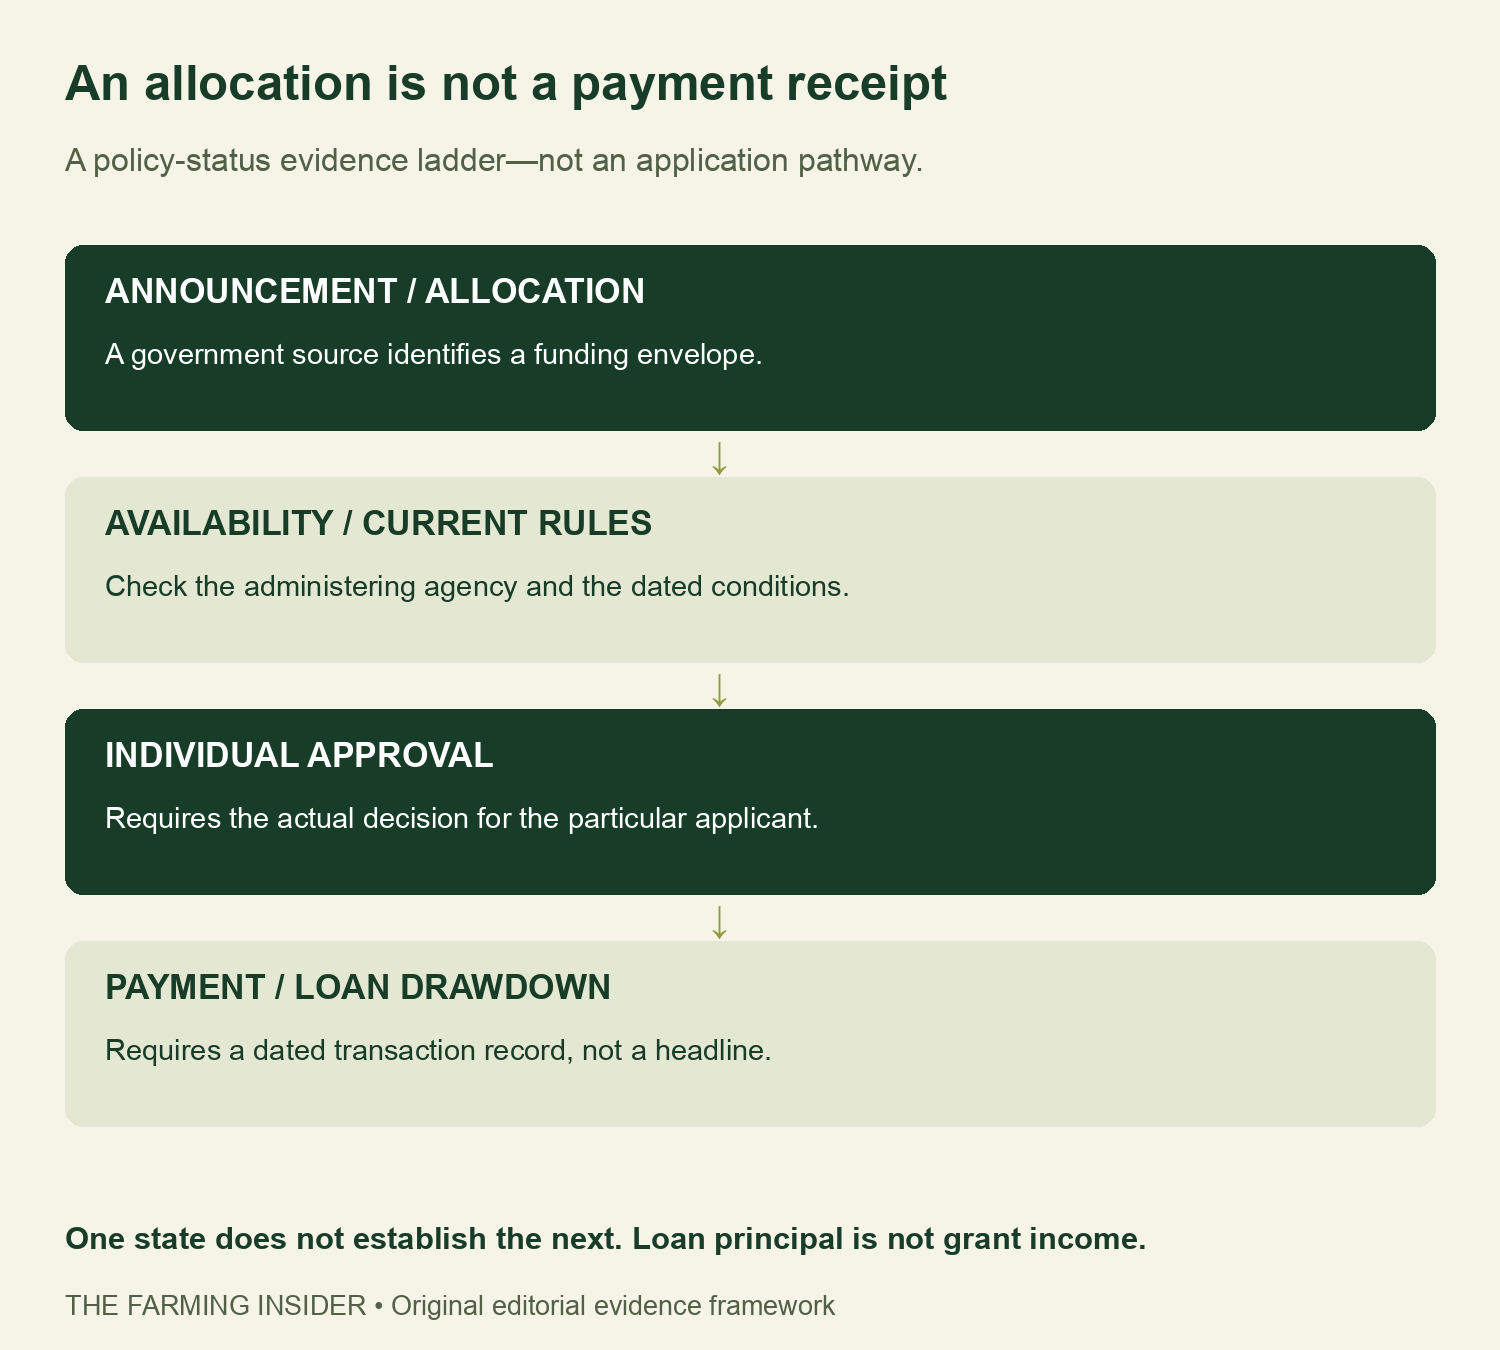
Take an evidence checklist to your adviser
For a real programme, begin with the administering agency’s current page. Record its version date and whether the instrument is a loan, grant, tax arrangement or another mechanism. Keep an unresolved-question field open when the official wording is unclear. Do not infer eligibility from a national support percentage.
Our blank discussion sheet separates rules, an application, an approval and a transaction. Store sensitive documents privately; the downloadable file contains no applicant information. Ask an appropriate adviser to interpret the particular terms before treating an uncertain amount as available business cash.
The same discipline applies to market evidence. Our peanut price-mix study separates a national average from a matching crop reference. The egg benchmark guide separates unlike transaction stages. Here the essential distinctions are denominators, dates and evidence states.
Download the indicator dictionary and discussion tools
The dictionary preserves each percentage’s basis and overlap warning. The period file contains only the two reported PSE comparisons. The funding ledger links both primary accounts of the same allocation. The adviser sheet is blank and does not evaluate an application or calculate a payment.
- Australia support indicator dictionary (CSV)
- Two-period PSE comparison (CSV)
- RIC funding evidence-status ledger (CSV)
- Blank support discussion checklist (CSV)
Methods, limitations and citation
We transcribed rounded chapter summaries, retained their stated reference periods and built the visuals from the accompanying CSVs. The period difference is a subtraction of the reported rates. We did not estimate a farm’s entitlement, allocate national support among farms or convert loan capacity into grant income.
Suggested citation: The Farming Insider (9 November 2026), “Australia Farm Support: What the OECD’s 1.8% Means.” Attribute the support estimates to OECD, Agricultural Policy Monitoring and Evaluation 2026, Australia chapter; cite the dated RIC announcement for the funding-availability statement. Charts and evidence tools are this publication’s original presentation.