





Queensland NSW rainfall figures can describe different places, periods and evidence states. ABARES’ 5 November 2026 bulletin separates rainfall already observed from a 5–12 November forecast. By this article’s 9 November date, that forecast window is partly elapsed. Treat the figures below as a dated case study, not a fresh eight-day outlook.
Featured image: AI-generated conceptual farm landscape. It does not show measured rainfall or a documented paddock in Queensland or NSW.
The practical tool is an evidence log: preserve the original regional report, check current local official information, record paddock conditions and document the operational decision. Our two original figures, explanatory infographic and four CSV downloads keep those stages distinct. No rainfall total here establishes a universal machinery-access rule.
Read Queensland NSW rainfall with the period attached
The ABARES update issued 5 November 2026 summarises the week ending 4 November as 5–100mm across Queensland cropping regions and 5–50mm in northern NSW. Its separate 5–12 November forecast gives 10–50mm and 10–25mm respectively. Those are regional bounds, not individual paddock observations or probabilities.
| Evidence state | Queensland cropping regions | Northern NSW cropping regions | Period |
|---|---|---|---|
| Observed regional summary | 5–100mm | 5–50mm | Week ending 4 November 2026 |
| Dated regional forecast | 10–50mm | 10–25mm | 5–12 November 2026 |
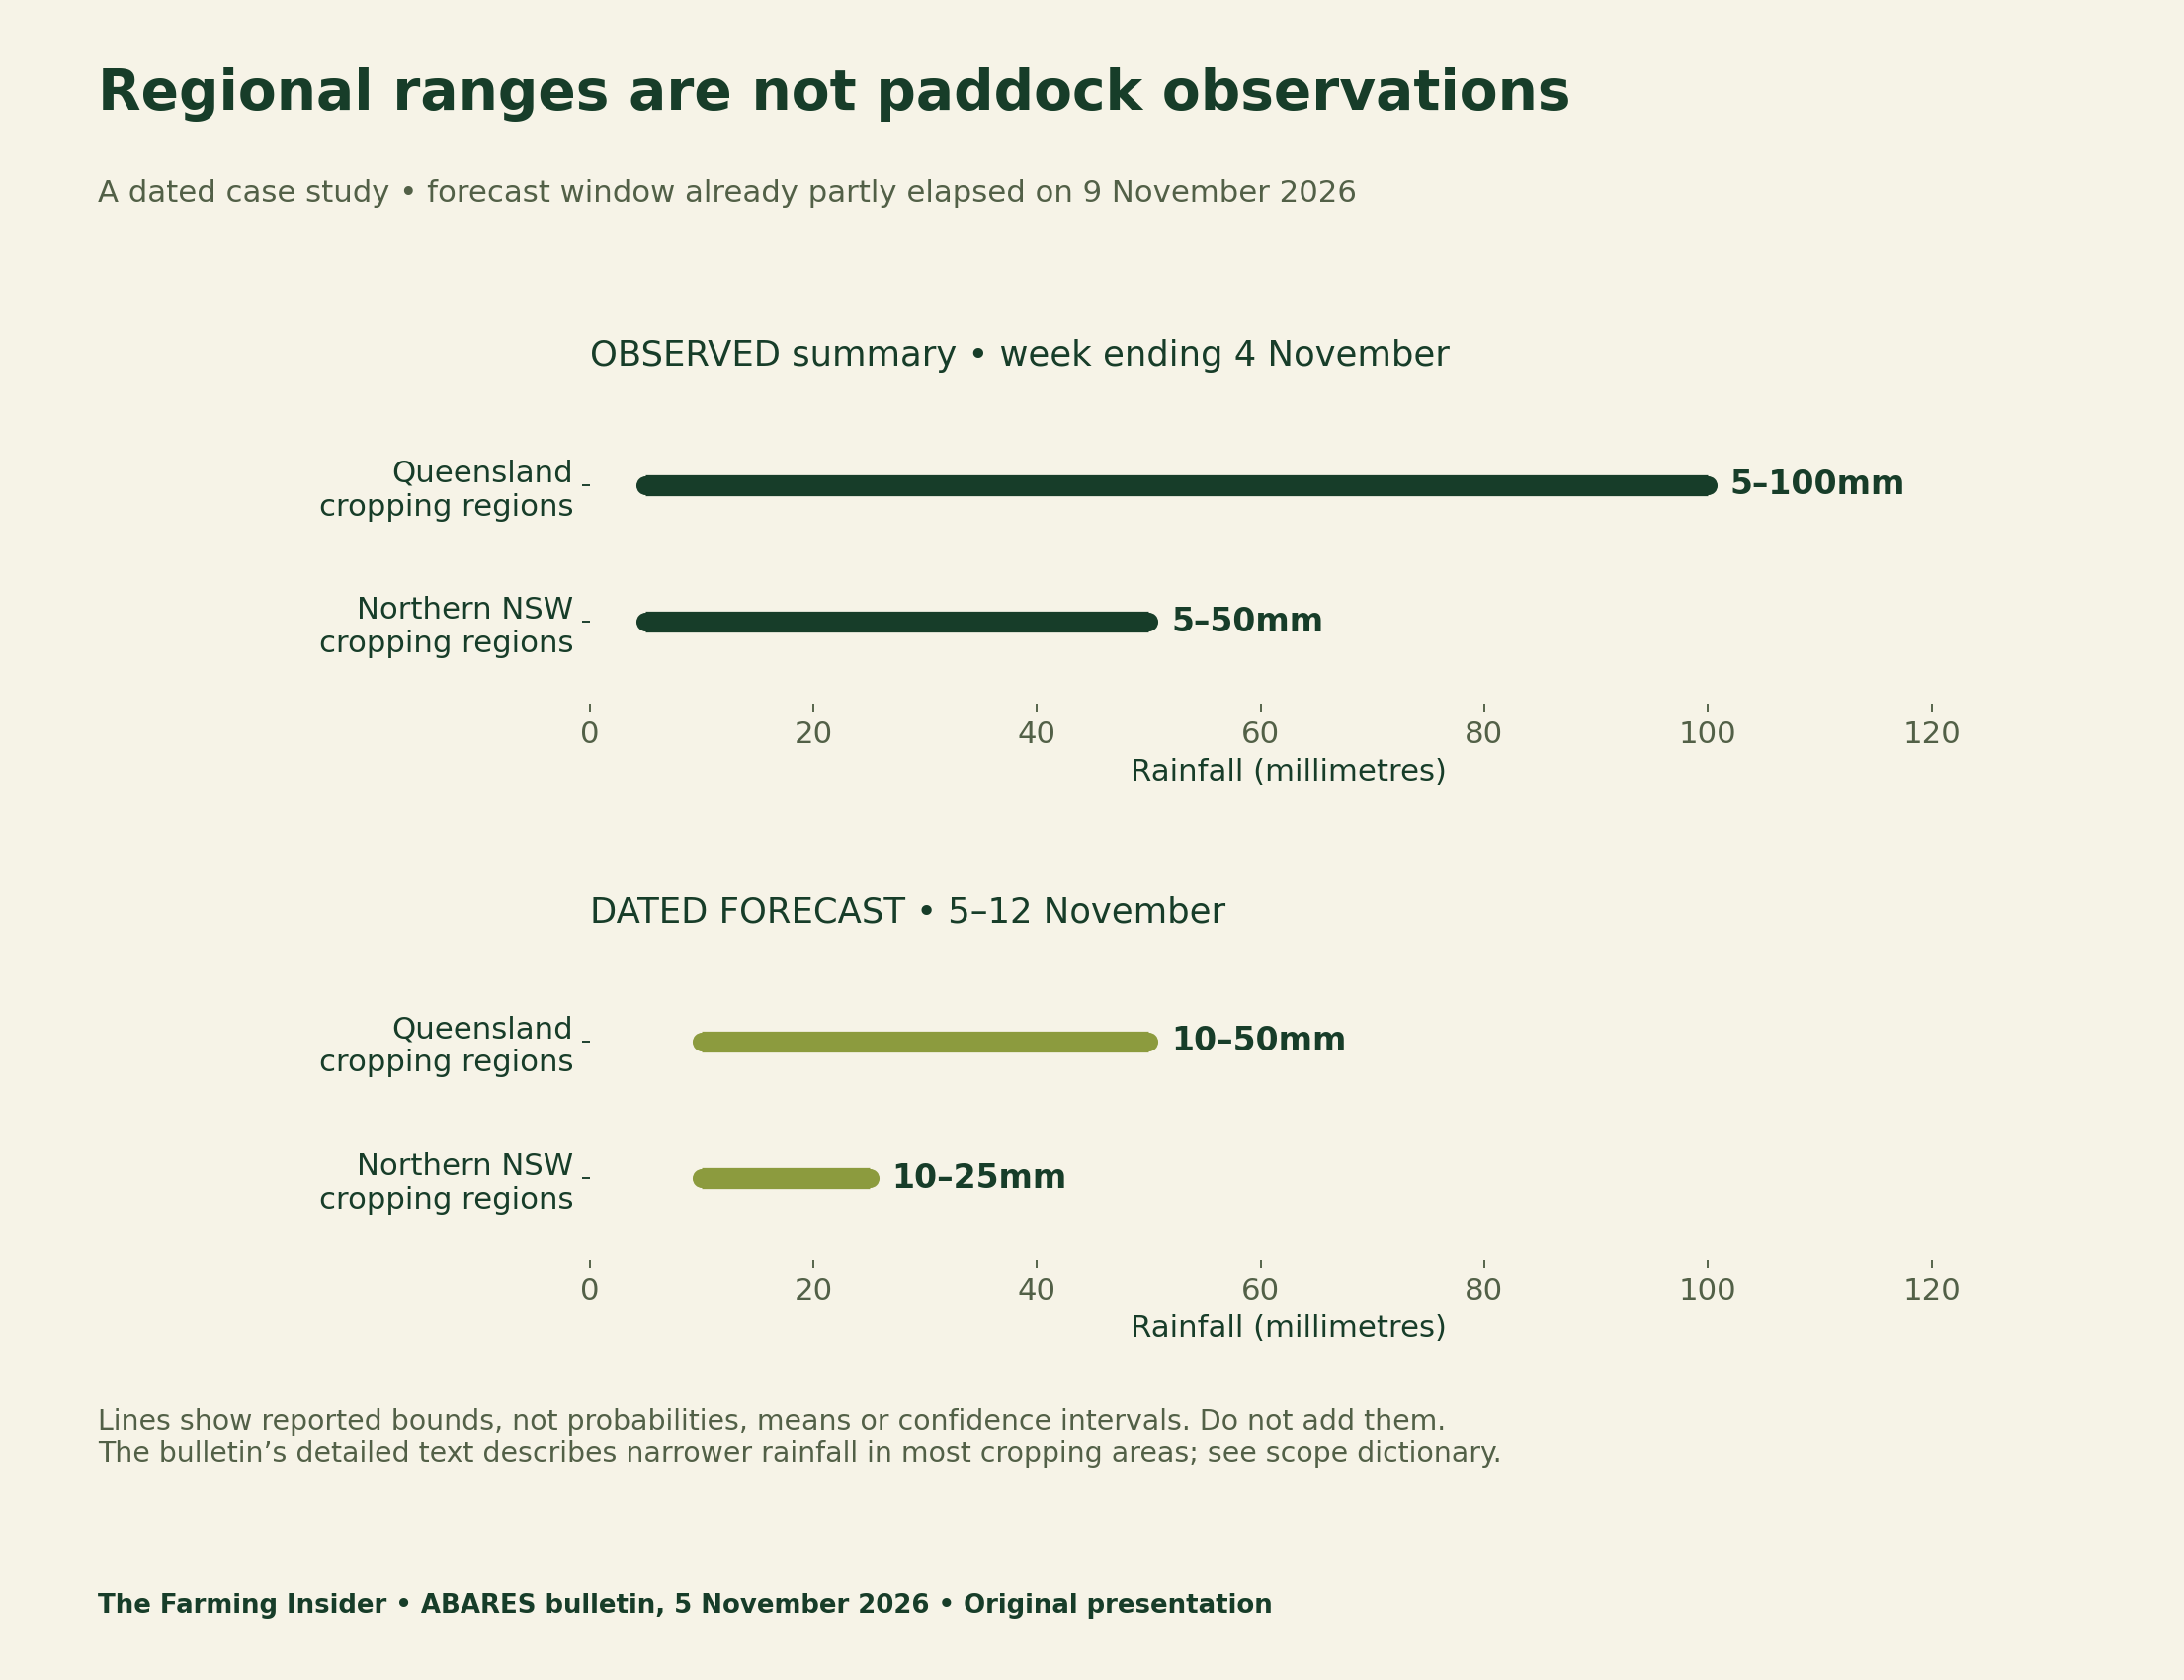
The full bulletin adds a scope qualification: its detailed observed section describes 5–50mm in most Queensland cropping regions and up to 25mm in most northern NSW areas. Keep “most areas” beside that wording. It does not supply the distribution needed to say what proportion received each amount.
Do not add ranges or calculate a farm midpoint
Adding a Queensland bound to a northern NSW bound would combine rainfall depths over different places. It would not produce a meaningful farm total. Likewise, a line spanning 5–100mm supplies no basis for calling 52.5mm a likely amount at your property. A range is not a uniform probability model.
For a local record, the gauge location, collection period and method matter. Label an amount measured on the farm as a farm observation. Do not fill a blank gauge entry with a regional maximum, a convenient midpoint or the amount predicted for another location. An unknown value should stay unknown.
Date Queensland NSW rainfall forecasts before using them
The timeline makes an easily missed distinction visible. The bulletin was issued on 5 November; its forecast remains labelled 5–12 November. Reading it on 9 November does not reset the valid window to 9–16 November. We preserve the dated version so readers can audit what was available at the time.
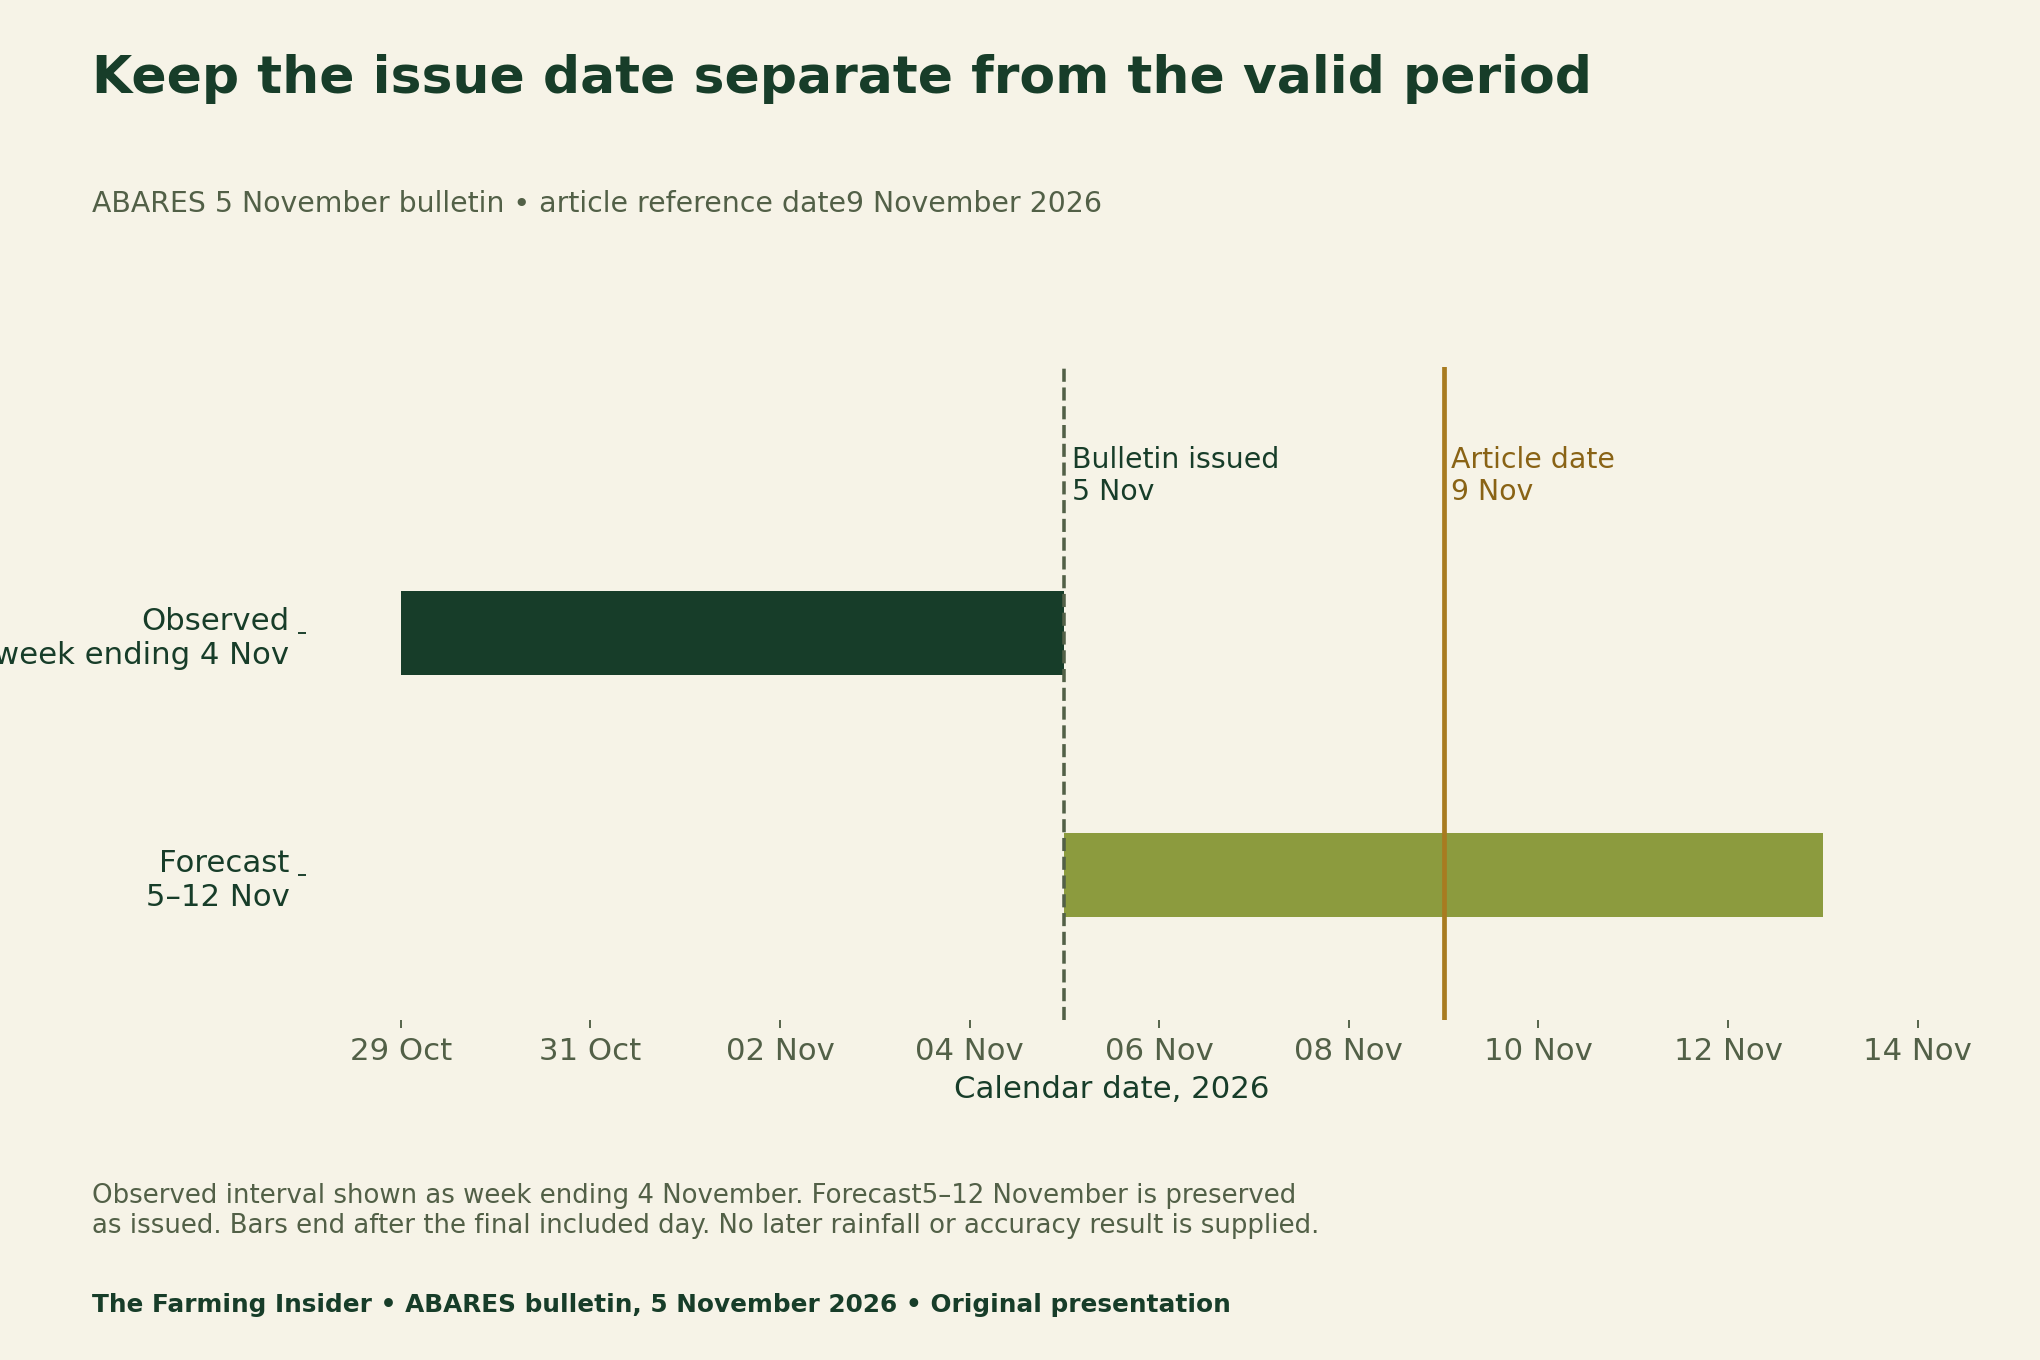
For a real decision, open the Bureau of Meteorology’s Queensland weather and warnings or NSW forecast directory, select the relevant location and check its current issue time and valid period. Review local warnings as well. This article does not certify that conditions are suitable for an operation.
The full bulletin notes that its rainfall forecast map comes from computer-model output and directs readers to local forecasts and warnings. That is another reason to preserve the map’s scope rather than turn its regional range into a property-specific instruction. We have not generated an updated weather forecast here.
One rainfall event can create different fieldwork questions
The bulletin describes potential support for summer development alongside possible delays to winter harvest and further summer planting. It also flags grain-quality downgrade risk if the additional falls occur. These are contextual risks, not measured losses or a conclusion about every crop in the region.
In a planning meeting, separate the crop already growing from the next operation you intend to perform. A moisture observation does not itself record soil access, the condition of mature grain or the equipment plan. Document those questions individually, using appropriate farm-specific agronomic advice rather than a universal cutoff invented from a news bulletin.
Keep four evidence states in the fieldwork log
Our infographic classifies records by the question they answer. A regional observation provides context. A forecast records a prediction. A paddock measurement records a local method and result. An operational decision records what was chosen with the information available. One record does not silently become another.
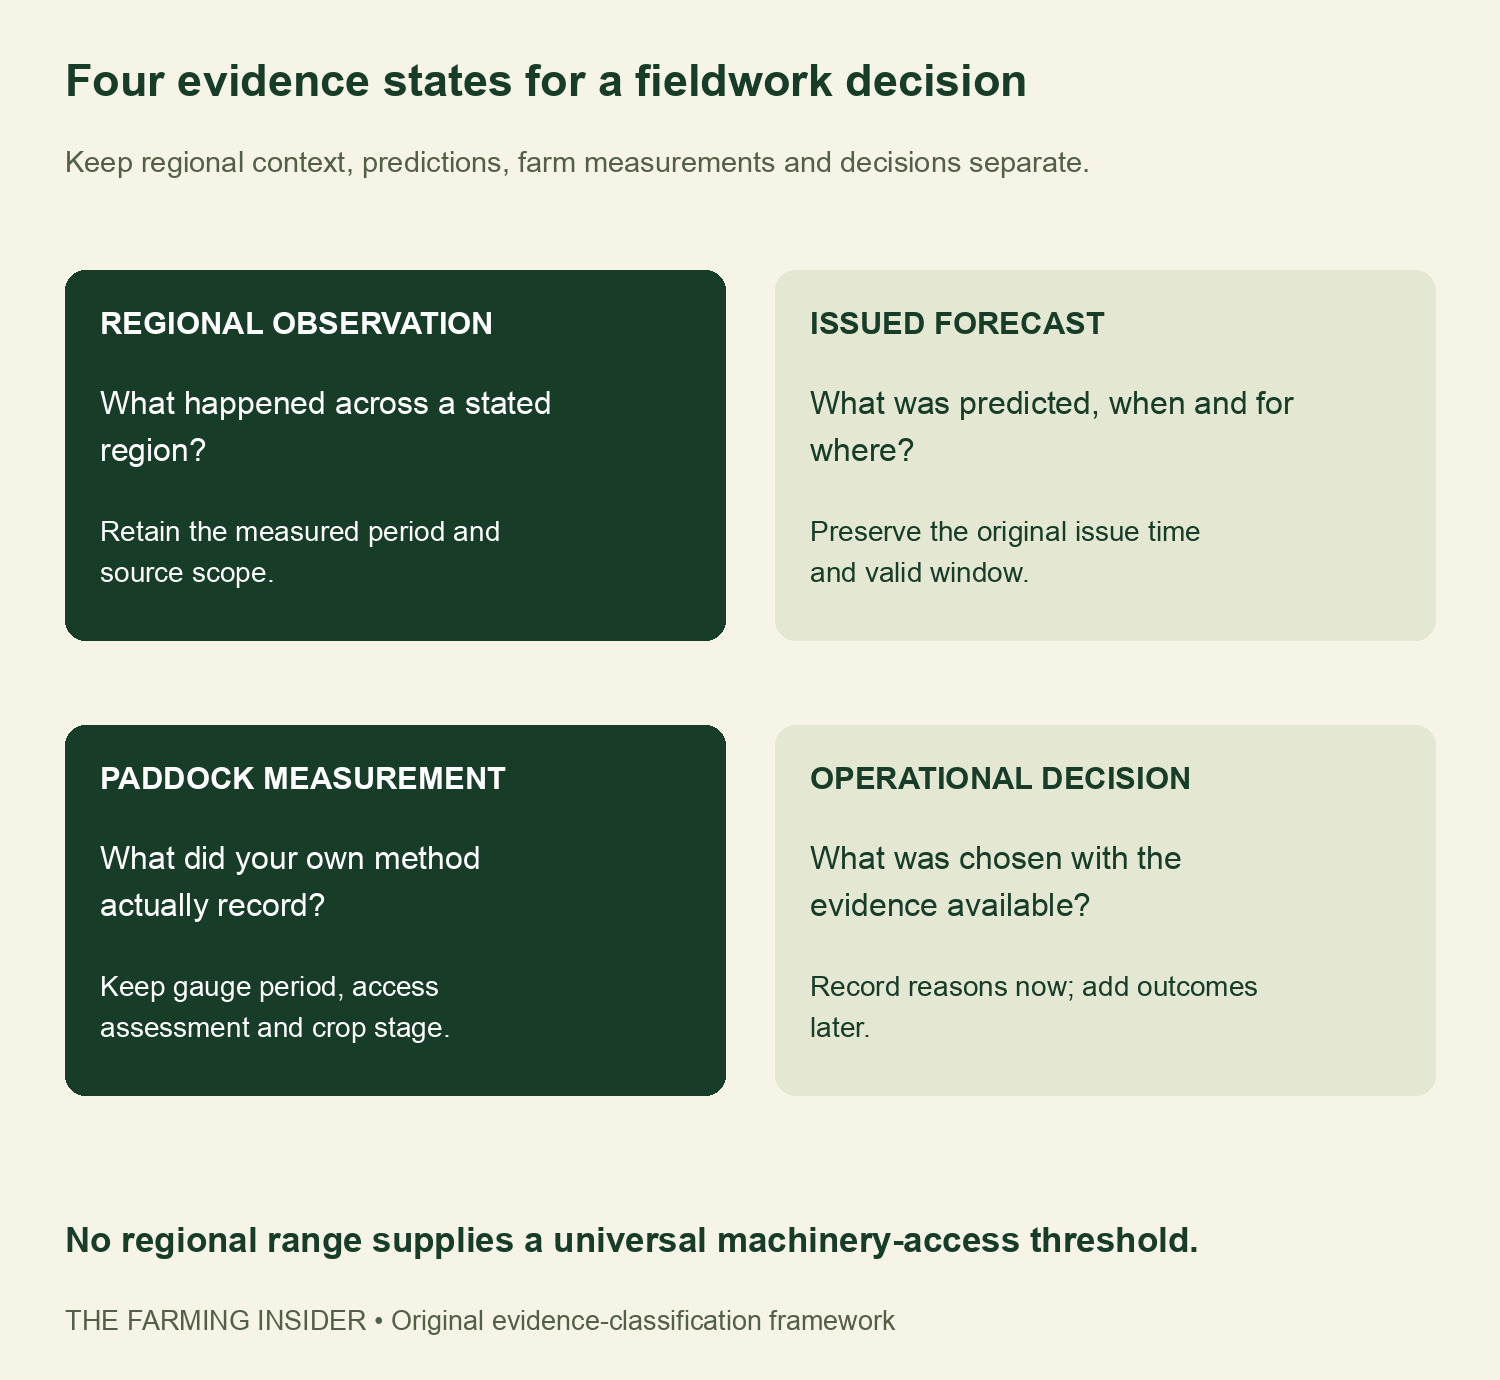
Before an assessment, leave the result blank. At the assessment, record the time, crop stage, gauge period and the relevant local checks. Record the decision and why it was made. Add later outcomes only when observed; do not backfill them as though they were known when the decision was taken.
Preserve revisions instead of overwriting a forecast
A revision register needs an original issue time, a valid period, a geographic basis and a link to the preserved version. Give a later forecast a new version identifier. Replacing the earlier file with the latest forecast makes it harder to establish what an adviser or manager actually saw.
Transform Your Agribusiness
Unlock your farm's potential with expert advice tailored to your needs. Get actionable steps that drive real results.
Get StartedComparing a forecast with later observations also requires matching the place, accumulation window, variable and measurement method. The four regional ranges here do not meet that requirement for a property-level verification. We therefore provide no accuracy score, outcome chart, avoided-loss estimate or claim that this log improves yields.
Related methods: our egg benchmark guide shows why a shared unit does not guarantee comparability. The Australian support-statistics guide separates publication dates from reference years. The same questions—what, where and when—matter for rainfall evidence.
Download the rainfall dictionary and blank fieldwork tools
The range file preserves only the source’s selected regional summaries. The scope dictionary retains the narrower “most areas” wording rather than inventing a distribution. Both operational files are blank templates. Keep farm identifiers and location details private when sharing examples with a discussion group.
- Dated Queensland and northern NSW rainfall ranges (CSV)
- Rainfall source-scope dictionary (CSV)
- Blank paddock fieldwork evidence log (CSV)
- Blank forecast revision register (CSV)
Methods, limitations and citation
We checked the dated ABARES summary and full report, transcribed bounds without averaging them and separated the observation and forecast periods. The timeline uses calendar intervals, not a simulated rainfall series. No local observations, forecasts, agronomic thresholds or crop losses were estimated for this article.
Suggested citation: The Farming Insider(9 November 2026), “Queensland NSW Rainfall: A Fieldwork Evidence Log.” Attribute the dated regional statements to ABARES, Weekly Australian Climate, Water and Agricultural Update,5 November 2026. Attribute the original figures and blank evidence tools to this analysis. Use current local official information for later decisions.