



WA crop residue emissions research raises a useful accounting question: what evidence is needed before changing a reported farm footprint? A preliminary research announcement is not, by itself, a replacement emissions factor. A smaller estimate for one category also does not imply the same percentage change in the whole farm total.
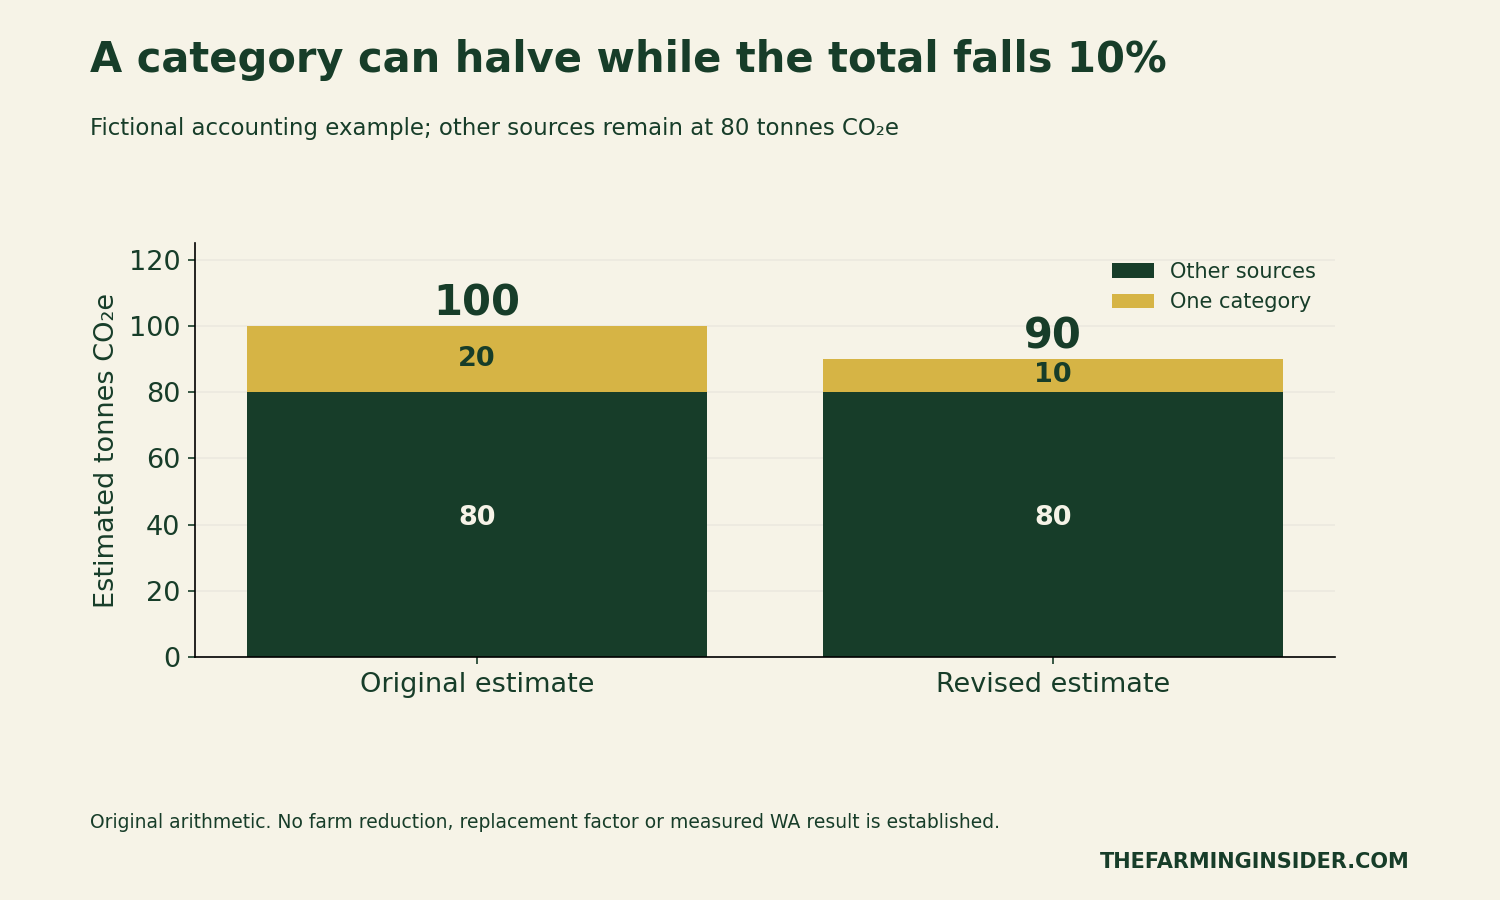
Our original example makes that distinction visible. 80 tonnes CO₂e from other sources plus 20 tonnes from one category equals 100 tonnes. Revising that category's estimate to 10 gives a total of 90. The category estimate falls by 50%, while the overall estimate falls by 10%. These are invented accounting values, not results from a WA farm or the new experiment.
What the November WA crop residue emissions update says
The DPIRD announcement dated 5 November 2026 describes Wongan Hills work within a five-experiment national project. The WA comparison covered retained and removed wheat and canola residues over two growing seasons, with root crowns remaining in both cases. Reported rain-related emission peaks lasted up to four days.
The announcement describes residue decomposition as about 20% of grain-industry on-farm emissions under current factors. However, its wording “one fourth lower” does not establish a clear denominator for an inventory recalculation. It supplies neither sufficient raw flux data nor a clearly specified replacement factor. We therefore do not convert that phrase into a verified 25% or 75% reduction, or calculate a new national factor.
This leaves a narrower, answerable task: build a ledger that separates activity, factor, calculation method and change history. That structure helps a reader identify which evidence would support a revised estimate, without pretending that missing data are already available.
A category change and a total change have different denominators
In the fictional example, the original category estimate is 20 tonnes CO₂e. Its revised value is 10, so its decrease is 10 ÷ 20 = 50%. By contrast, the total starts at 100 and falls to 90, so its decrease is 10 ÷ 100 = 10%.
The other 80 tonnes remain unchanged. This assumption matters: if another category changes too, recalculate the total rather than applying this shortcut. Also keep the reporting period, organisational boundary and measurement units consistent between versions.
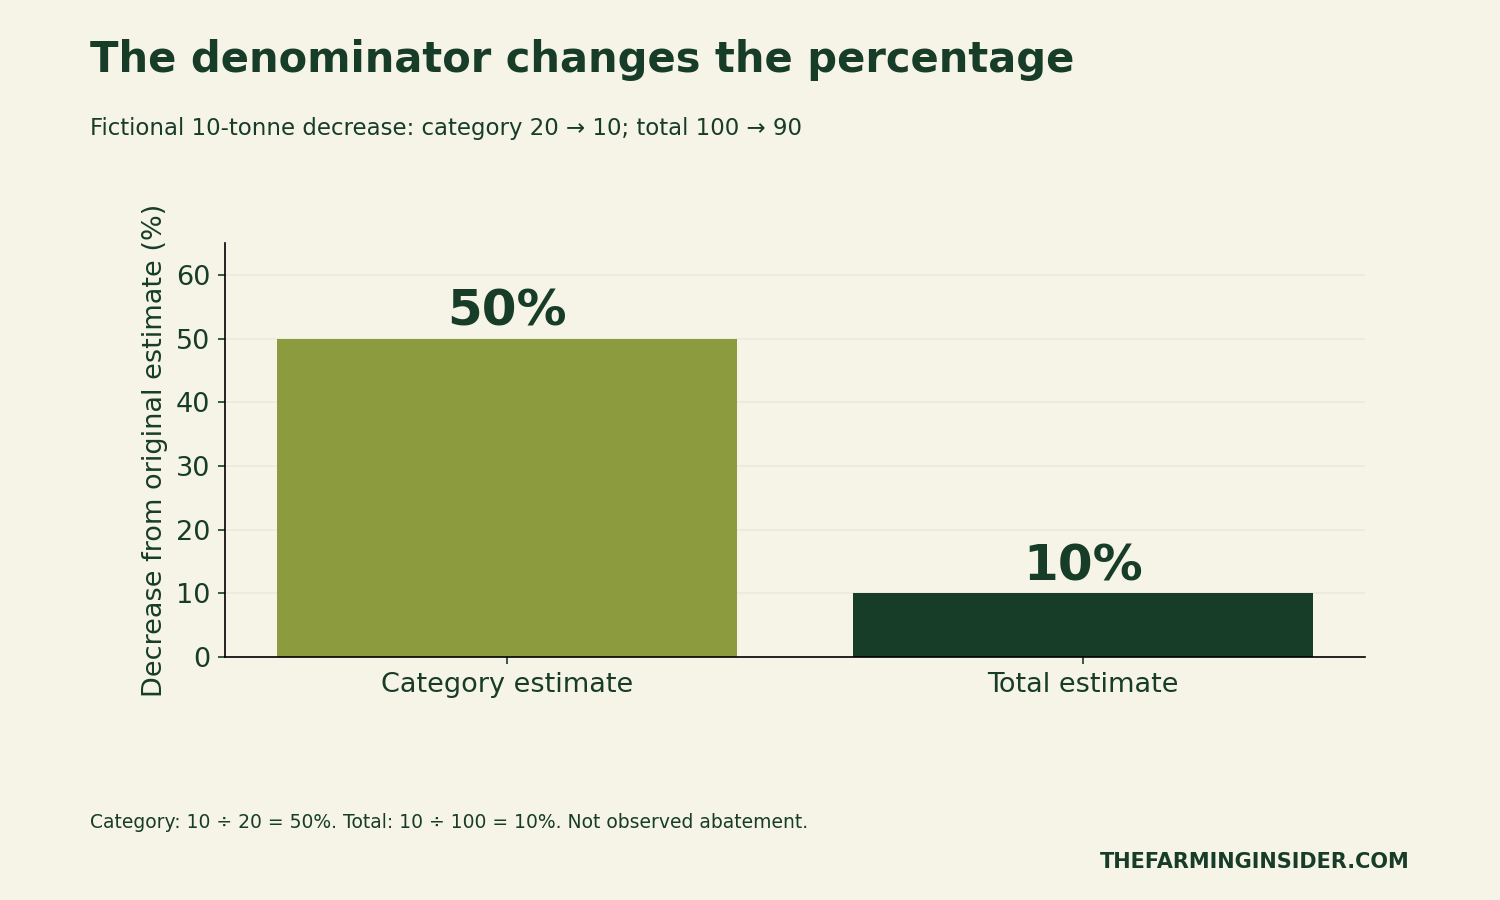
For clear reporting, name the denominator in the sentence. “The category estimate decreased by half” says something different from “the farm reduced emissions by half”. The latter also introduces a claim about what physically happened, which a method-only recalculation cannot establish.
The starting share limits the effect on the total
Suppose only one category changes. Its contribution to the percentage change in the total equals its original share of that total multiplied by its own proportional change. Thus, a 20% starting share multiplied by a 50% category decrease gives a 10% total decrease.
This relation is useful for checking a headline. For example, if a category initially represents 5% of a total, removing its entire estimated contribution would reduce that total by 5%, with every other component fixed. It would not reduce the total by 100%.
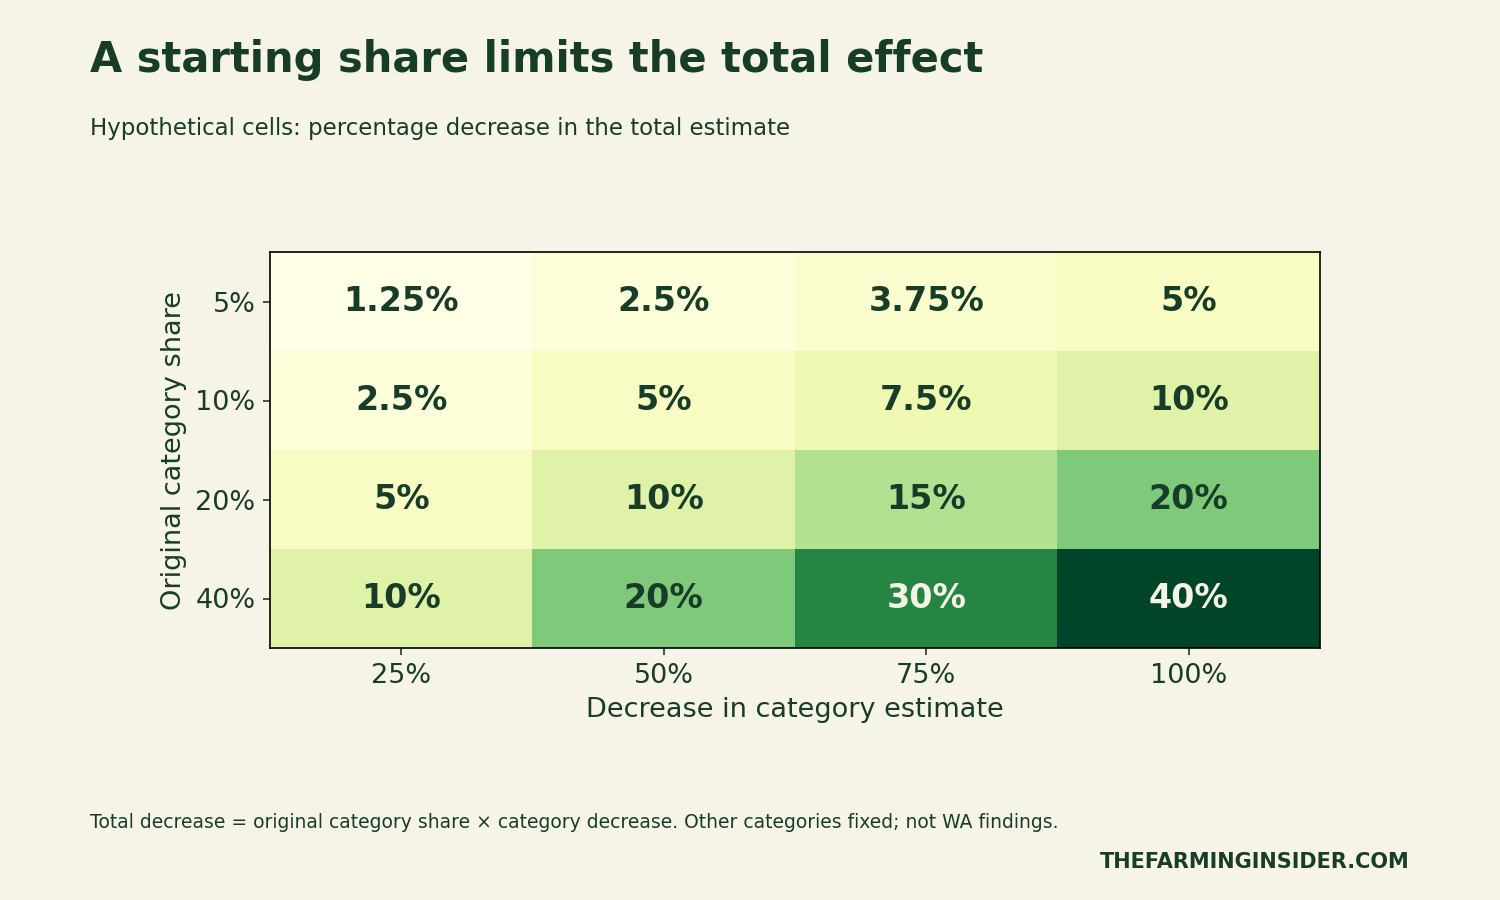
The matrix does not resolve the announcement's ambiguous wording. Its input percentages are deliberately independent examples. No cell should be selected as the new WA result without the underlying factor, boundary and method evidence.
Separate a factor revision from a management change
An activity-based estimate commonly combines an activity quantity and a compatible emissions factor. The units must cancel to the intended emissions unit. A factor reported per unit of one activity cannot simply be attached to a different activity record.
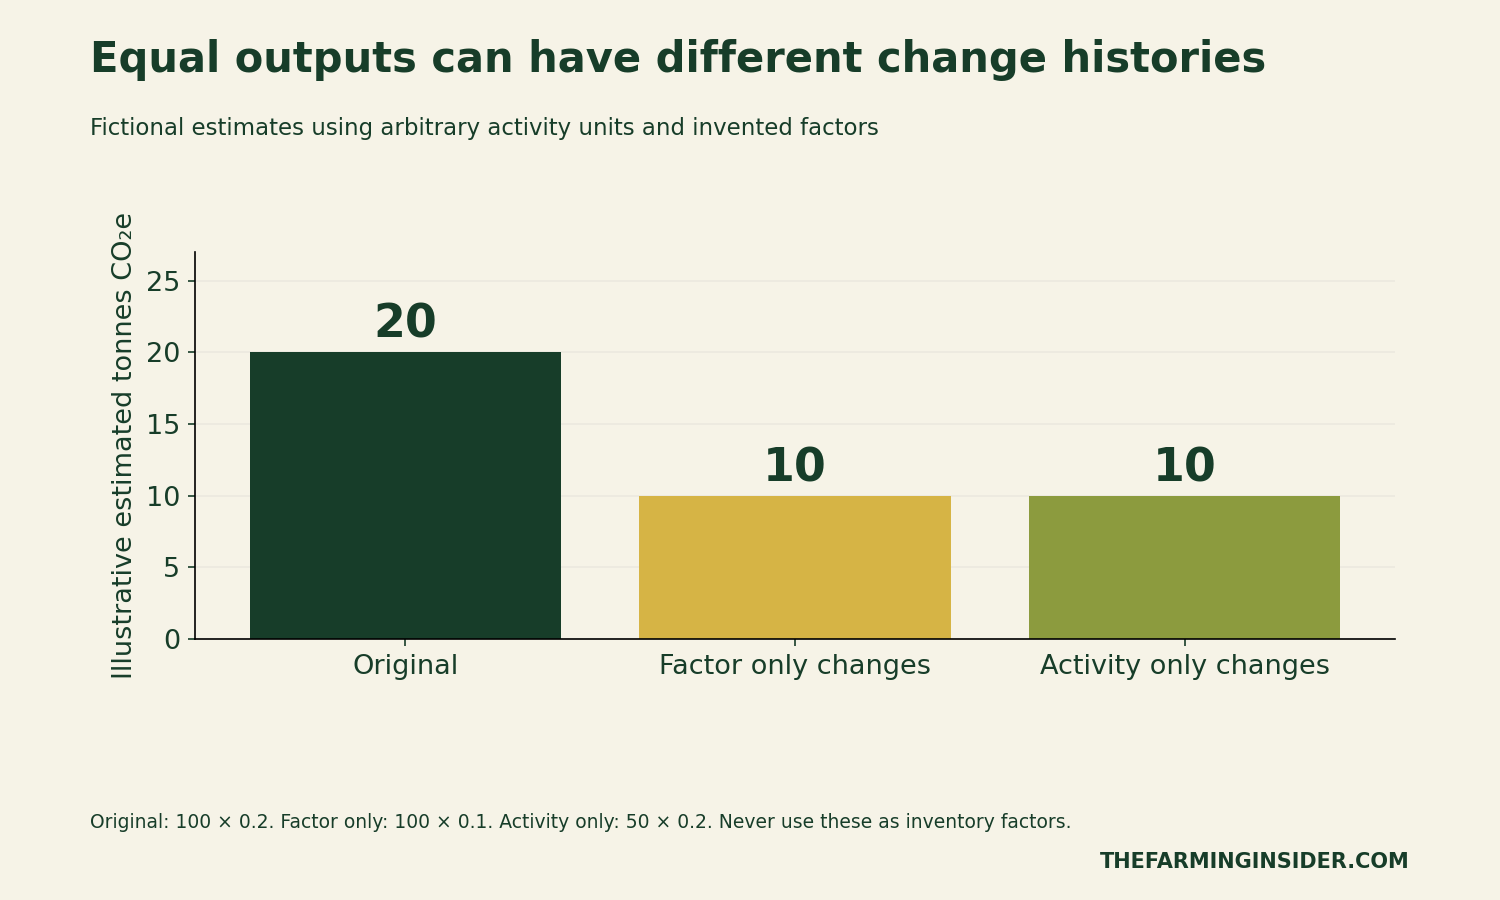
Our simplified fictional ledger uses 100 arbitrary activity units and a factor of 0.2 tonnes CO₂e per activity unit. Their product is 20 tonnes CO₂e. Changing only the factor to 0.1 changes the calculated estimate to 10. Activity is unchanged in that scenario, so describe the difference as a recalculated estimate.
Alternatively, a fictional activity quantity of 50 with the original factor of 0.2 also produces 10. The arithmetic output is the same, but the change history is different. Neither scenario proves an actual reduction or supplies a real residue-decomposition factor.
Short events need dated observations
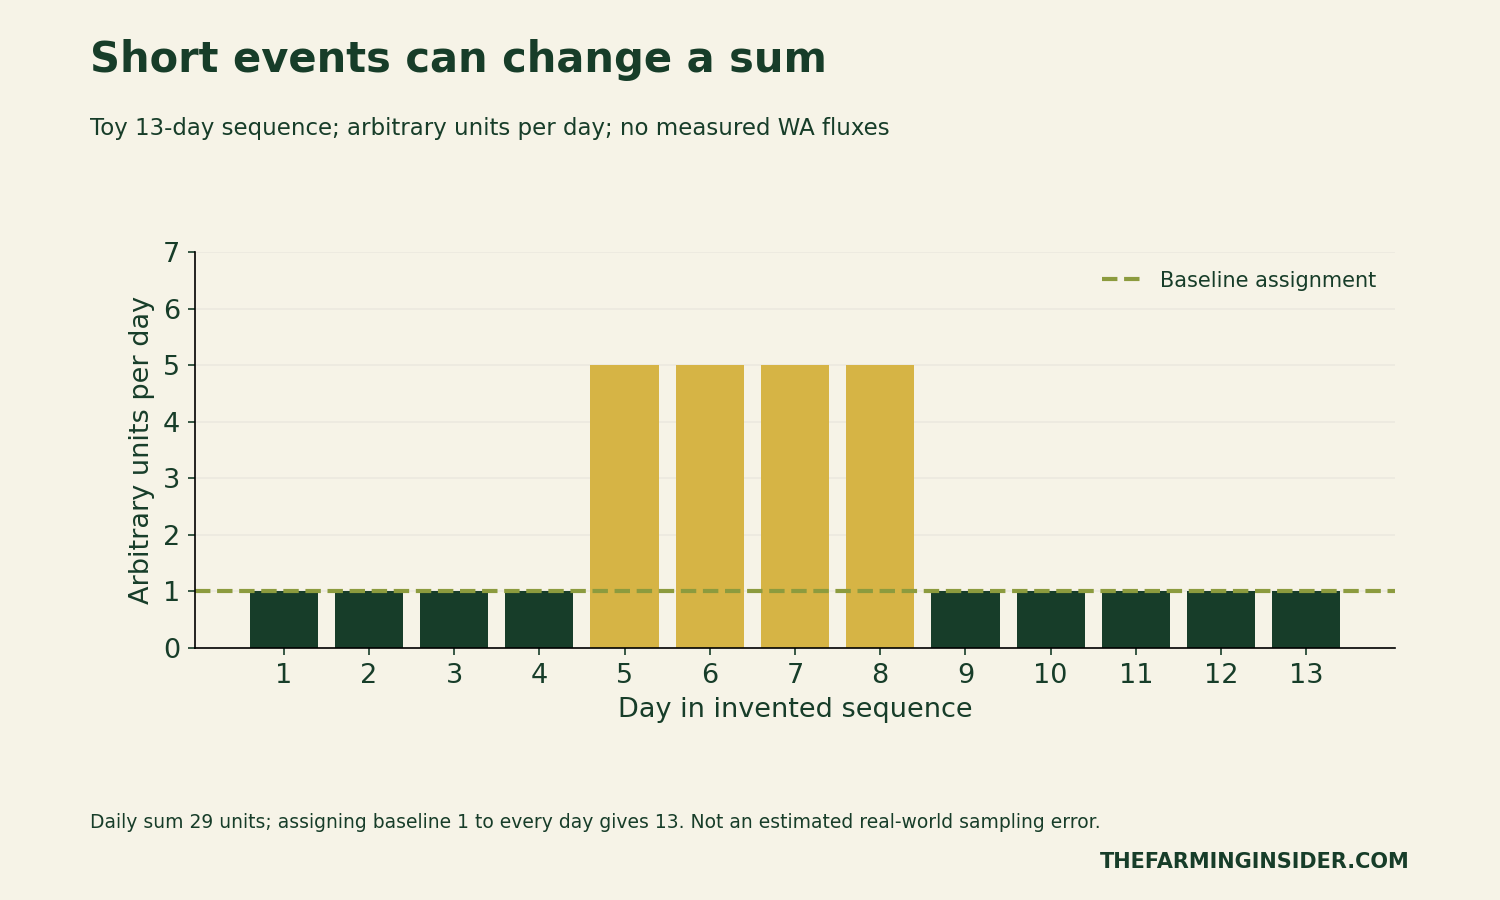
The sampling issue is separate from the inventory-factor issue. An observation taken between short events cannot, by itself, describe the entire reporting period. To explain the arithmetic, Figure 5 uses a toy sequence of 13 days: nine at 1 arbitrary unit per day and four at 5.
Transform Your Agribusiness
Unlock your farm's potential with expert advice tailored to your needs. Get actionable steps that drive real results.
Get StartedThe daily sum is 29 arbitrary units. Applying the baseline value of 1 to all 13 days would give 13, missing 16 units in this invented sequence. This is not an estimate of bias in the WA study, a reconstructed flux curve or an annual emissions result.
For a real record, retain measurement dates, the integration method and the relevant event context. Ask how gaps were treated and whether the reported time window captures the processes of interest. A graph of an invented event cannot fill a gap in the experimental dataset.
A versioned ledger for WA crop residue emissions
Record the activity description and units, factor value and units, geography, method version, source and effective date. Then add the reason for a revision. Was the activity corrected, the factor updated, the reporting boundary changed or a documented management change introduced?
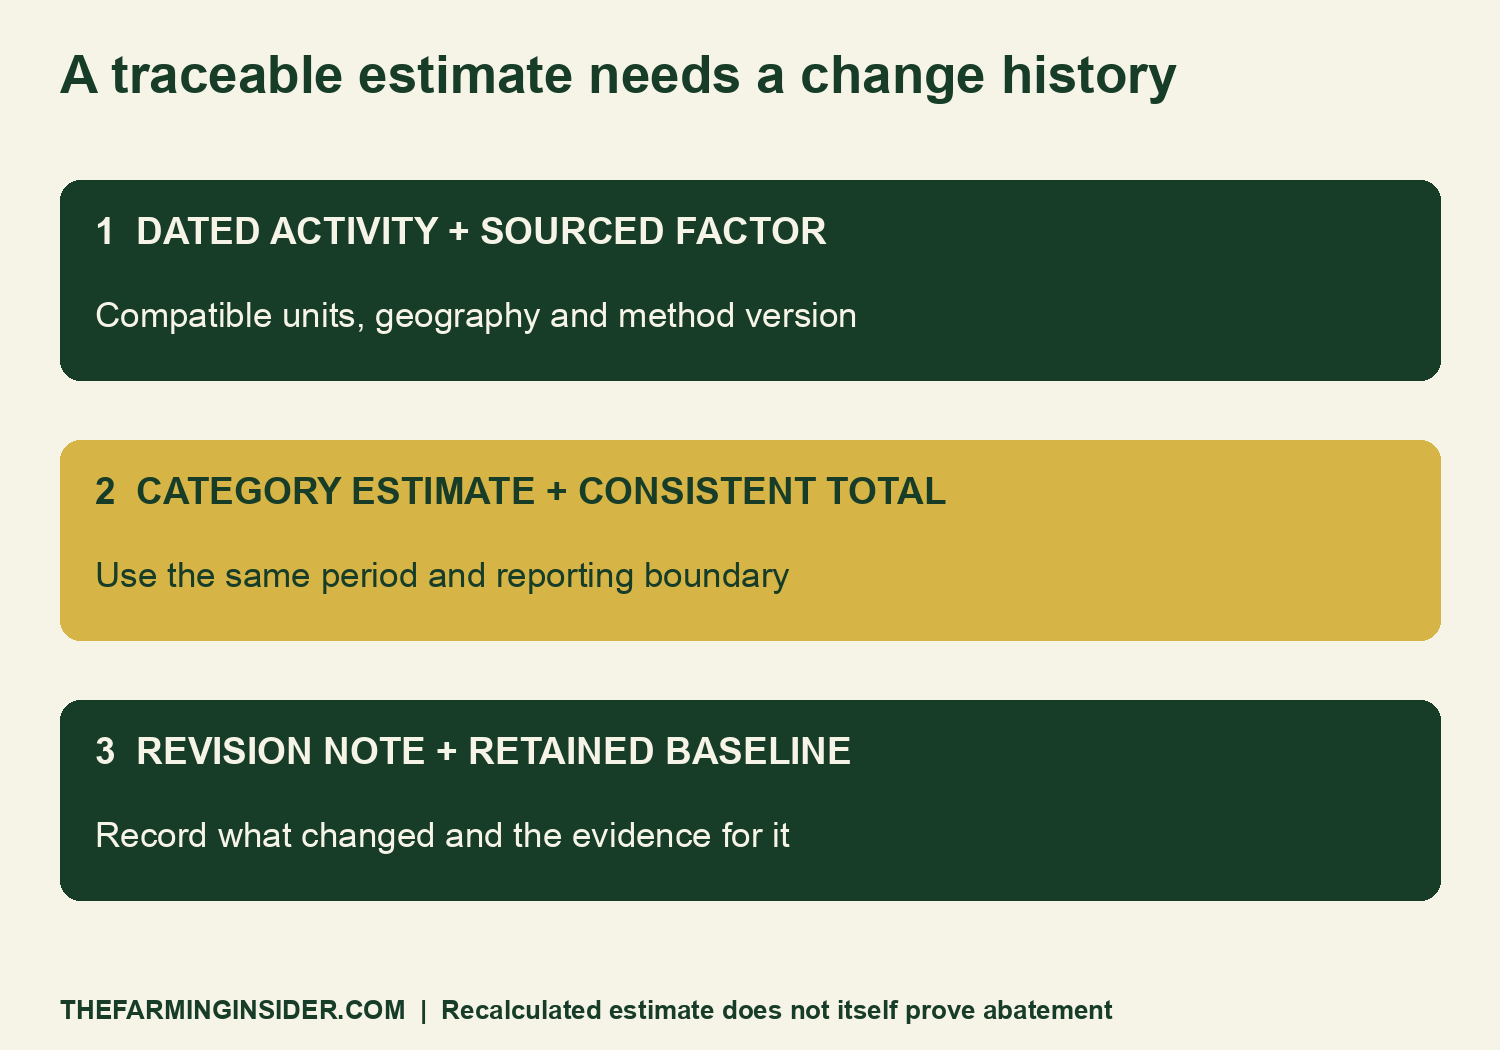
Keep both the original and revised versions. In addition, note whether a historical baseline was recalculated on the same basis. Otherwise, a reader may compare two totals that differ because of methods rather than operations.
Download four original CSV tools
- Fictional denominator and share scenarios (CSV) reproduces the total and category comparisons in Figures 1–3.
- Fictional activity-versus-factor examples (CSV) separates the two illustrative change paths in Figure 4.
- Toy event-sampling sequence (CSV) provides the invented daily values used in Figure 5.
- Blank emissions-factor provenance ledger (CSV) records units, source, jurisdiction, version, boundary and revision reason.
These are plain CSV files without macros or embedded formulas. The worked values are fictional and the ledger supplies no replacement factor. Leave an unknown factor blank instead of copying an illustrative number into a farm inventory.
Our grapevine soil-water unit guide shows why compatible definitions matter in another agricultural calculation. The deep-liming evidence guide similarly separates an early research observation from a later business outcome.
Methods, limitations and citation
We checked the linked DPIRD release on 6 November 2026. This article combines a limited factual reading of that announcement with original accounting illustrations. We did not analyse raw flux observations, estimate a replacement emissions factor or reproduce an annual inventory.
All chart calculations are independently reproducible from the supplied fictional data. The sensitivity assumes unchanged other categories. The activity examples omit the additional inputs that a real applicable method may require. The toy sequence uses arbitrary units and does not represent measured emissions.
Nothing here establishes carbon-credit entitlement, a national accounting change, a farm-level emissions reduction or a reason to remove residue. Before revising a reported footprint, obtain the applicable current method and supporting evidence, and have the calculation checked by an appropriately qualified agricultural emissions adviser.
Suggested citation: The Farming Insider (6 November 2026), “WA Crop Residue Emissions: Check the Factor First”, original denominator, change-history and sampling illustrations with CSV tools. Cite DPIRD separately for the preliminary Wongan Hills research announcement.