




Kansas sorghum harvest late tillers can leave mature main heads beside green, immature heads. The useful first step is to record the two groups separately. A whole-field impression cannot tell a grower how much wet grain each group contributes, or whether waiting changes the position of the mature crop.
A K-State Extension advisory published on 19 November 2026 describes late heads in parts of central and southern Kansas. Our report turns that sampling problem into a blank field card and a clearly fictional moisture calculation. Two charts and four CSV tools show why head counts, wet-mass shares and moisture percentages answer different questions.
Kansas sorghum harvest late tillers: separate the observations
The advisory describes some heads emerging four to six weeks after the main crop. That observation does not estimate how common the problem is statewide. It is a reason to inspect the relevant field zones and distinguish main-head maturity from late-tiller maturity, rather than attach one development stage to the entire field.
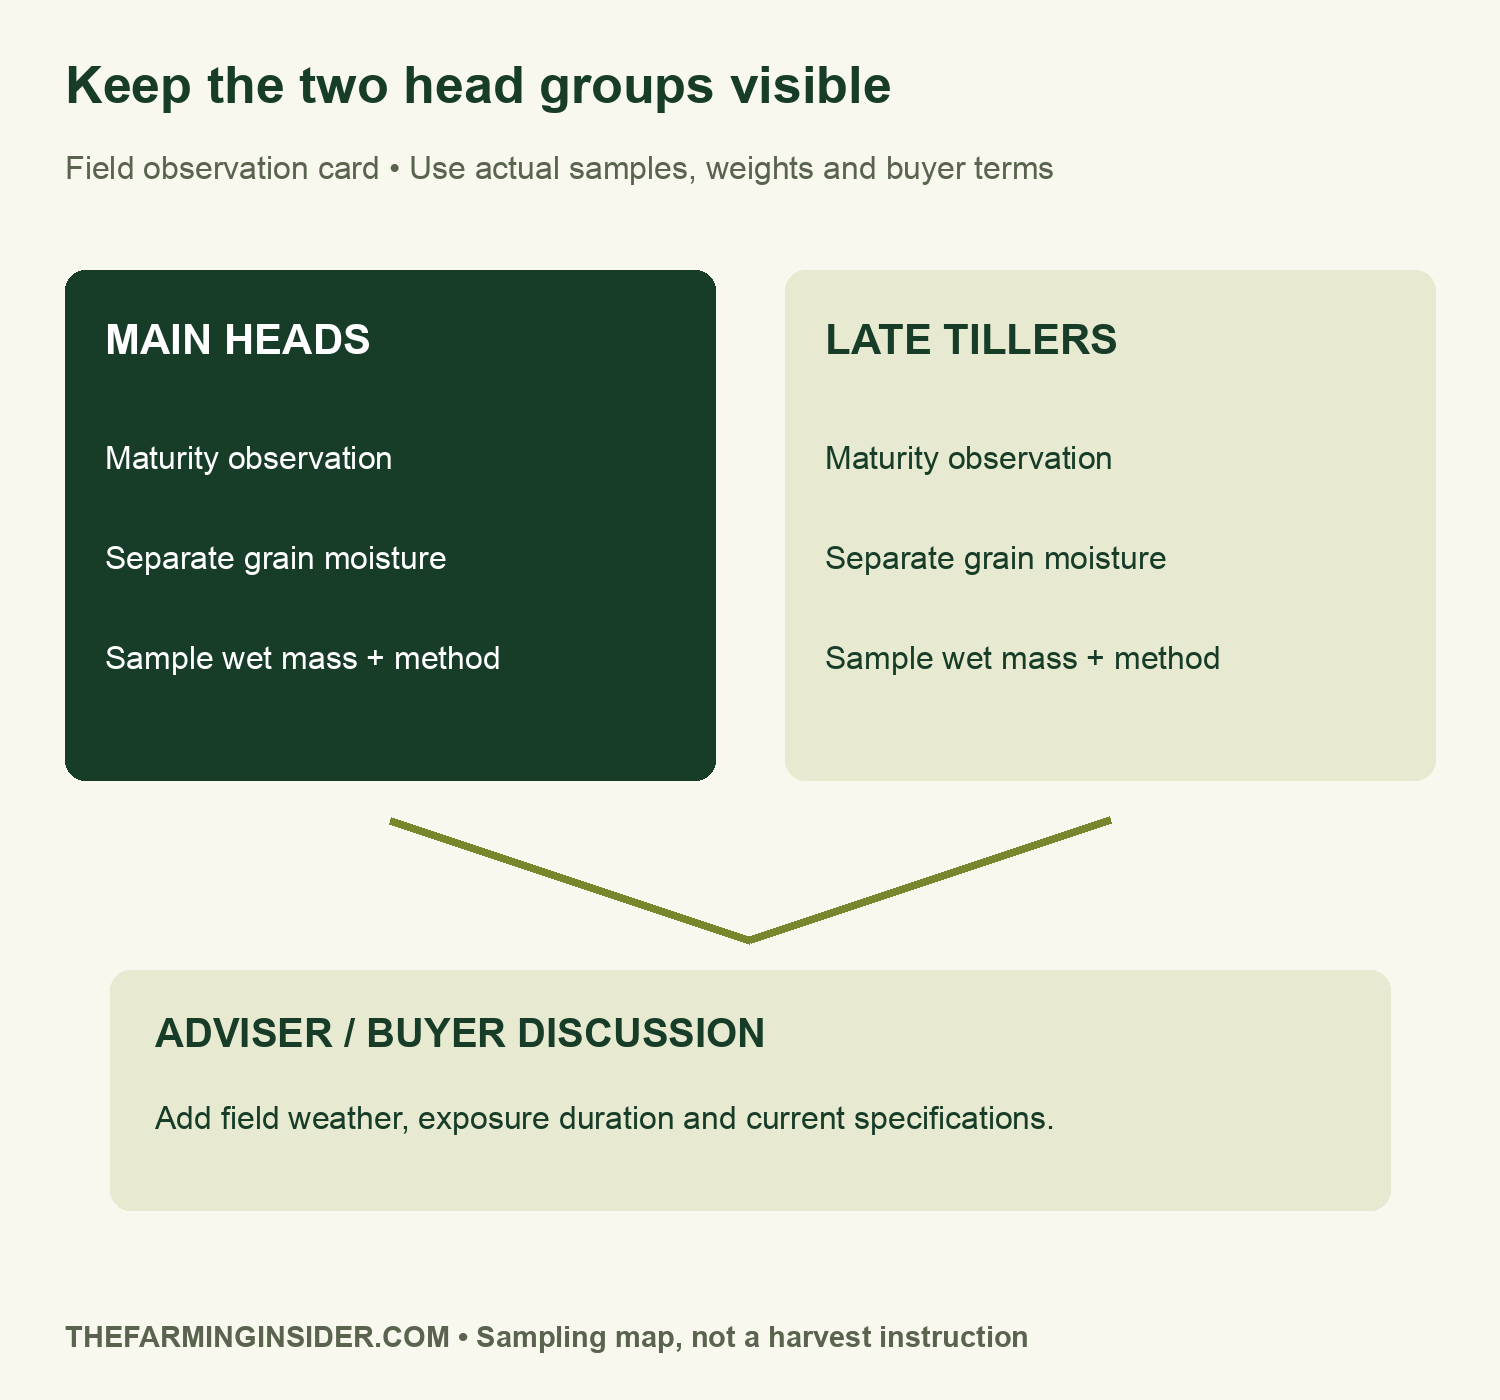
Use separate rows for the two groups in the field card. Record the observation date, zone, sampling method and moisture reading. Add the wet mass of each grain sample if you plan to calculate a mixture. Keep an uncertain or missing measurement blank; a visual impression of green material does not supply a grain-moisture percentage.
Freeze exposure needs more than a nearby minimum temperature
K-State distinguishes light freezes around 30–32°F from its research finding that 28°F or lower for at least two hours can severely damage grain filling. It also identifies canopy conditions and exposure duration as relevant. Those examples are context for an assessment, not a universal temperature switch that settles every field decision.
Record where a weather reading came from and whether it represents conditions in the crop. A distant station minimum cannot establish the duration or severity experienced by a particular head. Keep weather evidence alongside maturity observations, and discuss uncertainty with the local extension adviser. Do not turn a forecast minimum into a measured field exposure.
This article concerns grain sampling and the information needed for harvest discussions. It does not assess forage or livestock safety. Where grazing or forage use is being considered, use the specialist resources linked by K-State and obtain appropriate local advice. The grain-moisture examples below do not answer those separate questions.
Late tillers in Kansas sorghum: use wet-mass weights
Suppose a fictional lot contains 80 kg of main-head grain at 14% moisture and 20 kg of late-head grain at 24%, both on a wet basis. The first component contains 11.2 kg of water and the second 4.8 kg. Together they contain 16 kg of water in 100 kg of wet grain, giving 16% combined moisture.
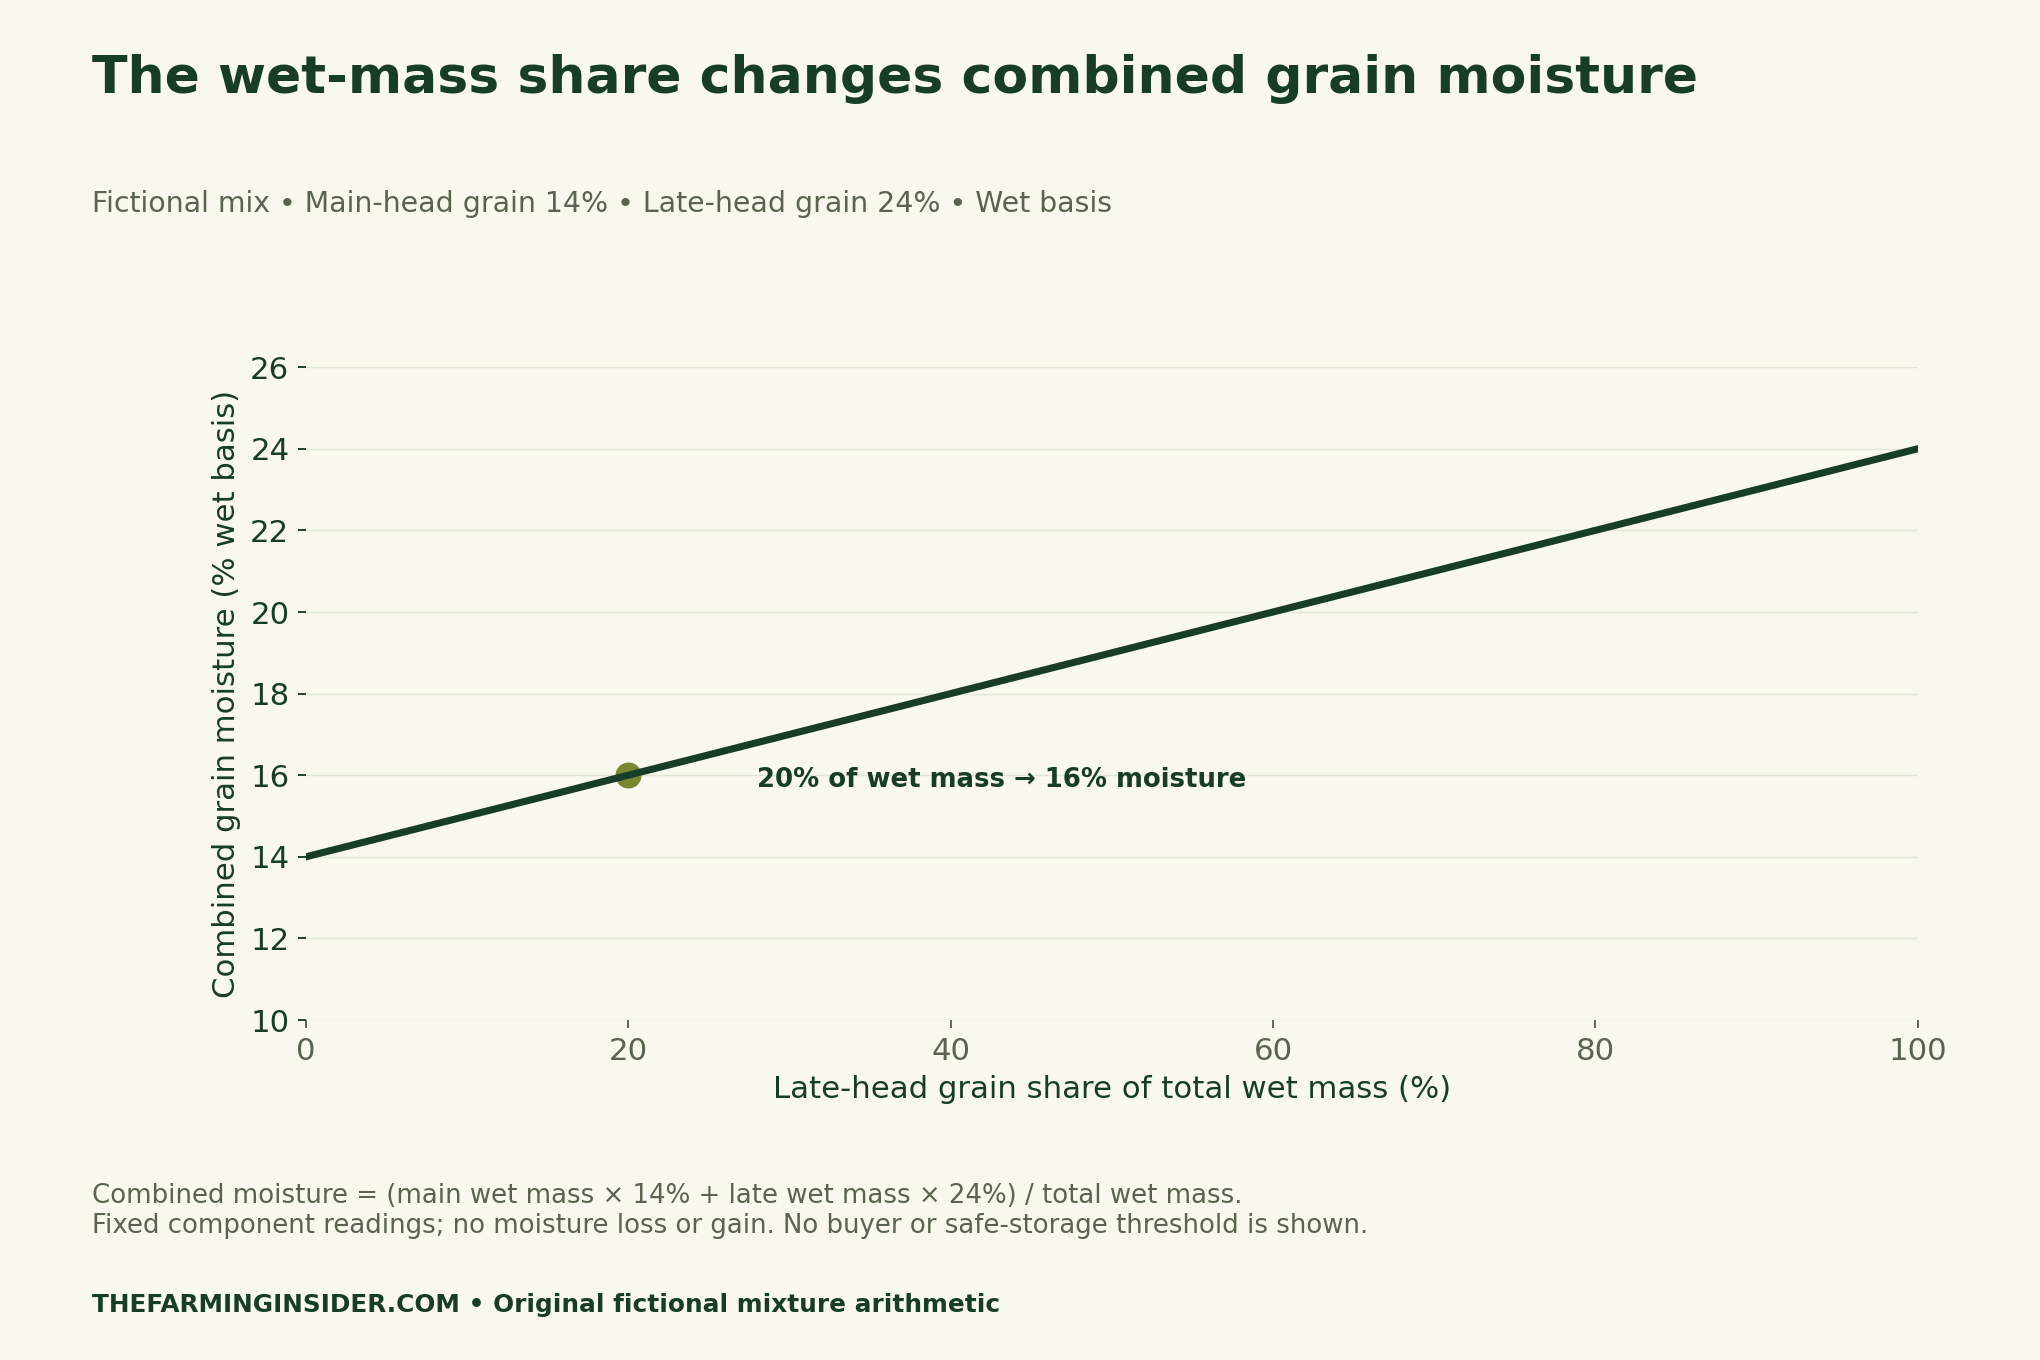
The calculation is (80 × 0.14 + 20 × 0.24) ÷ 100 = 0.16. It assumes no moisture loss or gain while mixing. These are invented masses and readings, not Kansas field observations. The 16% result is an arithmetic output, not evidence that a lot meets a buyer specification or can be stored safely.
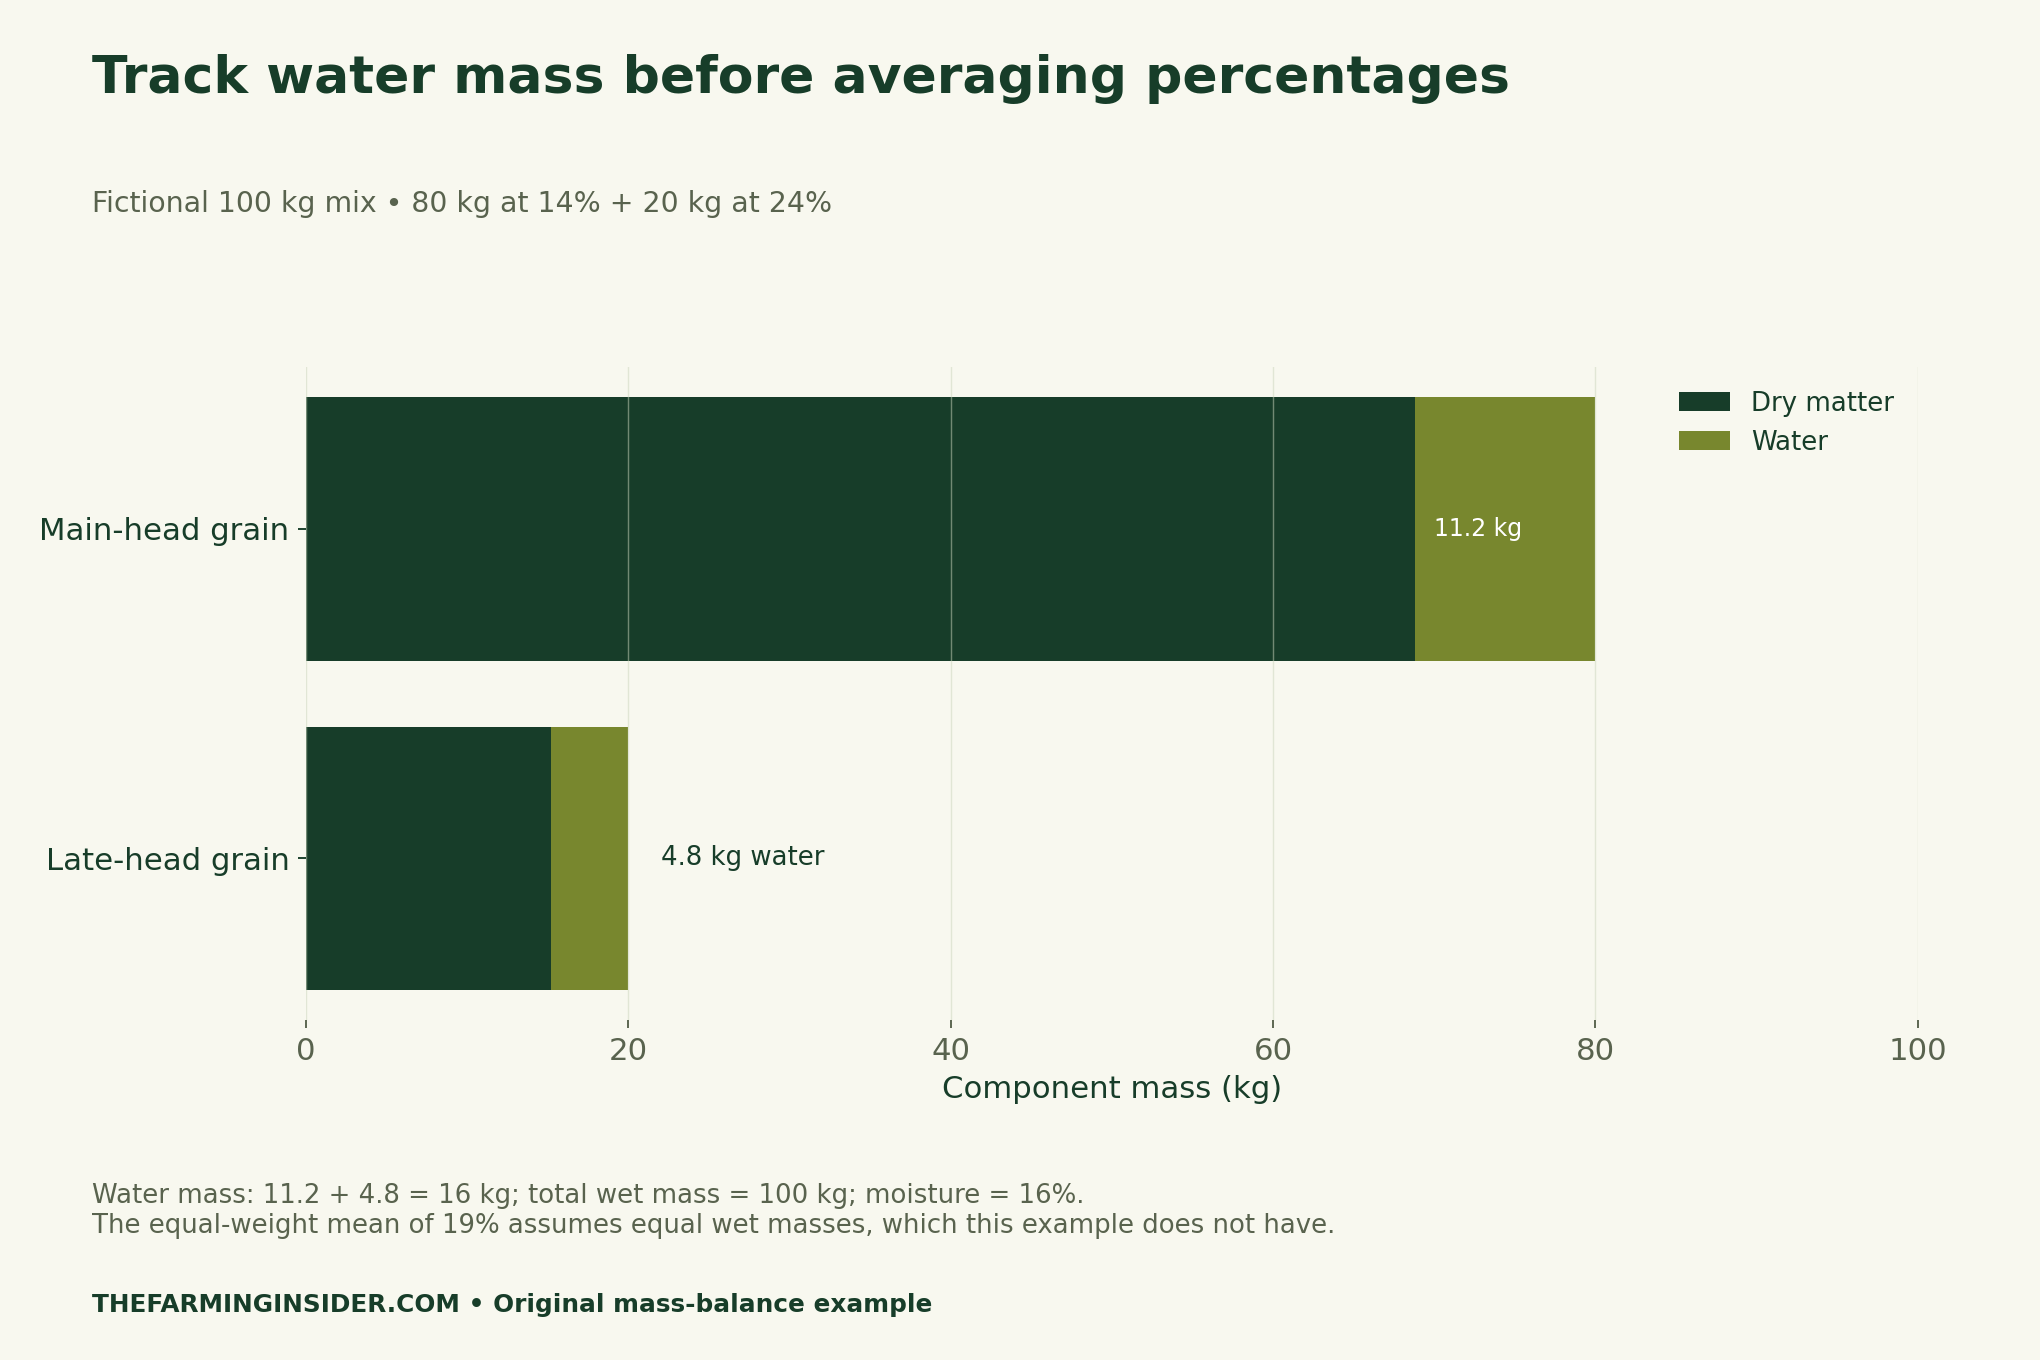
A simple average of 14% and 24% gives 19%. That describes an equal-wet-mass mixture under the same assumptions, not our 80:20 mix. Giving each reading equal weight silently changes the question. Likewise, counting one main head and one late head does not show that they contribute equal grain mass.
Check what a combined sample can and cannot describe
A measured composite can describe the sample tested, subject to the sampling method and instrument. It does not necessarily describe every area of a variable field. Retain the separate observations so an adviser can see whether a combined result conceals different maturity or moisture conditions. Keep the sampling limitations with the result when sharing it.
Our sensitivity CSV fixes the two component readings at 14% and 24%, then varies only the late-head share of wet mass. At a 50% share, the calculation gives 19%; at 20%, it gives 16%. A real field may have different readings and changing conditions, so replace assumptions with measurements rather than treating the curve as a forecast.
Take documented questions to the buyer and adviser
Ask which grain specifications apply to the intended delivery and how the buyer wants a representative sample taken. Record the source and date of those terms. Separately, ask the adviser how the main crop’s maturity, late growth and weather exposure affect the local discussion. Neither answer can be inferred from our fictional moisture line.
The blank card leaves space for those questions and the evidence still needed. It supplies no machinery operating settings, harvest-aid instructions or universal delay rule. The practical value is a clearer handover: which head group was observed, which sample was measured, what mass was used and what remains uncertain.
Methods, limits and reusable files
We used the current K-State advisory as the dated agronomic source. Our original analysis is a two-component wet-basis mass balance: water mass equals wet mass multiplied by the moisture fraction, then total water is divided by total wet mass. The curve varies the wet-mass share only. It does not estimate yield, prevalence, drying performance or economic returns.
Transform Your Agribusiness
Unlock your farm's potential with expert advice tailored to your needs. Get actionable steps that drive real results.
Get StartedExplore related Crop Cultivation and Management coverage and our Research & Reports archive. Unlike a statewide crop forecast, this worksheet focuses on a field-level sampling question. Use current local evidence before making a real harvest or delivery decision.
- Fictional wet-mass moisture calculation (CSV)
- Fictional late-head wet-mass sensitivity curve (CSV)
- Blank main-head and late-tiller field card (CSV)
- Source evidence and calculation boundaries (CSV)
Sources: K-State Research and Extension, Late-Season Tiller Development Complicating Grain Sorghum Harvest in Kansas, and Agronomy eUpdate issue 1130, 19 November 2026. Original charts use fictional samples and do not reproduce field photographs. Suggested citation: The Farming Insider, “Kansas Sorghum Harvest: Measure Main Heads and Late Tillers”, 21 November 2026.


