




Canada durum downgrading factors can overlap within the same sample. In the preliminary 2026 No. 2 CWAD grading-factor table, 43.5% recorded hard vitreous kernels (HVK) as a factor and 39.8% recorded test weight. Adding them gives 83.3%, but it does not tell us the actual share with either factor.
The Canadian Grain Commission’s harvest index lists the report on 19 November. The report page shows a 17 November date and data through 16 November 2026. Our analysis keeps those dates separate, uses the grading table’s 161-sample denominator and makes the missing overlap explicit. Three charts and four CSV tools help readers audit a report before drawing a lot-level conclusion.
Canada durum downgrading factors: keep the denominator
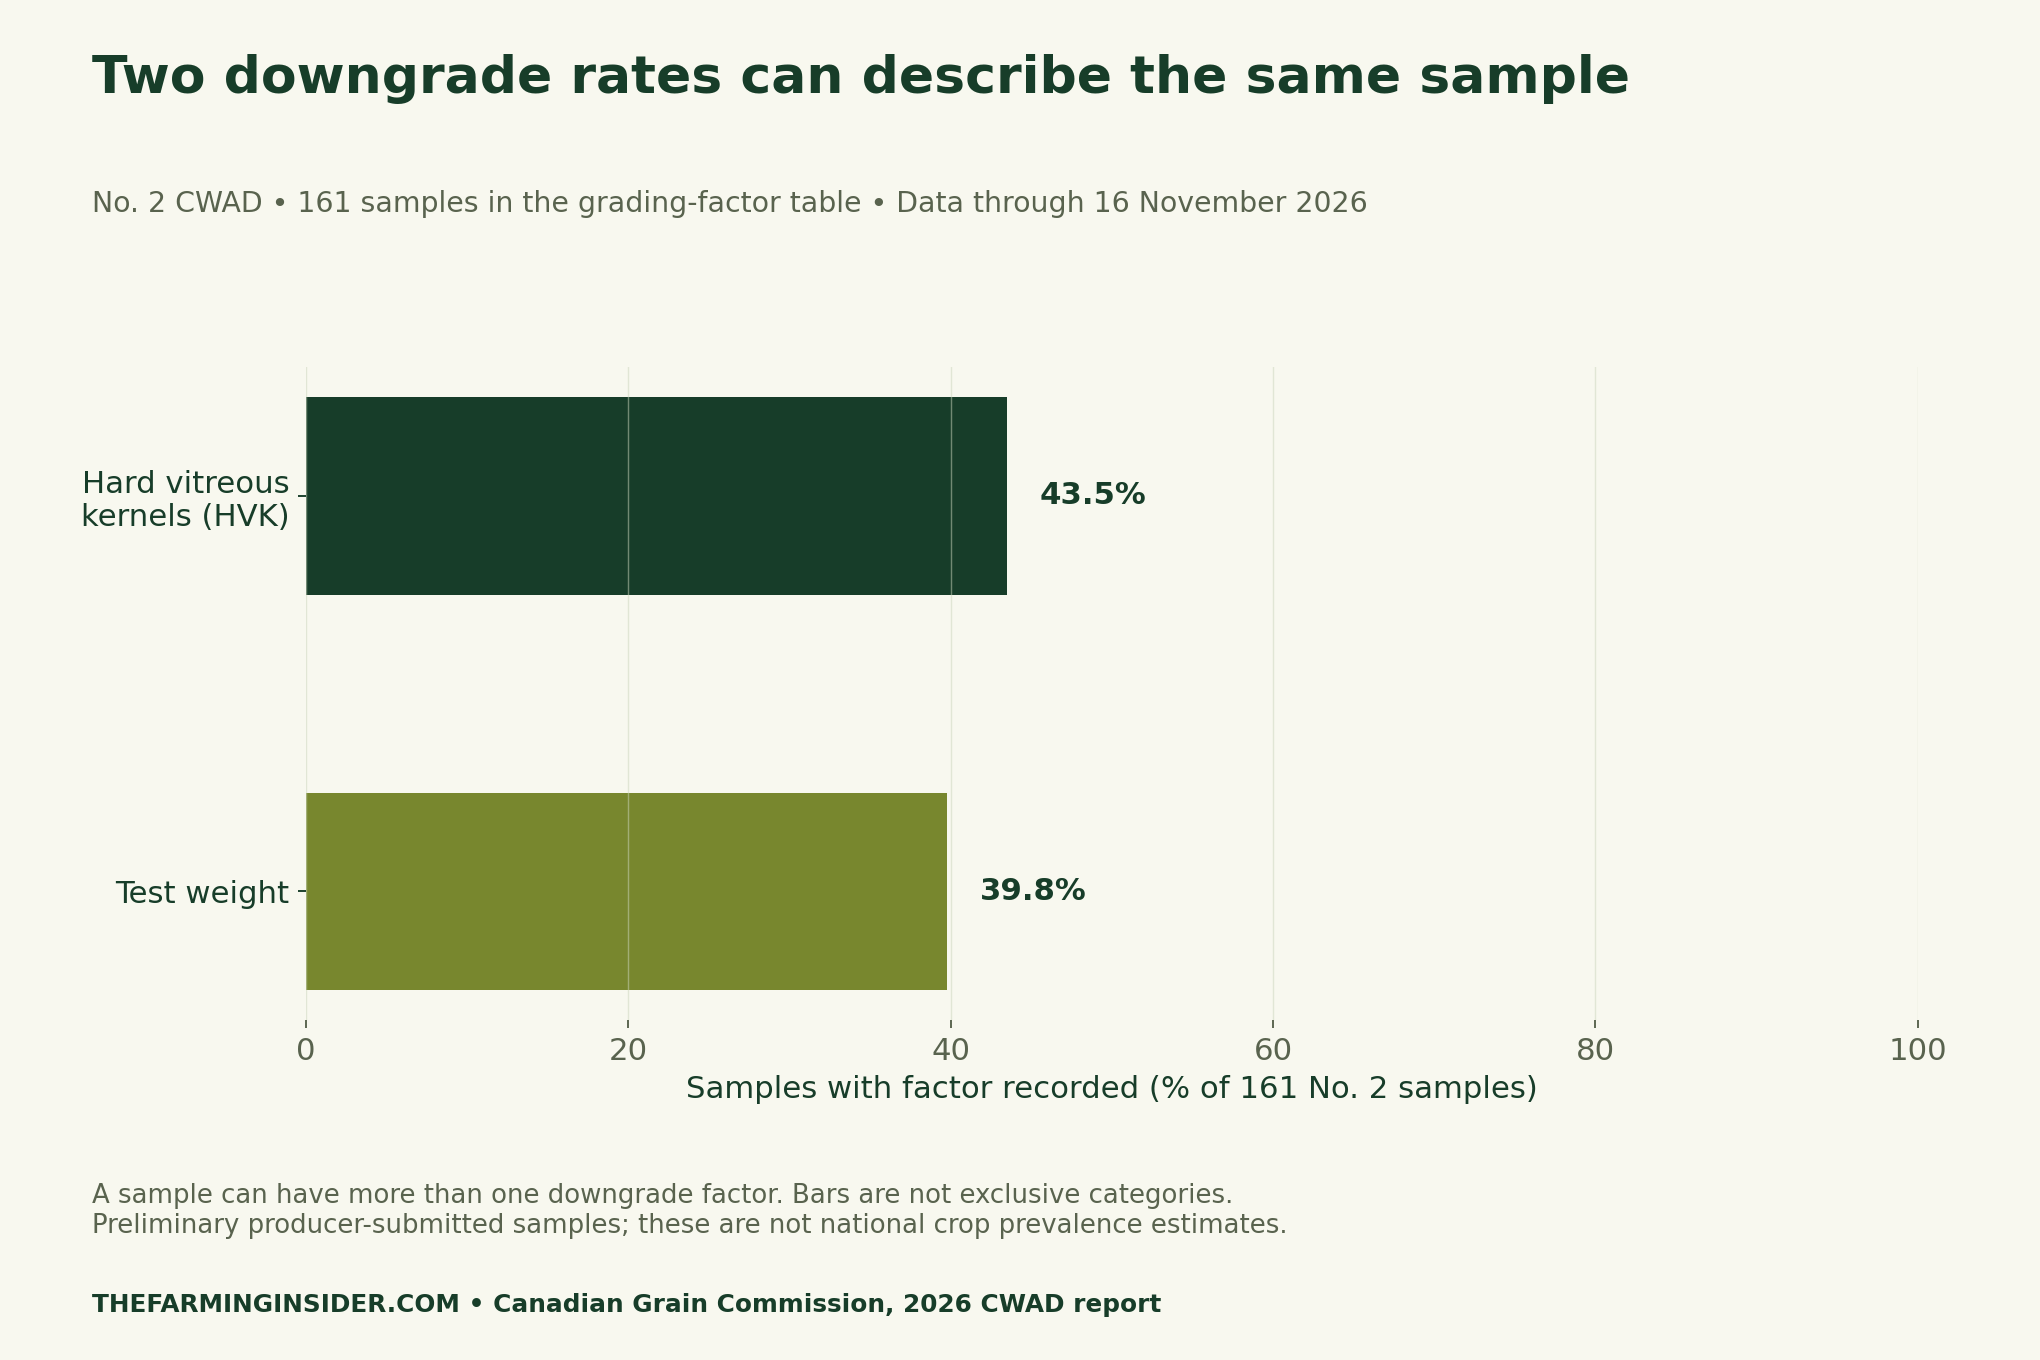
Read the selected grade, sample count and factor row together. The No. 2 grading-factor column contains 161 samples. Another table on the page reports protein measurements with a different sample count. Do not silently borrow that denominator because the grade label looks the same. A useful citation preserves the table as well as the percentage.
The two bars describe marginal rates: each asks how often one factor appears in the selected sample group. A single sample can contribute to both bars. They are therefore different from mutually exclusive categories such as “A only”, “B only” and “both”. A chart that stacks these published bars as exclusive shares would imply information that the table does not provide.
Canada durum downgrading factors: calculate a bound
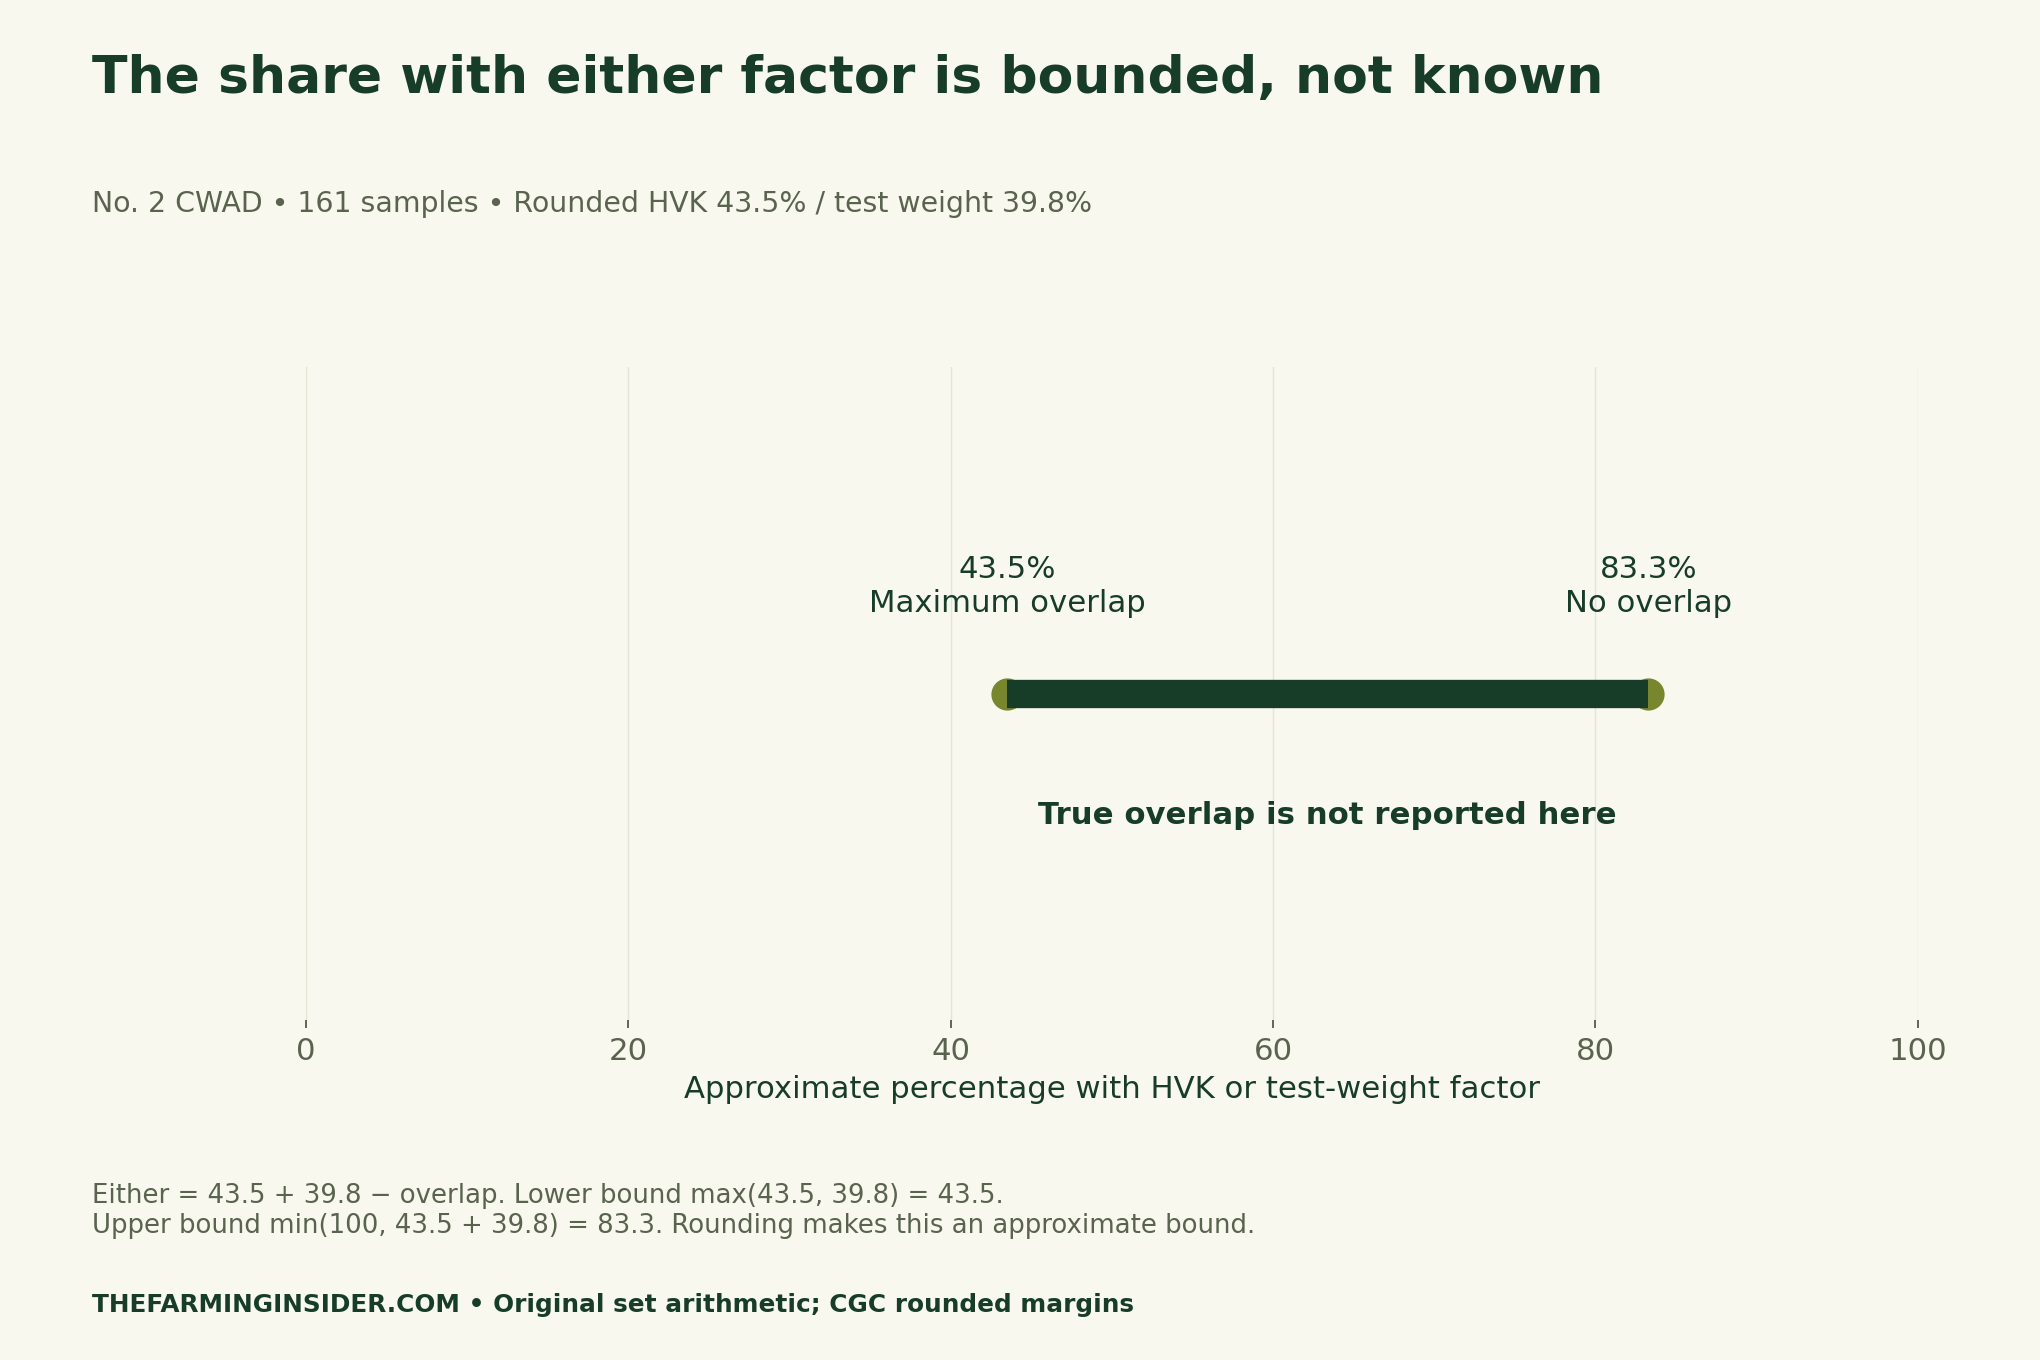
Call the HVK factor A and the test-weight factor B. The share with either is A + B − the share with both. The subtraction matters because adding A and B counts the overlapping samples twice. Here the joint share is not available, so the arithmetic can establish limits rather than one affected-sample estimate.
At one extreme, every test-weight sample could also be in the HVK group. The share with either would then be 43.5%, the larger marginal rate. At the other extreme, the groups could be disjoint, giving 43.5 + 39.8 = 83.3%. These limits use rounded displayed rates, so we label the range approximate.
The interval is not a statistical confidence interval. It does not assign probabilities to values inside it or quantify sampling error. It simply describes what the two marginal percentages allow when their overlap is unknown. Nor can it identify which factor matters most for a particular delivery or establish a price discount.
See why the same margins permit different stories
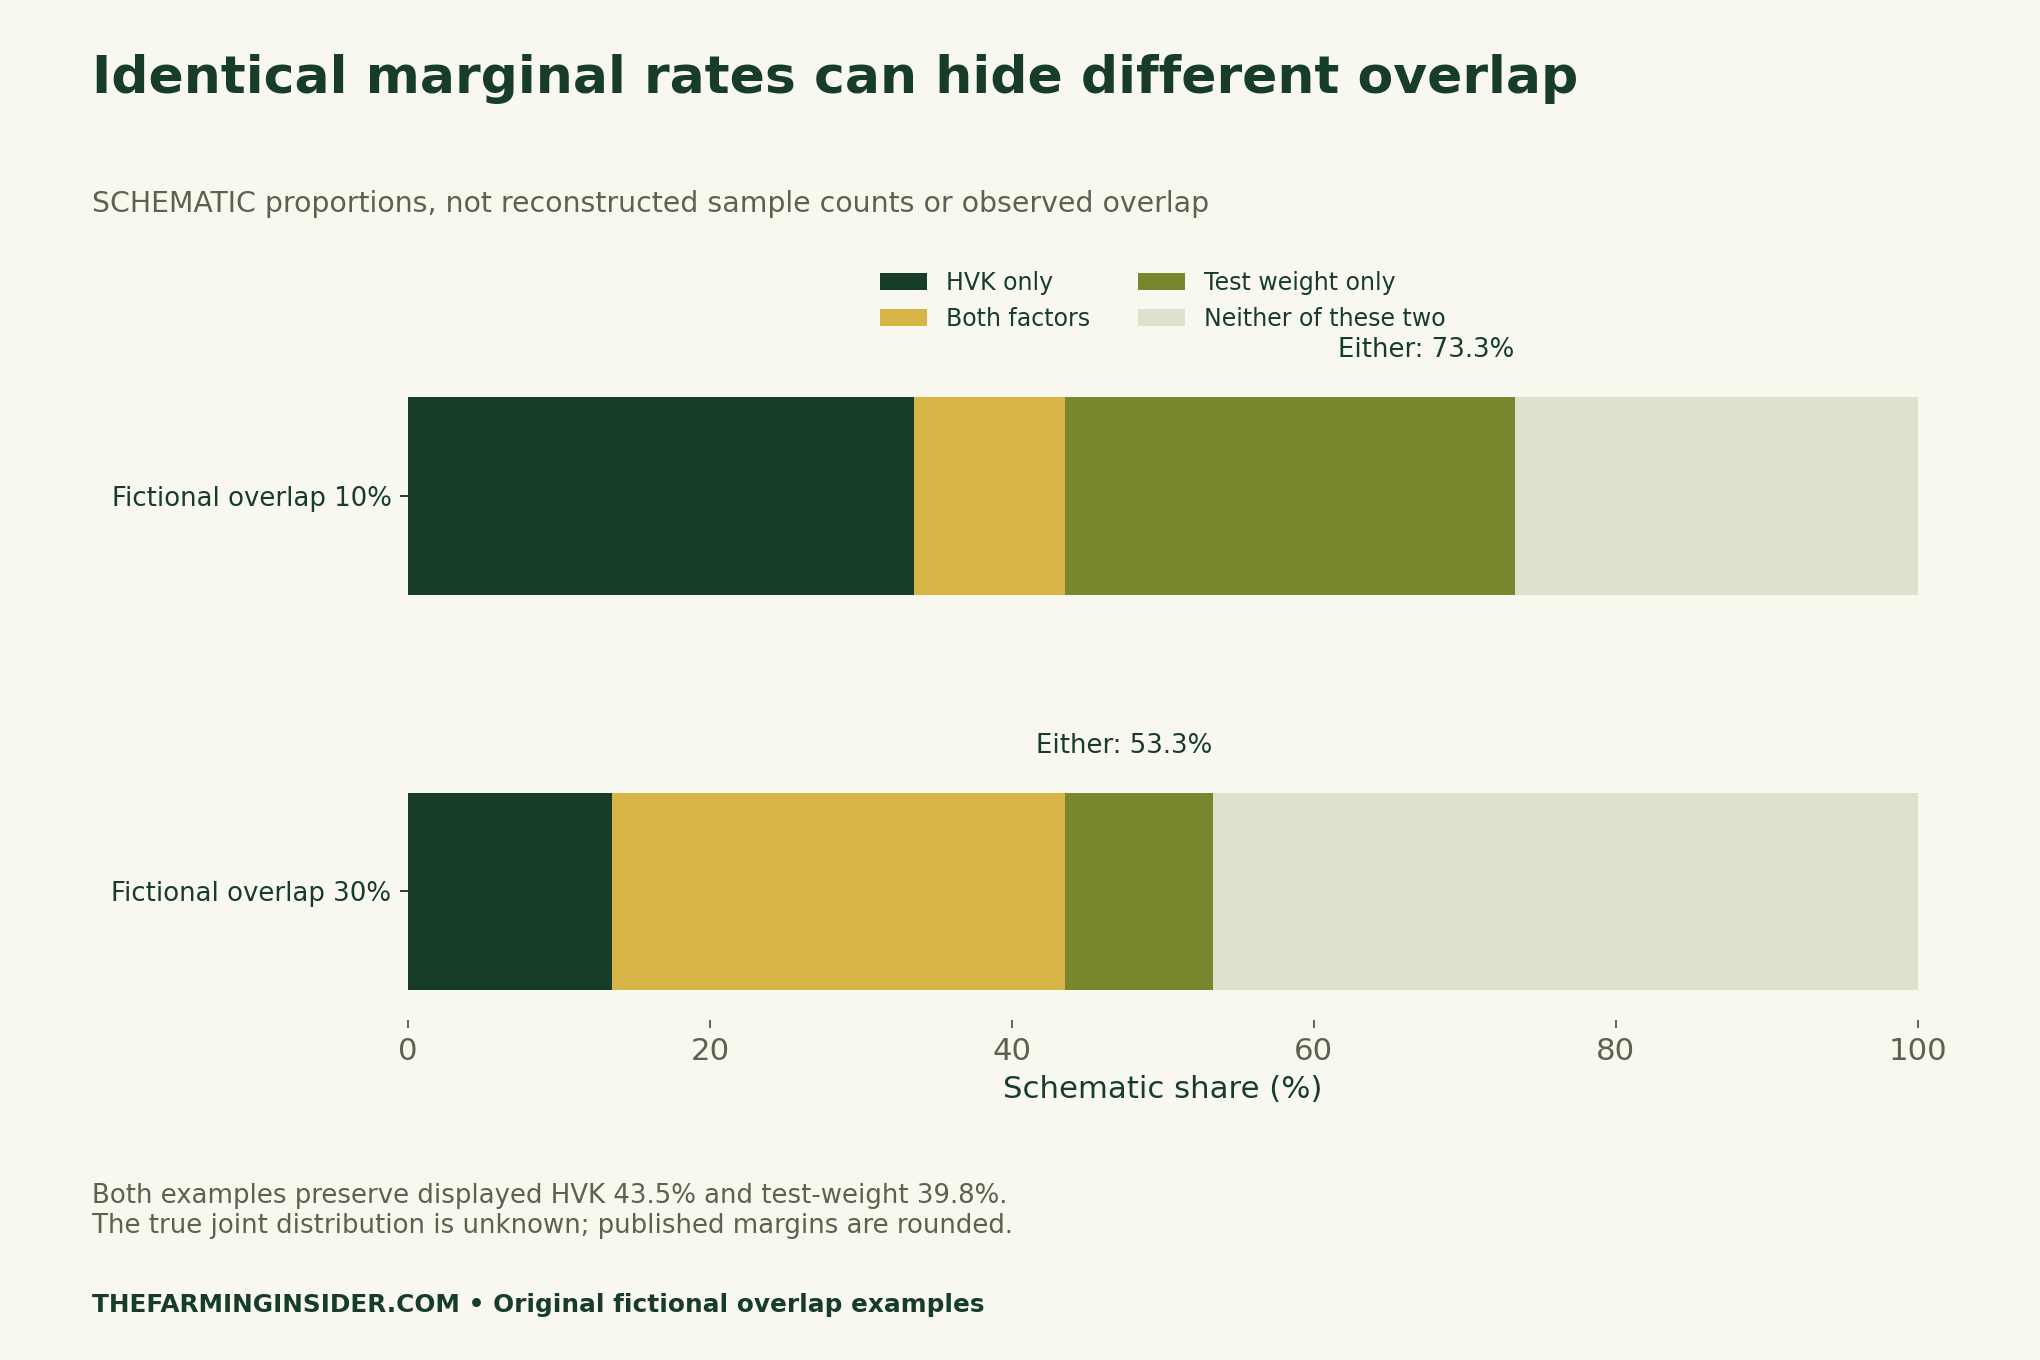
Our first fictional distribution gives 10% to both factors, leaving 33.5% HVK only and 29.8% test weight only. The share with either becomes 73.3%. In the second distribution, both accounts for 30%, leaving 13.5% and 9.8% in the single-factor groups. The share with either falls to 53.3%.
Both examples preserve the same 43.5% and 39.8% margins. They are schematic percentages, not integer reconstructions of the source’s samples. We do not turn rounded percentages into invented case records or claim that either distribution is more likely. The missing joint information remains missing in the downloadable file.
Separate a submitted-sample report from a national claim
The Harvest Sample Program is voluntary. Its producer-submitted grade and quality results are unofficial because an inspector did not collect those samples. The harvest report also warns that its grade counts may not match the crop-year distribution. These limits matter when using a sample percentage in a headline or a commercial discussion.
A result from this table cannot tell a grower the probability that their own grain has a factor. It also cannot establish the factor’s share of national tonnage. Keep the original sampling source and date visible when reproducing the bars. Avoid dropping the word “samples” and replacing it with “Canada’s crop”.
Build a lot register that keeps every reported factor
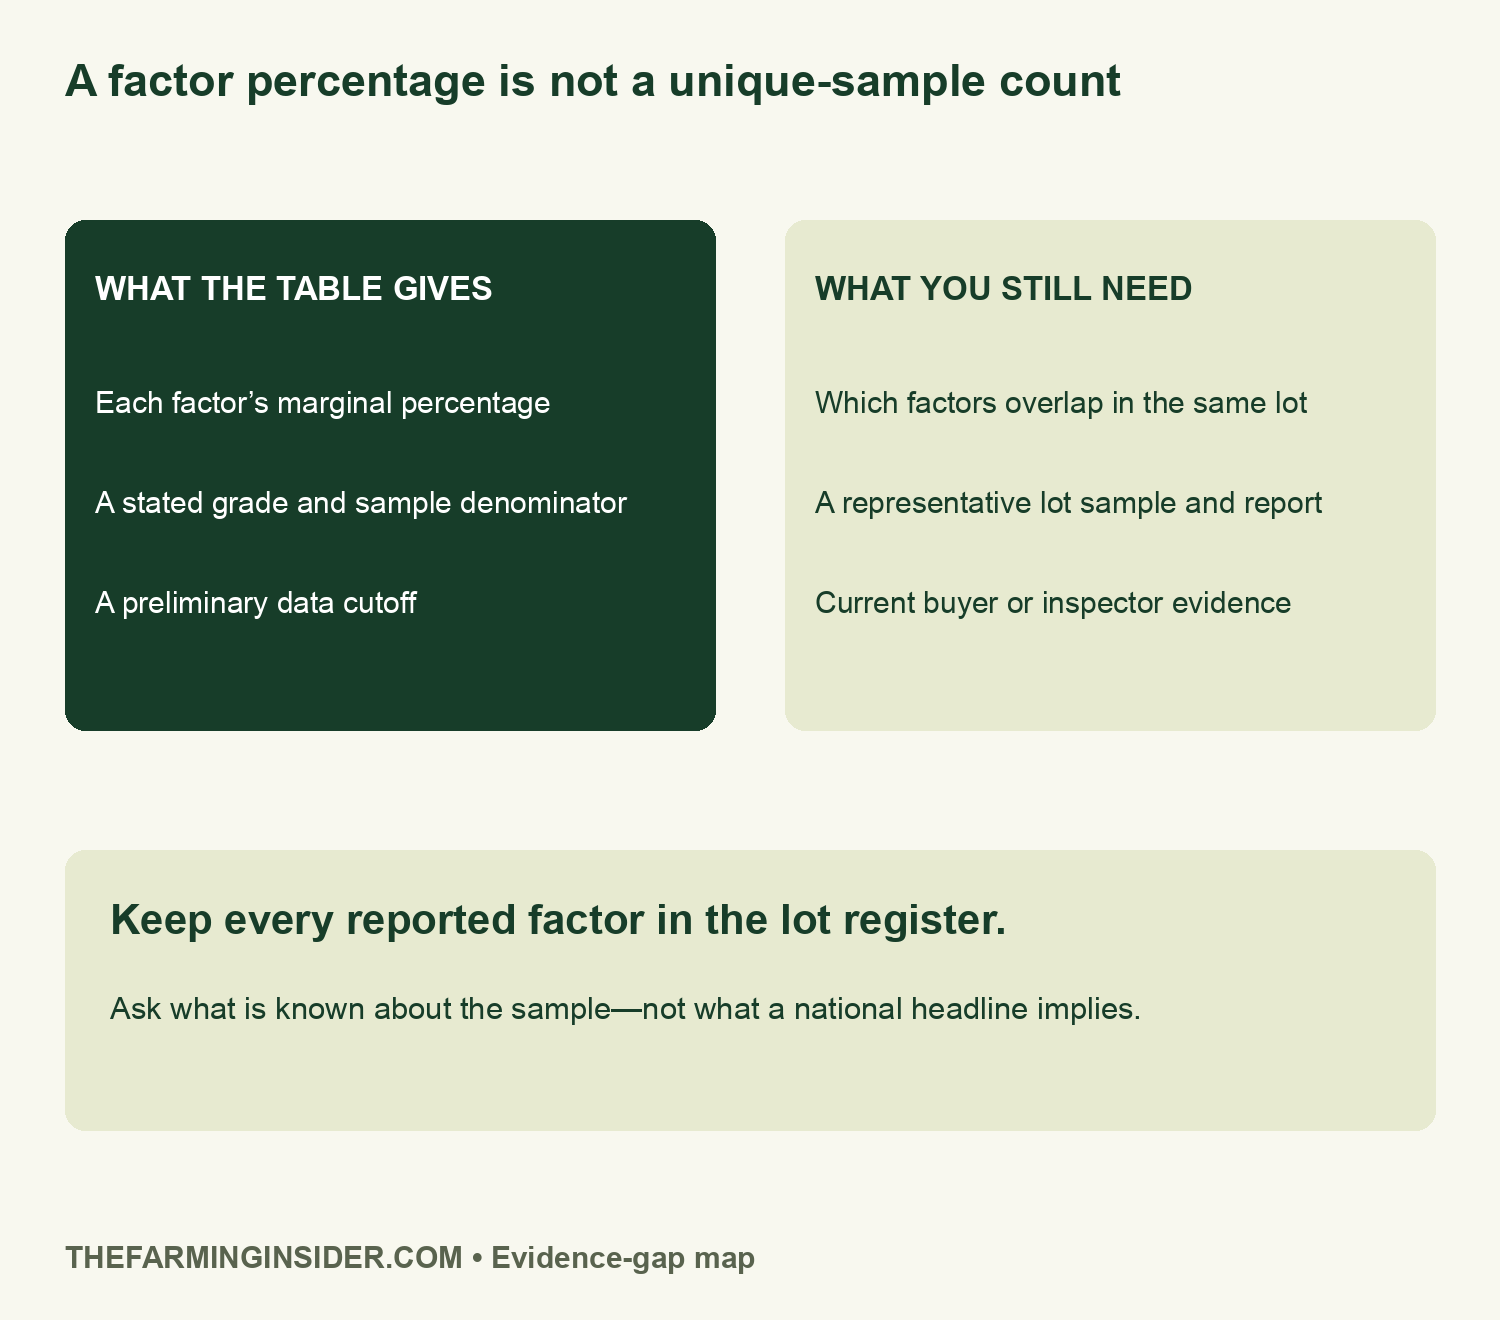
Use one row per factor in the blank register, keeping the lot reference consistent across rows. Record the sample date, sampling source, report type, measurement and unit. Then add the source of the tolerance or specification used and the question still requiring follow-up. Do not record an absent test as a confirmed zero.
Keep the full report beside the worksheet. “Neither of these two factors” in our schematic example does not mean no other factor was present. The downloadable transcription includes all factor rows for the selected No. 2 column so the original context is retained. That makes the register a discussion aid rather than a substitute grading certificate.
Methods, limitations and downloads
We transcribed the No. 2 grading-factor column, kept the 161 denominator and computed a two-set union bound from the displayed rates. We then created two fictional percentage distributions to demonstrate that identical margins need not imply identical overlap. No actual joint records, national weights, lot inspection or price schedule were available or inferred.
For related reading, browse Crop Cultivation and Management and our Research & Reports archive. When a new preliminary update appears, retain this version’s dates and denominator before comparing it with the new table. A changed sample pool can change a percentage without identifying a change in a particular lot.
Transform Your Agribusiness
Unlock your farm's potential with expert advice tailored to your needs. Get actionable steps that drive real results.
Get Started- All published No. 2 CWAD factor rows (CSV)
- Approximate bounds and fictional overlap examples (CSV)
- Blank lot and factor evidence register (CSV)
- Measure, denominator and date dictionary (CSV)
Sources: Canadian Grain Commission, Quality of Canada Western Amber Durum in 2026, preliminary data through 16 November; harvest index, listing dated 19 November; and Harvest Sample Program. Suggested citation: The Farming Insider, “Canada Durum Downgrading Factors: Why Rates Cannot Be Added”, 21 November 2026. Charts add original calculations and clearly labelled schematic examples.


