




The USDA September 2026 corn yield correction changes a spreadsheet baseline without creating a new October outlook. If your workbook still contains the earlier September figures, a comparison can be wrong even when its October input is correct. The repair starts with identifying the affected period and source version.
This report provides three corrected yields, reproducible comparisons and four downloadable data or audit tools. Earlier September values are arithmetic reconstructions from the correction notice, not a separately recovered original release. State and national forecasts are benchmarks, not field-level predictions or instructions to change a marketing position.
What did NASS correct?
The 23 October NASS notice identifies affected September corn data for Kansas, Nebraska and the United States. It also describes affected plant-population and ear-count measures. The agency says it checked the October forecasts and left them unchanged.
Its 24 October explanation attributes the September processing problem to acreage weights combining irrigated and non-irrigated objective-yield observations. We use that explanation for the corrected yields and stated revisions below. This article does not reconstruct the underlying weights or identify a responsible person or software system.
| Geography | Earlier September, reconstructed | Corrected September | Revision |
|---|---|---|---|
| Kansas | 121 | 118 | −3 |
| Nebraska | 177 | 182 | +5 |
| United States | 178.5 | 178.8 | +0.3 |
Read the corn yield correction by geography
The calculation for an earlier value is corrected value minus the stated revision. For example, Nebraska’s 182 minus a five-bushel upward revision gives 177. Kansas moves in the other direction: 118 minus a negative three gives 121. Keep the reconstructed label with any reused table or chart.
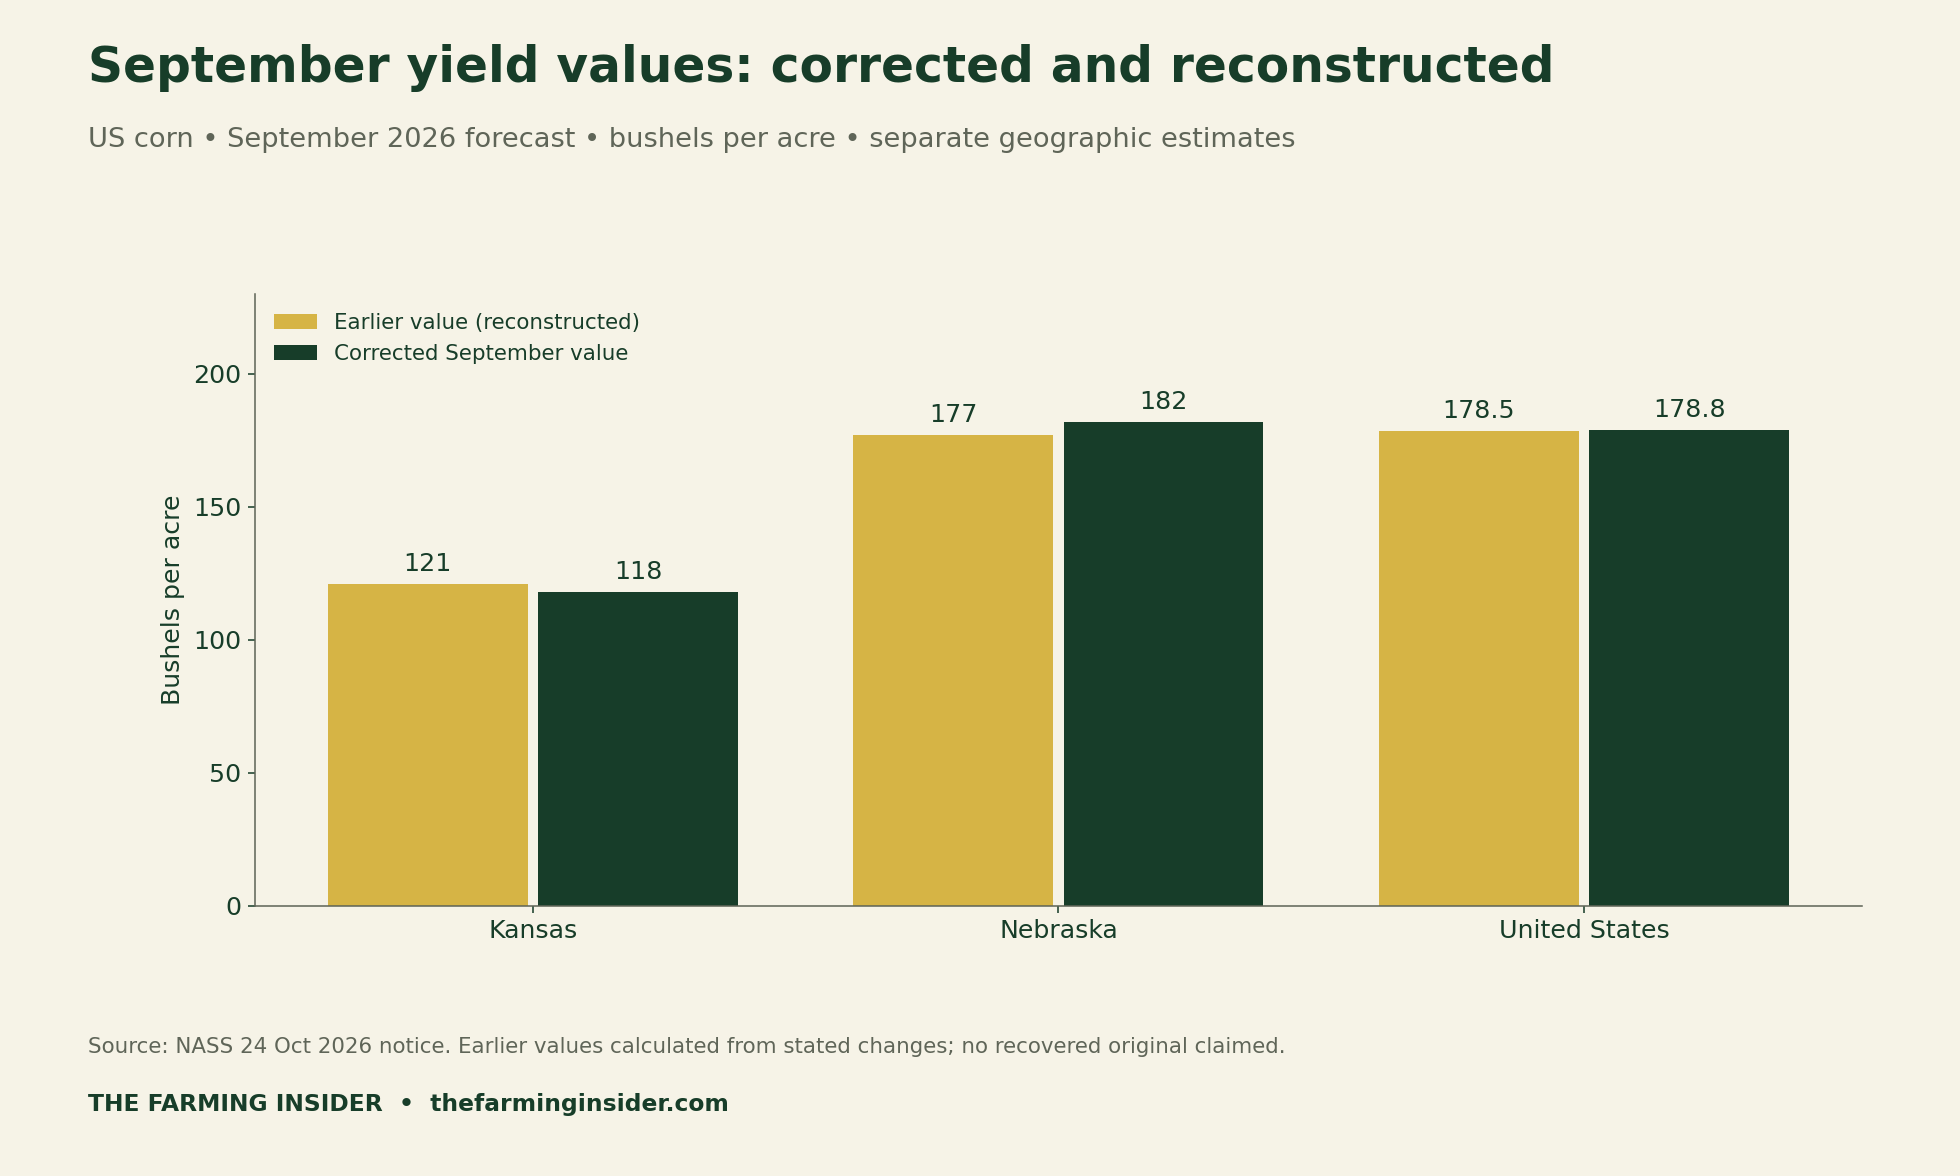
A state revision and a national revision answer different questions. Adding −3, +5 and +0.3 would produce a number with no useful interpretation here. Likewise, a simple mean of the two states does not reproduce the national correction. We do not infer acreage weights from these yield values alone.
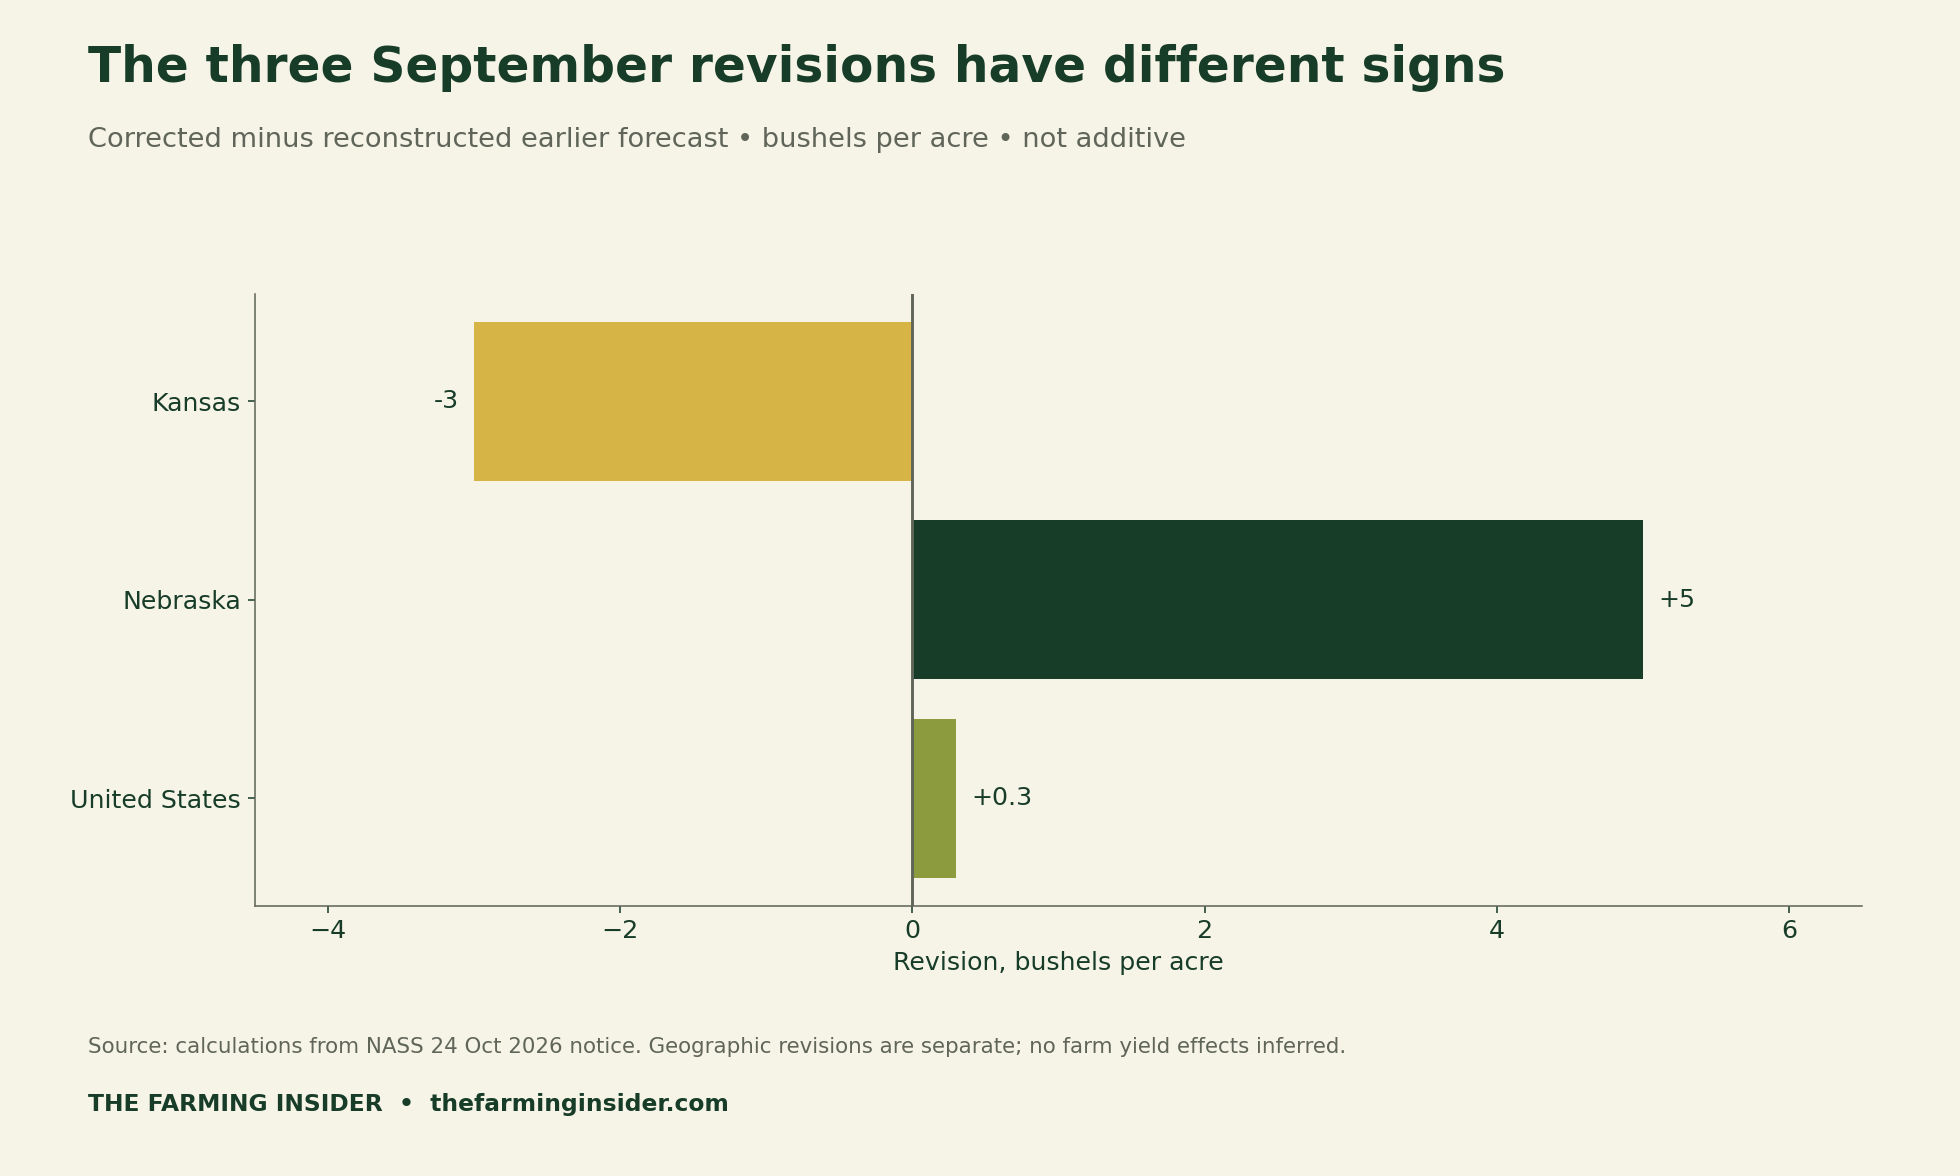
Check the denominator before comparing percentages
An absolute revision and a relative revision are different measures. We calculate relative change as (corrected value ÷ reconstructed earlier value − 1) × 100. That gives approximately −2.48% for Kansas, +2.82% for Nebraska and +0.17% for the United States.
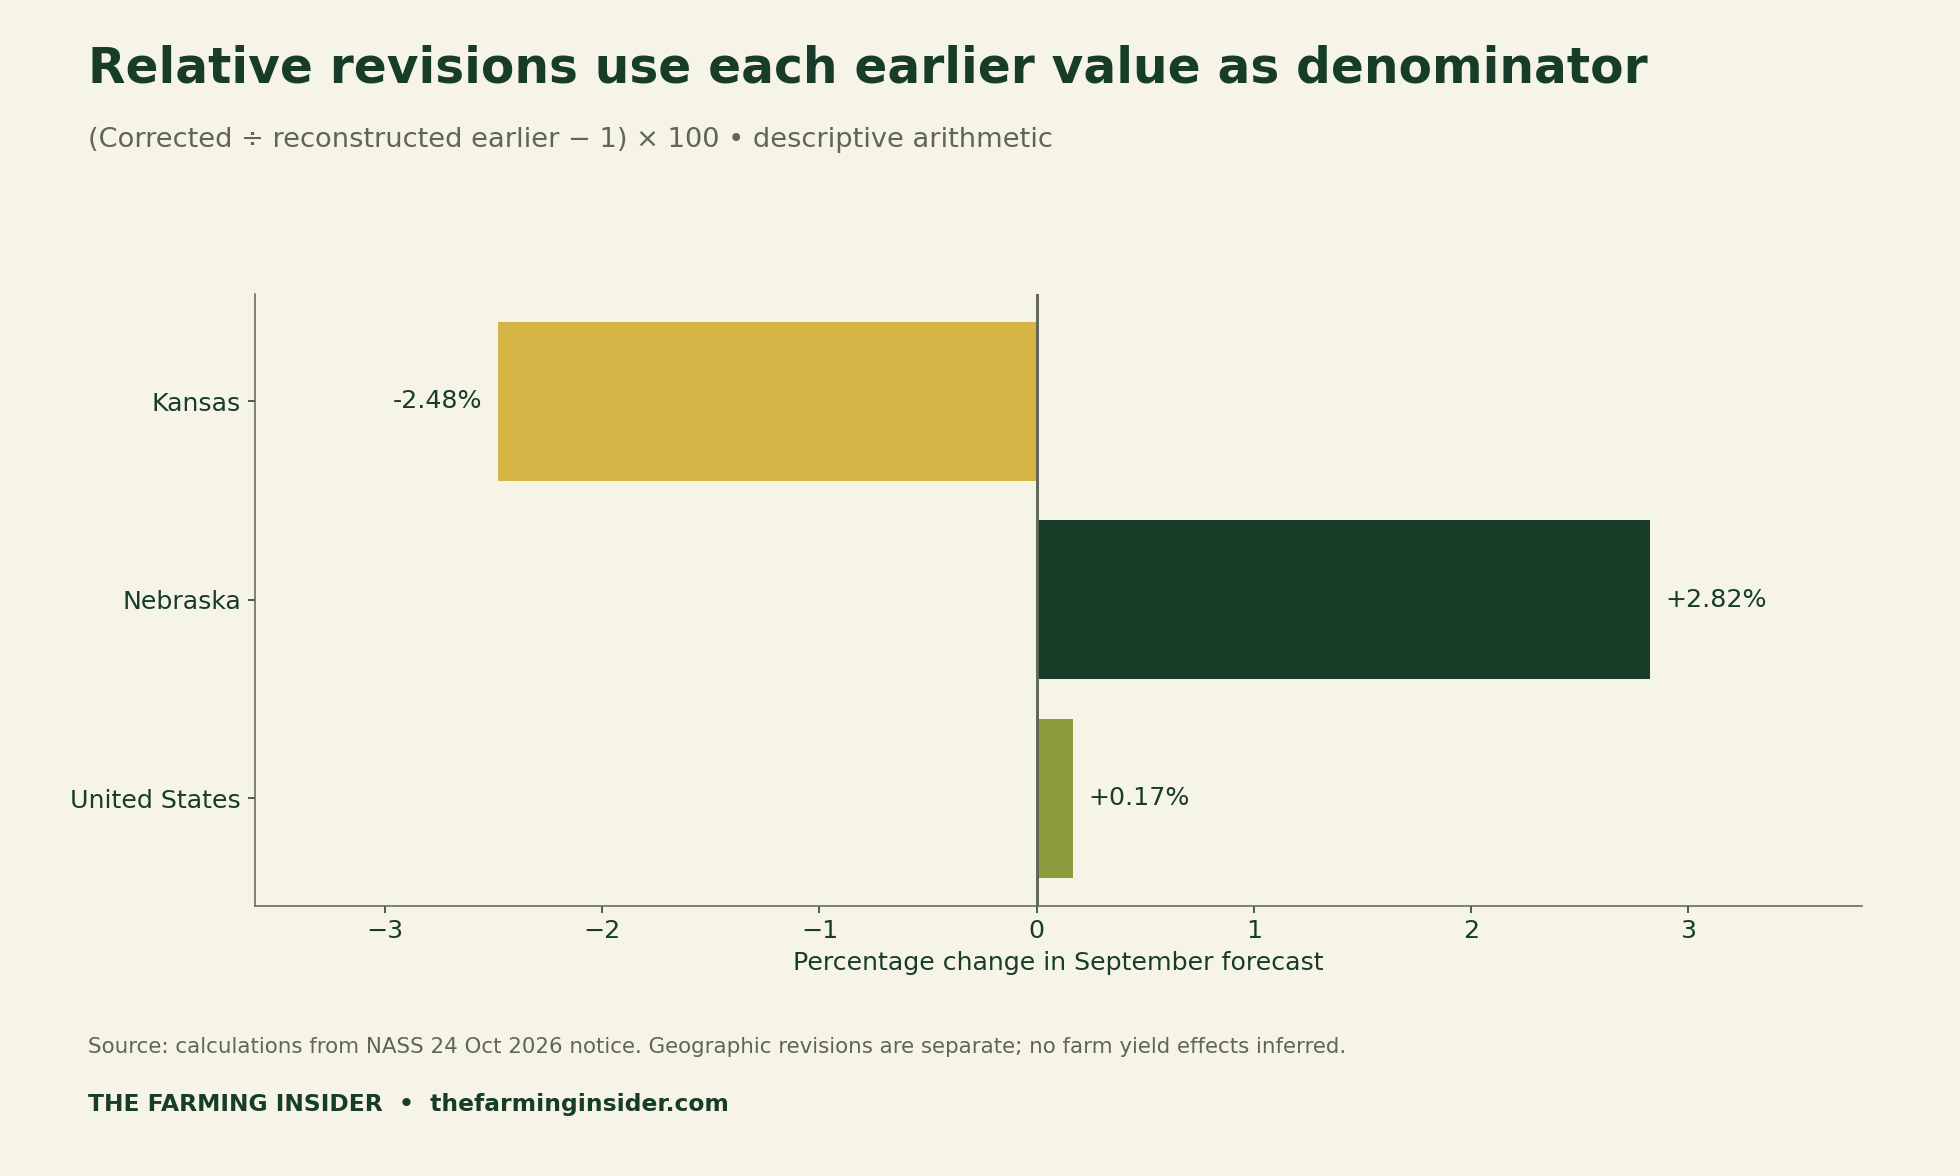
Retain unrounded calculations in the data sheet and round only the displayed result. A small national relative revision does not mean every local effect is small. It also cannot establish a financial consequence without additional evidence about production, prices, timing and the decisions actually made.
Repair the comparison while holding October constant
The official 9 October briefing, page 5, reports October corn forecasts of 188 bushels per acre for Nebraska and 181.2 for the United States. Those verified inputs allow the two comparisons below. We do not insert an unverified October Kansas value.
For Nebraska, 188 − 177 = 11 using the reconstructed earlier baseline, while 188 − 182 = 6 using the corrected baseline. Nationally, 181.2 − 178.5 = 2.7 becomes 181.2 − 178.8 = 2.4. October is held constant in both calculations; only the September input changes.
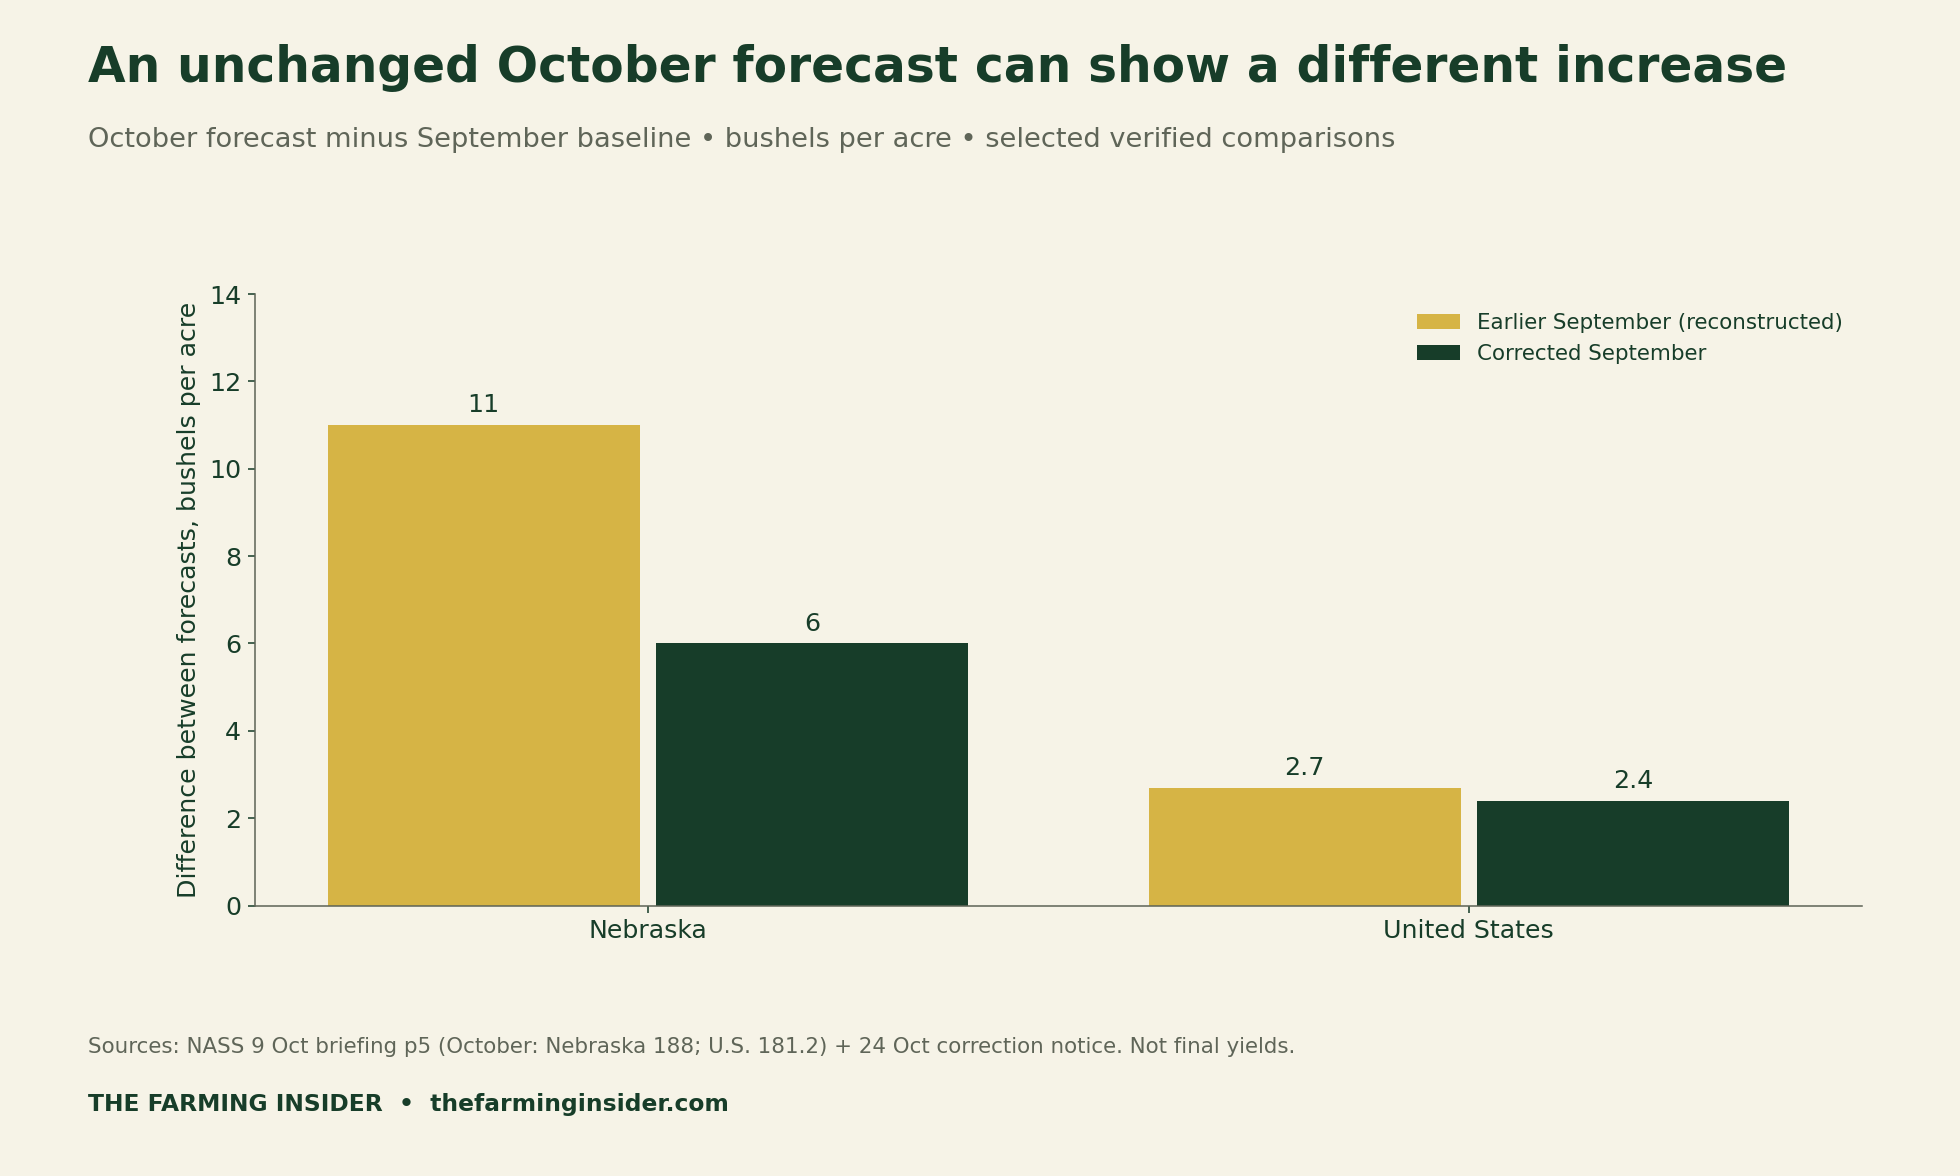
The general identity is useful beyond this release. New comparison = current-period forecast − corrected prior-period forecast. Its change equals earlier prior-period value − corrected prior-period value. Recheck formulas, chart labels and written commentary together; changing one input does not automatically repair a static pasted headline.
Preserve a source version before changing a workbook
Save a copy of the source and the existing input before editing. Record crop, geography, measure and unit alongside the reference period. Then retain the original publication date, the correction date and your retrieval date as separate fields. A correction announced in October can still describe September.
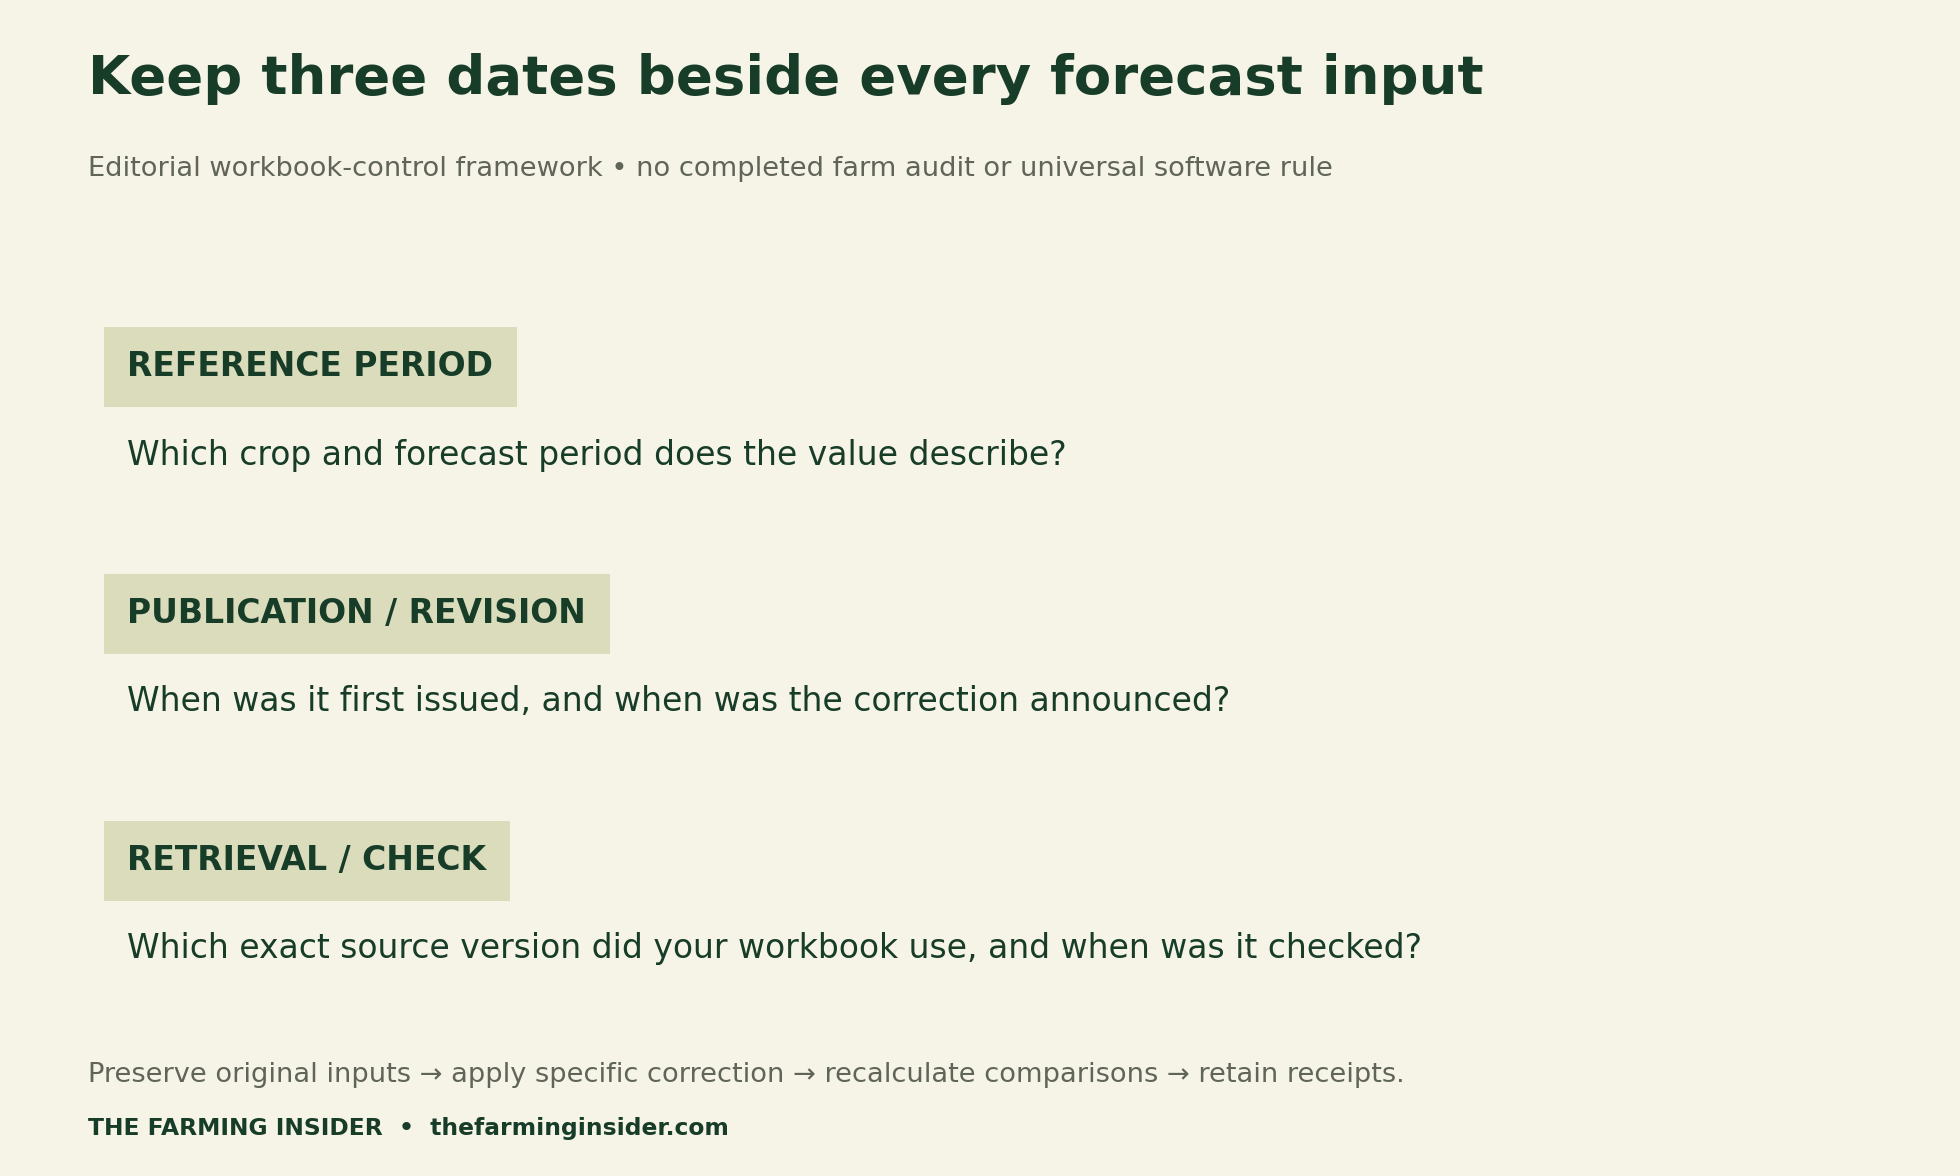

Match the exact affected series before replacing a value. Bushels per acre, total bushels, planted acres and harvested acres are not interchangeable. Keep forecast and final-outcome labels visible. Where a source remains uncertain, record the unresolved question rather than silently treating another period or geography as a substitute.
For a related stock-and-flow example, see our cattle inventory reconciliation. Our broader crop-data management overview provides context; the present checklist does not endorse a software product or verify the older article’s illustrative outcomes.
Download the correction data and blank audit tools
- Corrected yields and reconstructed earlier values (CSV)
- Verified-input comparison calculations (CSV)
- Blank workbook version ledger (CSV)
- Workbook correction checklist (CSV)
Methods, limitations and suggested citation
The Farming Insider reviewed the two NASS correction notices and the October briefing on 29 October 2026. Source files and calculation scripts were retained. The correction ledger contains three geographic rows; the comparison audit contains two independently supported October inputs. Each original-minus-corrected identity was checked before rounding.
Transform Your Agribusiness
Unlock your farm's potential with expert advice tailored to your needs. Get actionable steps that drive real results.
Get StartedNo field records, farm income, market response or final harvest outcome was measured. This is a selected version-control analysis, not a complete audit of every corrected NASS table. If your retained copy disagrees, preserve both versions and verify the exact source and reference period before applying a replacement.
Suggested citation: The Farming Insider (29 October 2026), USDA Corn Yield Correction 2026: Repair Your Spreadsheet, with correction ledger and comparison audit. Cite NASS directly for its forecasts, preserve the reconstructed label, and retain the unit and dates when reusing the calculations.


