




Saskatchewan harvest 2026 reached 93% completion in the report covering 6–12 October. Yet the final acres still require a farm-specific plan for machine time, handling capacity and cash. A provincial percentage cannot tell you when your own last field will be finished.
Our worked example starts with 110 acres remaining. At 10 productive acres per hour, that means 11 productive hours. With five workable hours a day, the requirement becomes 2.2 workable-day equivalents, before extra delays. A hypothetical C$60-per-acre quote gives a C$6,600 subtotal.
This report combines a dated progress comparison with five original charts and a reusable remaining-work worksheet. All example acreages, work rates and contractor prices are chosen scenarios. Replace them with your own field records and written quotations.
Saskatchewan harvest 2026: keep the dates visible
The 15 October government release covers 6–12 October. The 8 October release covers the previous week, ending 5 October. Provincial completion rose from 82% to 93% across those observations.
That is an increase of 11 percentage points. Equivalently, the outstanding share fell from 18% to 7%, a reduction of about 61.1% in the share still unharvested. Those two calculations use different denominators.
We checked the official current-report page on 22 October; it still displayed the 6–12 October period when checked. Treat these figures as a dated snapshot. Refresh the official report and local conditions before making a current field plan.
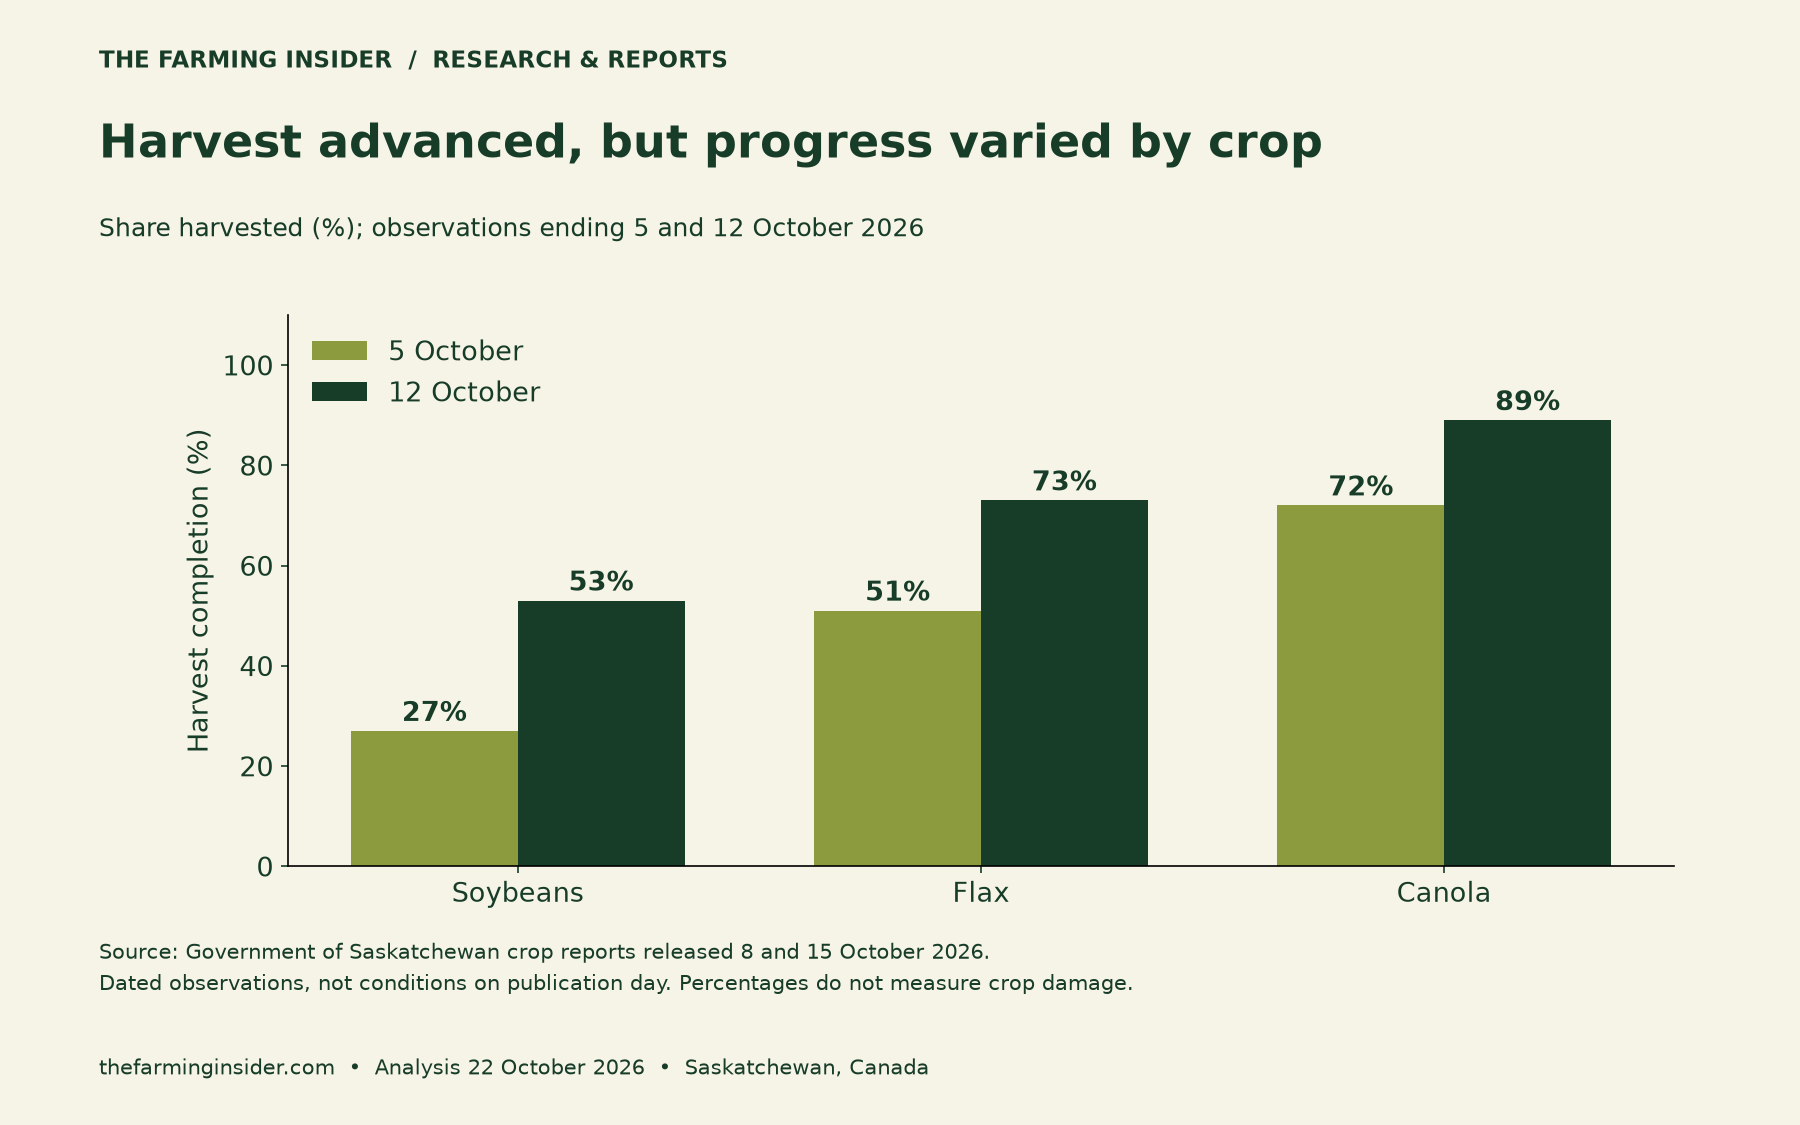
The paired bars show soybeans moving from 27% to 53%, flax from 51% to 73%, and canola from 72% to 89%. These are crop-specific completion rates, not equal shares of Saskatchewan’s total cropped area.
Regional averages cannot replace your field list
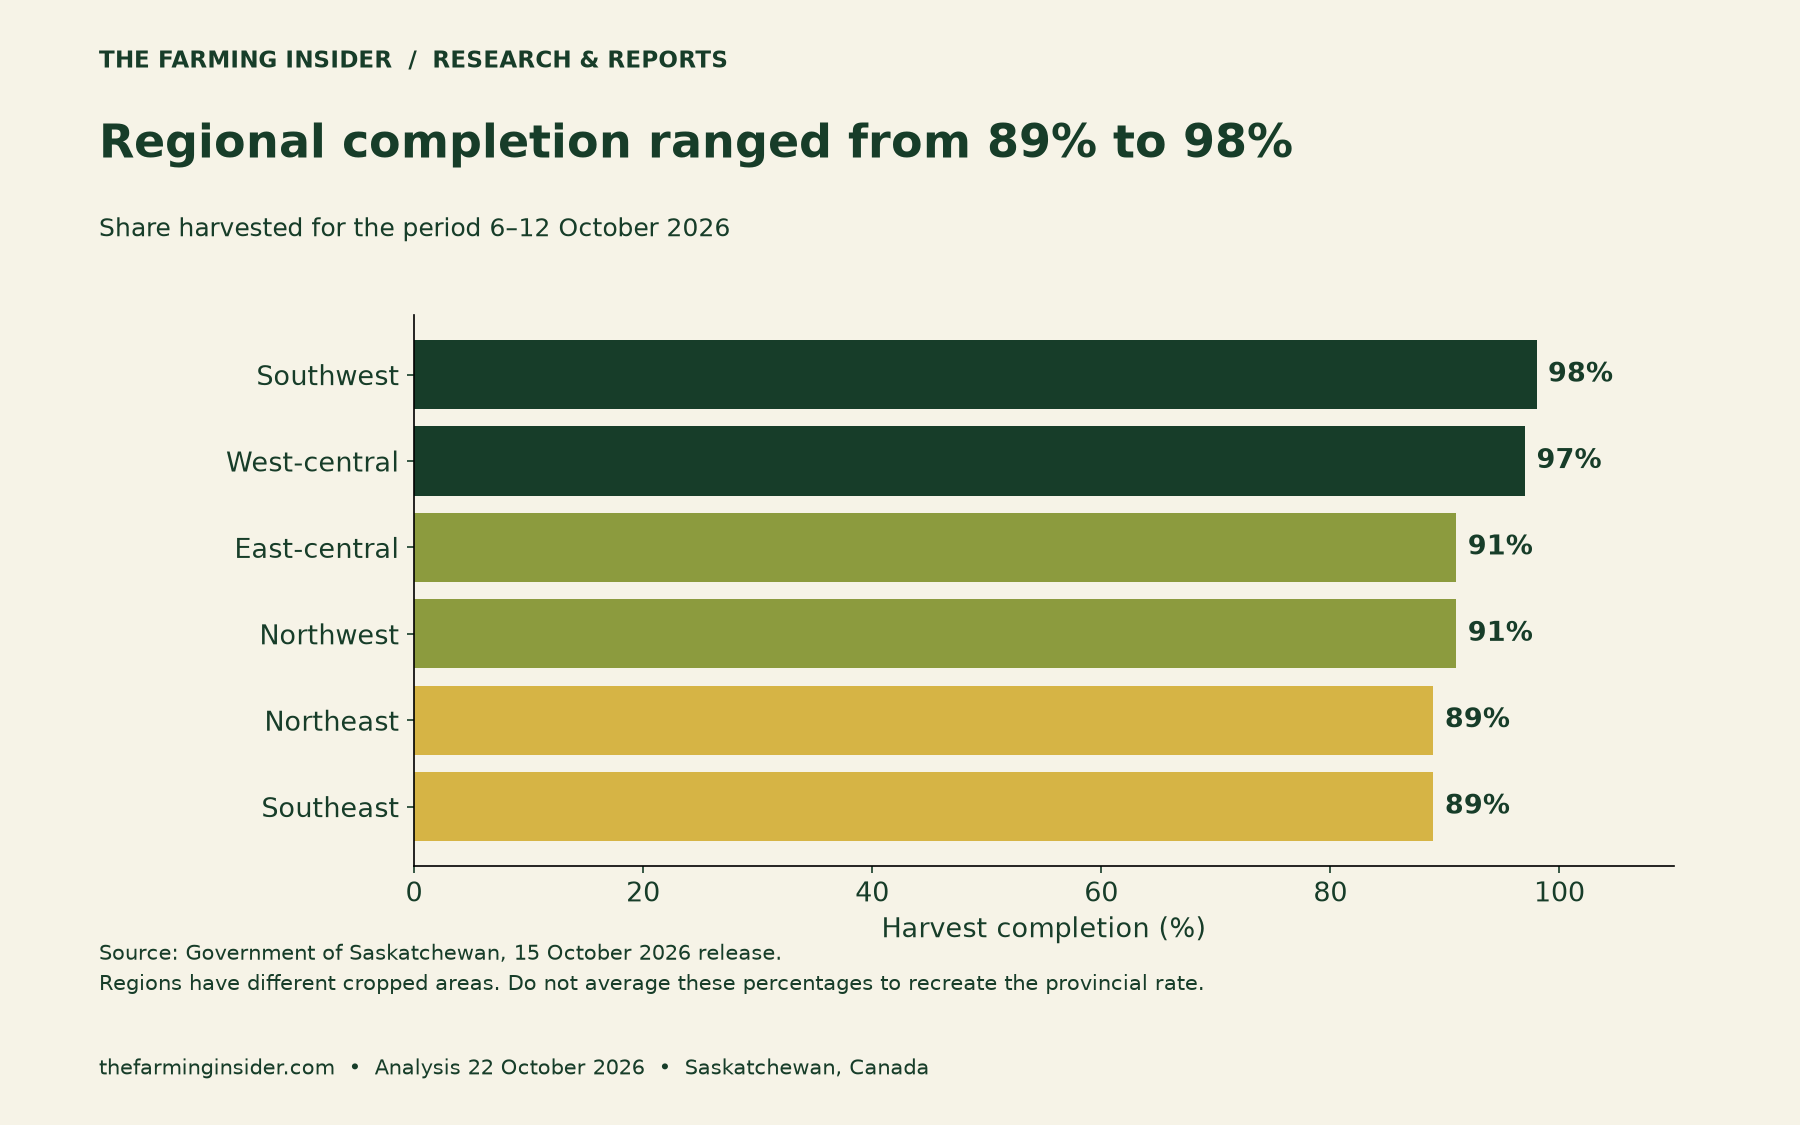
The regional chart provides context, but it does not rank which field you should harvest first. Local crop condition, access, equipment, weather and storage constraints still need assessment. Nor should you average regional percentages without their area weights.
The government reported limited damage in the remaining crop. Therefore, an unharvested share is not a measured loss. We do not convert it into tonnes lost, forgone revenue or an insurance claim.
Convert the outstanding share into actual acres
For a simple comparison, give each crop its own hypothetical 1,000-acre enterprise. Apply the reported completion rate to each separately. The resulting remaining areas are 470 acres for soybeans, 270 for flax and 110 for canola.
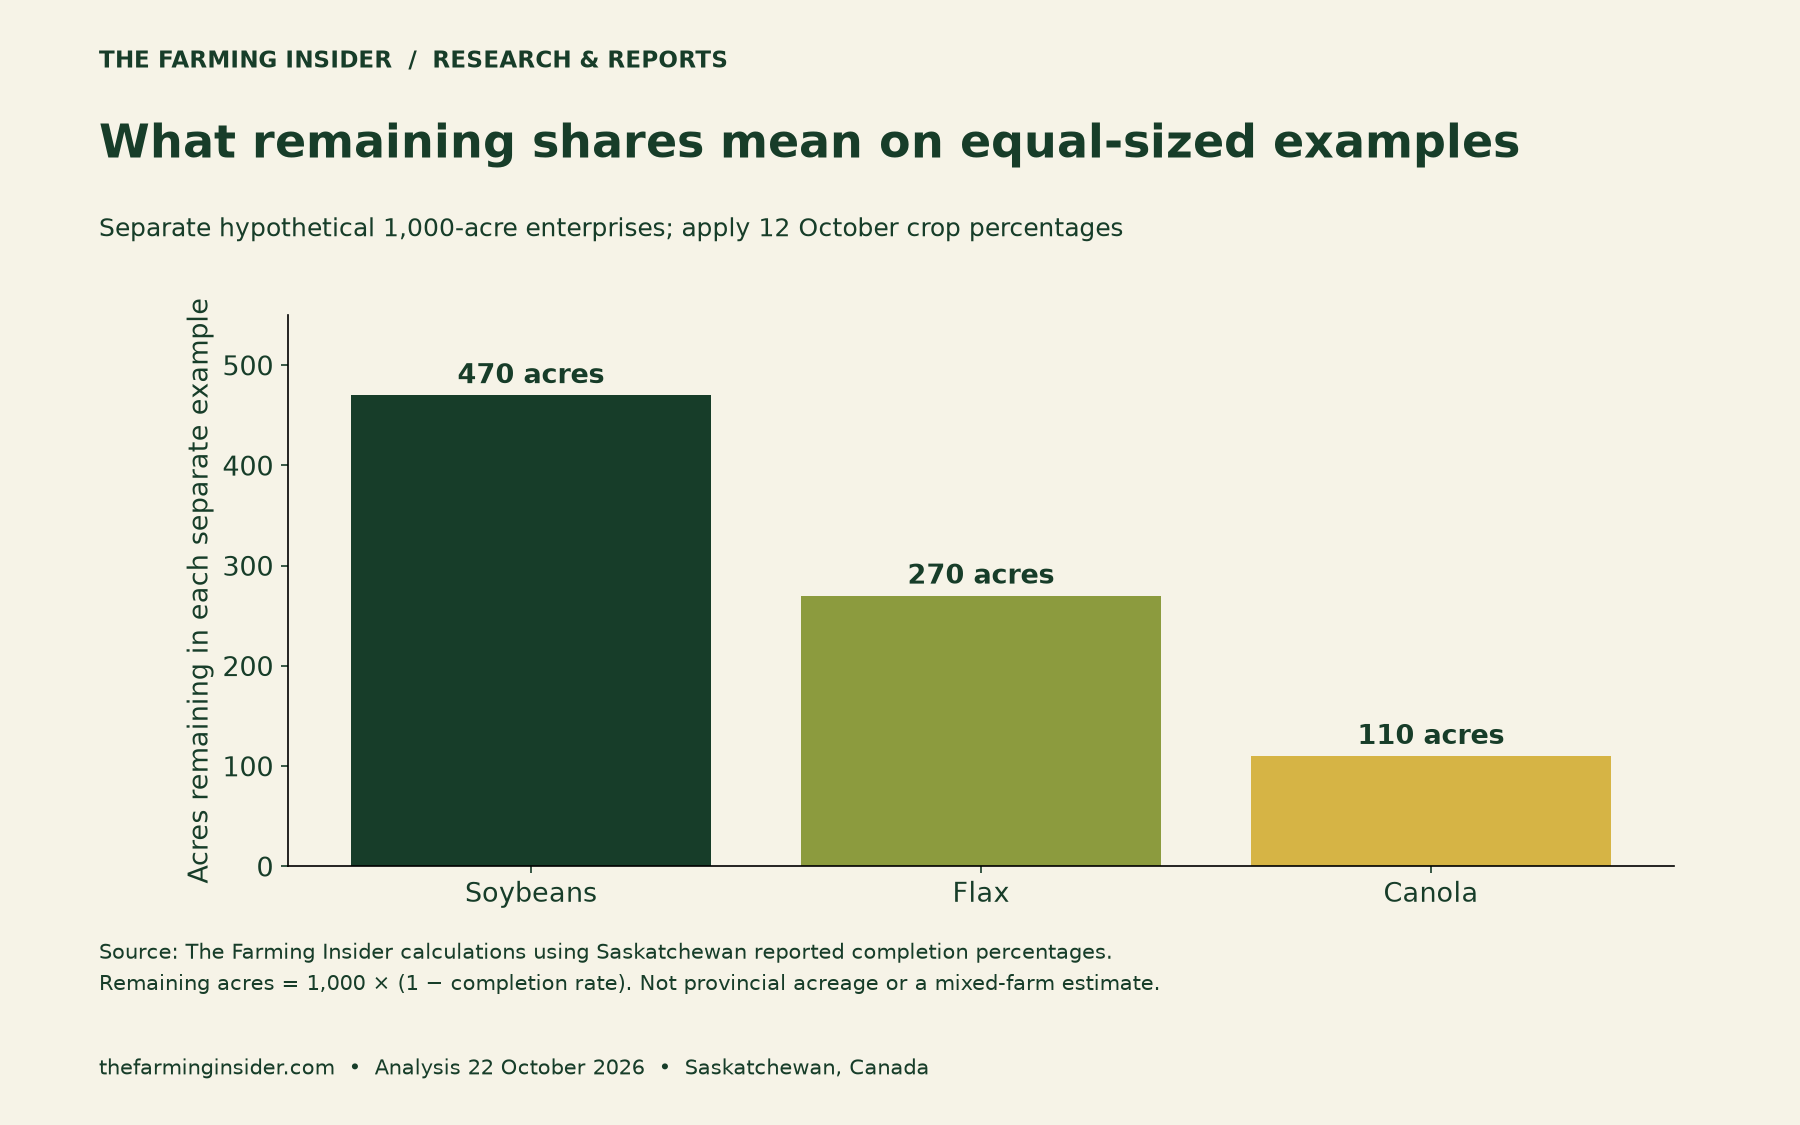
These normalized examples make percentages easier to picture. They do not estimate provincial acreage, and they are not the crop mix of one farm. A reader with 600 acres of canola and 89% completion would instead calculate 66 acres remaining.
Remaining acres = total relevant acres × (1 − completion percentage ÷ 100).
Where possible, use an actual field-by-field remaining-acre count rather than applying a provincial average. Note partial fields, inaccessible corners and any areas already assigned to another machine. That prevents overlapping work estimates.
Turn remaining acres into productive hours
Next, divide remaining acres by a realistic productive work rate. Keep the definition consistent. A rate measured while the combine is cutting differs from one that already includes unloading, travel and routine stoppages.
In our example, 110 acres divided by 10 productive acres per hour equals 11 hours. Dividing again by five workable productive hours per day gives 2.2 days of equivalent work. It is not a promise that the field will finish in 2.2 calendar days.
Transform Your Agribusiness
Unlock your farm's potential with expert advice tailored to your needs. Get actionable steps that drive real results.
Get Started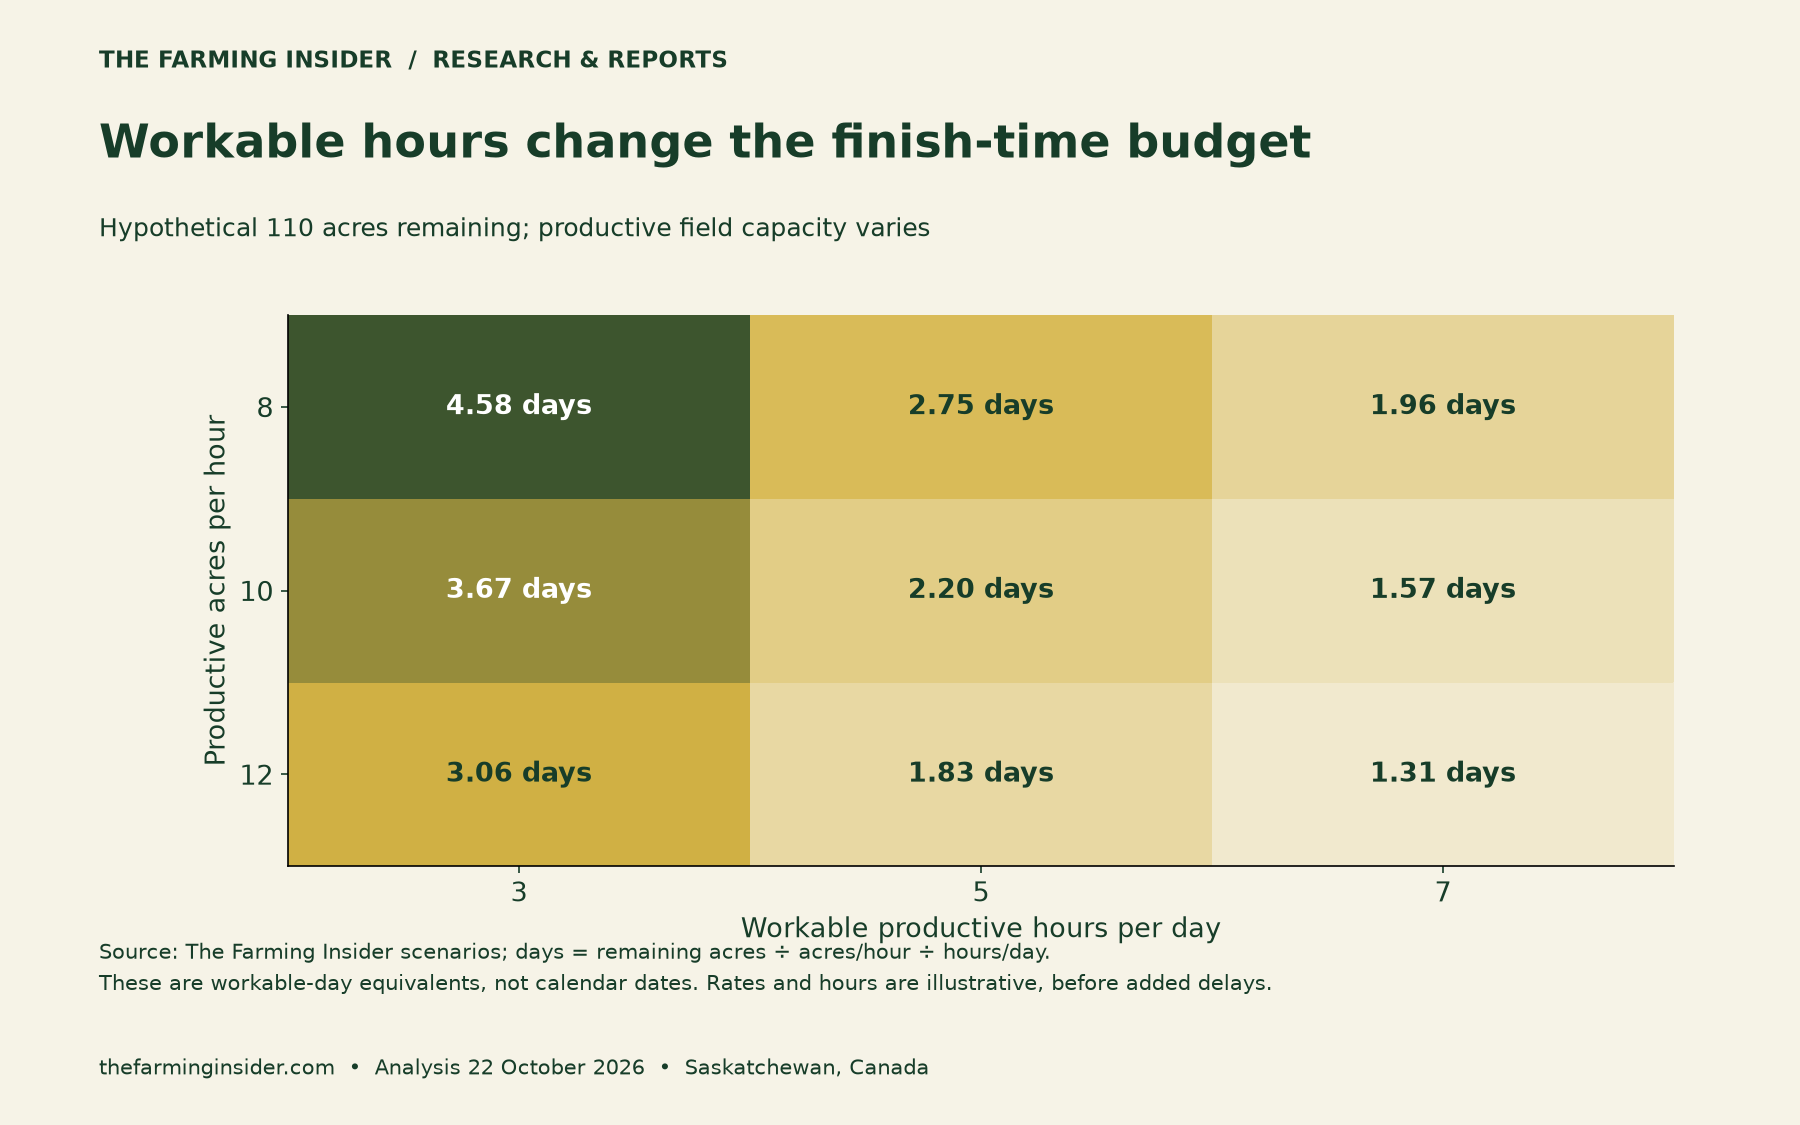
The matrix tests three field capacities and three daily work windows. At eight acres per hour and three productive hours per day, the same acreage requires about 4.58 workable days. At 12 acres per hour and seven hours per day, it requires about 1.31.
Productive hours = remaining acres ÷ productive acres per hour.
Workable-day equivalents = productive hours ÷ productive hours available per day.
Record expected delays separately when they are absent from the rate. Avoid adding the same unloading delay twice. If conditions change, update both the field capacity and available hours rather than forcing yesterday’s assumptions into today’s schedule.
Check the bottleneck after the combine

A faster harvest rate only helps if the next stage can receive the crop. List the route from field to unloading, drying and storage. Then identify the stage with the smallest usable capacity during the same time window.
For an illustrative check, suppose incoming grain averages 20 tonnes per productive hour while handling capacity is 15 tonnes per hour. The queue grows by five tonnes for every overlapping hour at those rates. After four hours, it would reach 20 tonnes unless work pauses or another route takes the load.
This example is a flow calculation, not a recommended equipment specification. Moisture, crop type, operating hours and temporary holding space can change the constraint. Measure rates on a consistent moisture basis and include any time needed to clear a backlog.
The Canadian Grain Commission’s storage guidance explains why grain temperature and moisture need monitoring. It also advises checking aeration or drying times with the equipment provider for the commodity and bin. Topsoil moisture in a crop report is not grain moisture in storage.
Price the remaining job with explicit inclusions
Multiply the actual remaining acres by a written per-acre quotation. Our C$60 assumption applied to 110 acres gives C$6,600. The chart tests other hypothetical quotes so you can see the sensitivity without treating any one price as a market benchmark.
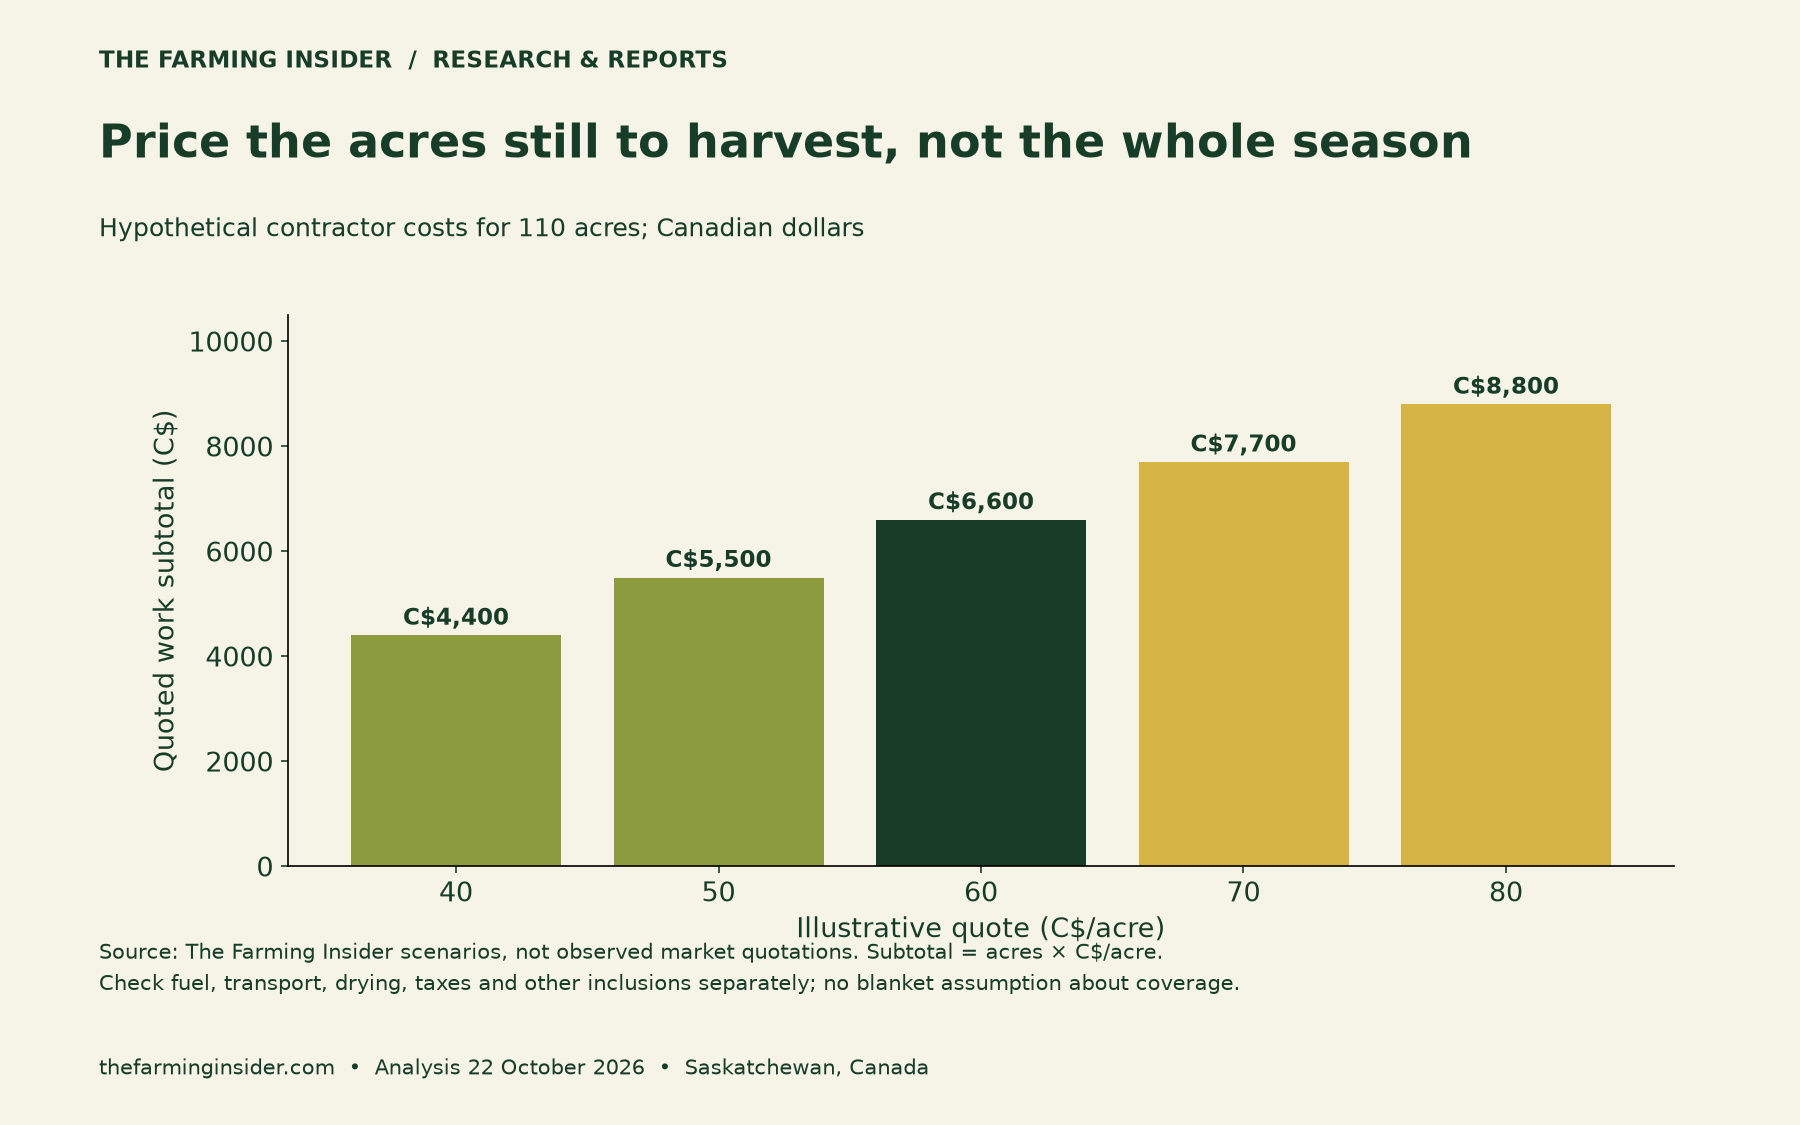
Before comparing offers, identify who provides fuel and whether the quoted work includes travel, unloading, drying or other services. Record taxes and exclusions separately. A lower headline rate may cover a different scope, so compare like with like.
If the quotation uses machine hours instead, use the billable-hour definition in that quotation. Do not multiply a productive cutting-hour estimate by a rate that charges for a broader period without adjusting the hours.
Copy this remaining-harvest worksheet
| Input or result | Illustrative value | Your evidence |
|---|---|---|
| Remaining acres | 110 | Current field list |
| Productive field capacity | 10 acres/hour | Machine records and rate definition |
| Required productive hours | 11 | Acres divided by rate |
| Daily productive window | 5 hours | Local conditions and crew availability |
| Workable-day equivalents | 2.2 | Before delays not included above |
| Contractor quotation | C$60/acre | Written scope, date and exclusions |
| Quoted work subtotal | C$6,600 | 110 × C$60; add excluded items separately |
| Handling and storage constraint | Farm-specific | Measured rates, moisture and available capacity |
Our fall harvest guide provides broader preparation context. Use this worksheet to add a dated, numerical work plan. Keep the assumptions alongside the result so another person can check or update it.
Methods and update notes
Analysis date: 22 October 2026. Charts one and two reproduce selected official percentages in original designs. Chart three applies the reported rates to separate equal-sized examples. Charts four and five use hypothetical farm inputs and are not forecasts.
We calculate before rounding. The 61.1% reduction uses (18 − 7) ÷ 18, while the 11-point advance uses 93 − 82. No area denominator is available in these selected figures, so we do not estimate provincial acres.
This is a planning framework, not a crop-priority rule or a prediction of harvest losses. Update remaining acres, local weather, grain condition, equipment availability and quotations before using the numbers for a decision.