




October 2026 cattle on feed placements fell about 12% year on year, yet the reported inventory increased during September. Both statements can be true. The key is to keep incoming cattle, outgoing cattle and the number present on a particular date separate.
Our reconciliation turns the USDA release into five reproducible charts and three downloadable CSV files. It shows why a monthly inventory increase can coexist with an annual decline. The accompanying blank farm worksheet uses the same accounting logic, without treating national figures as a stocking target or a price forecast.
What does the October release measure?
USDA NASS released its October Cattle on Feed report on 23 October 2026. The selected table covers US feedlots with capacity of at least 1,000 head. It measures September flows and inventory on 1 October, with corresponding 2025 values. It is not the complete US cattle herd.
The table below preserves the source unit: thousand head. Inventory is a stock at a date; placements, marketings and other disappearance are movements during a month. Keeping those definitions attached to the numbers prevents an apparently simple comparison from answering the wrong question.
| Measure, thousand head | 2025 | 2026 | Change |
|---|---|---|---|
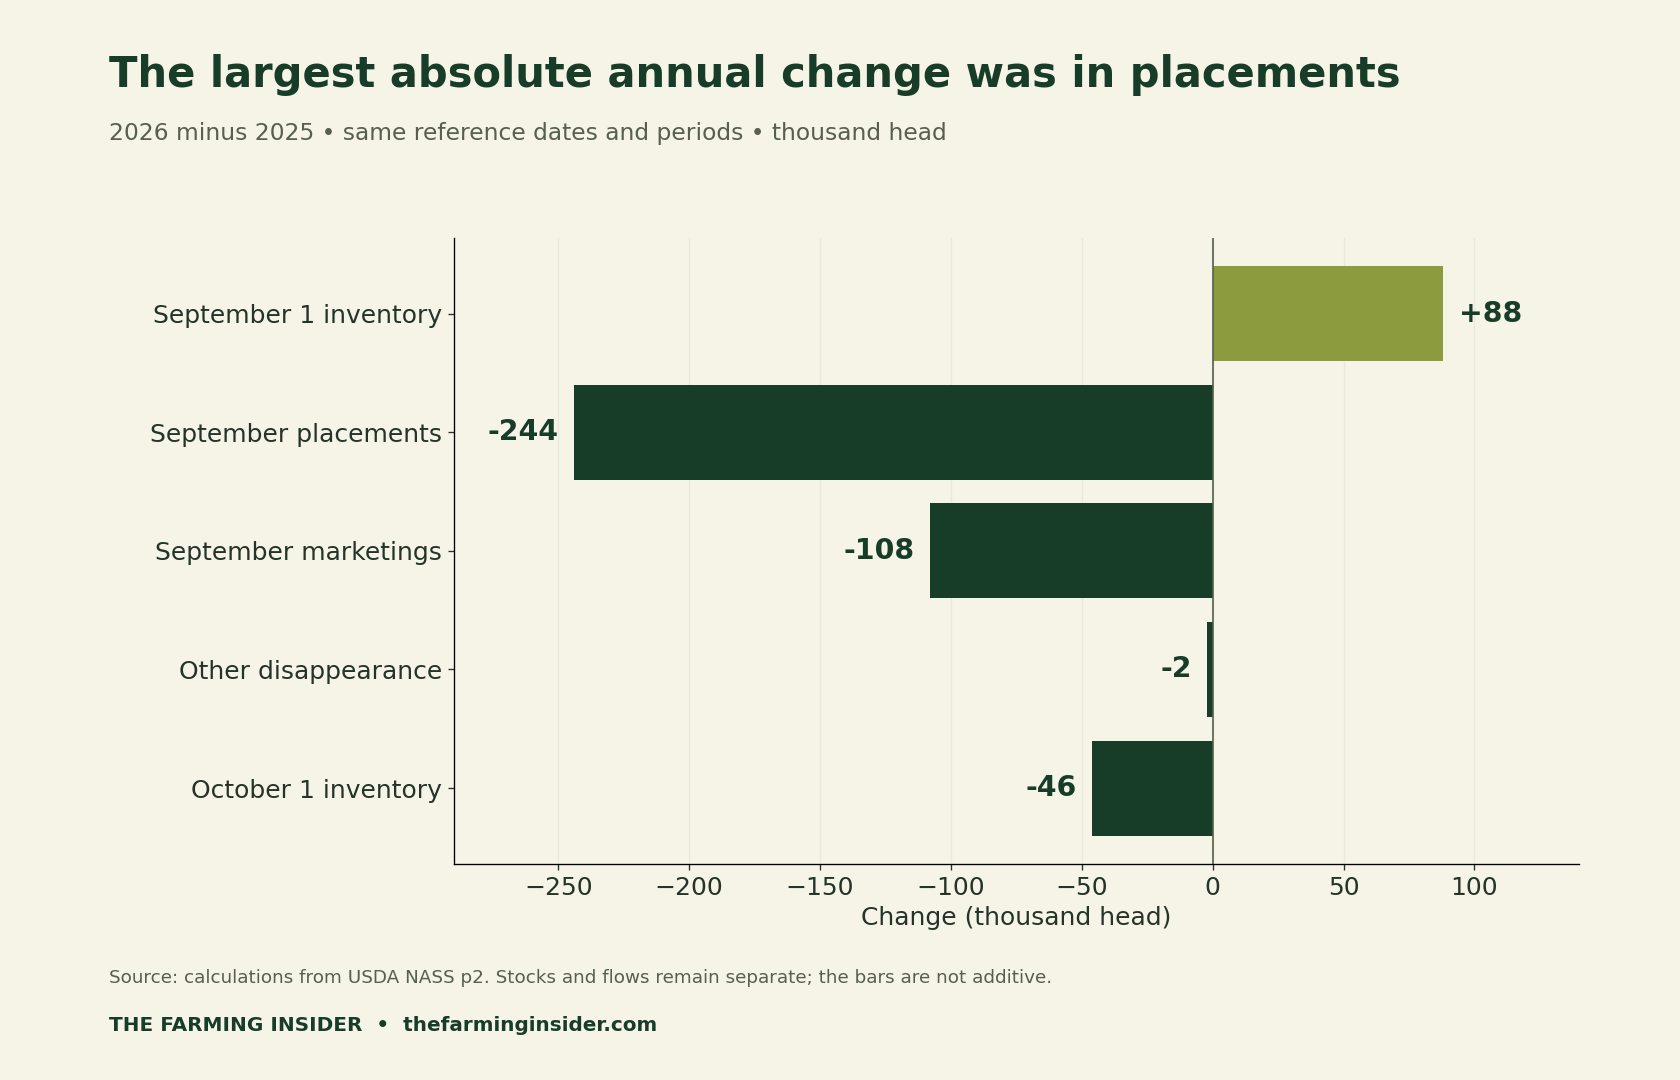
| September 1 inventory | 11,080 | 11,168 | +88 |
| September placements | 2,021 | 1,777 | −244 |
| September marketings | 1,632 | 1,524 | −108 |
| Other disappearance | 51 | 49 | −2 |
| October 1 inventory | 11,418 | 11,372 | −46 |
Reconcile the cattle on feed placements and departures
For 2026, the calculation is 11,168 + 1,777 − 1,524 − 49 = 11,372 thousand head. Opening inventory plus arrivals, less the two departure categories, equals closing inventory. Every value comes from the same version of the source table, so the calculation can be checked without mixing releases.
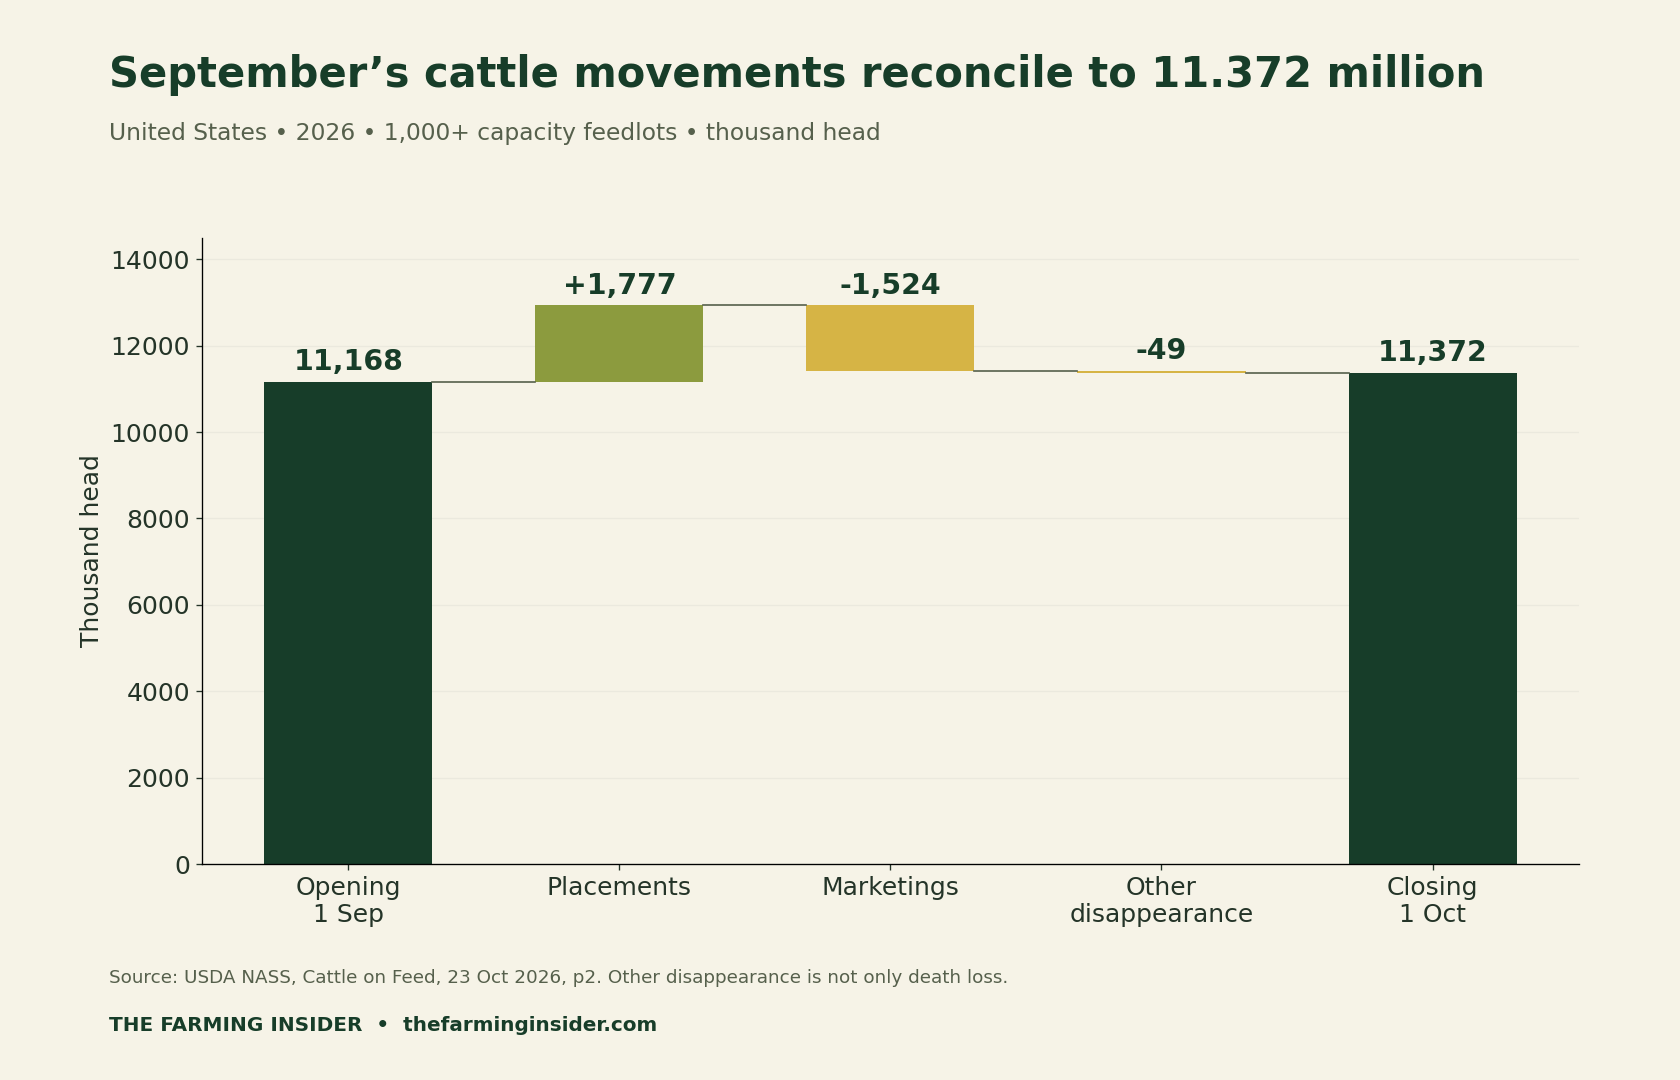
NASS defines other disappearance more broadly than deaths. It also includes movement to pasture and transfers to other feedlots. Calling all 49,000 head a mortality count would misstate the source. Farm records should likewise give different departure reasons their own clear categories.
Compare cattle on feed placements with marketings
From the unrounded table values, placements declined 12.07% and marketings 6.62%. The release rounds those changes to 12% and 7%. NASS describes both September flows as the lowest for that month in its series beginning in 1996. This concerns September totals, not a comparison across every month.
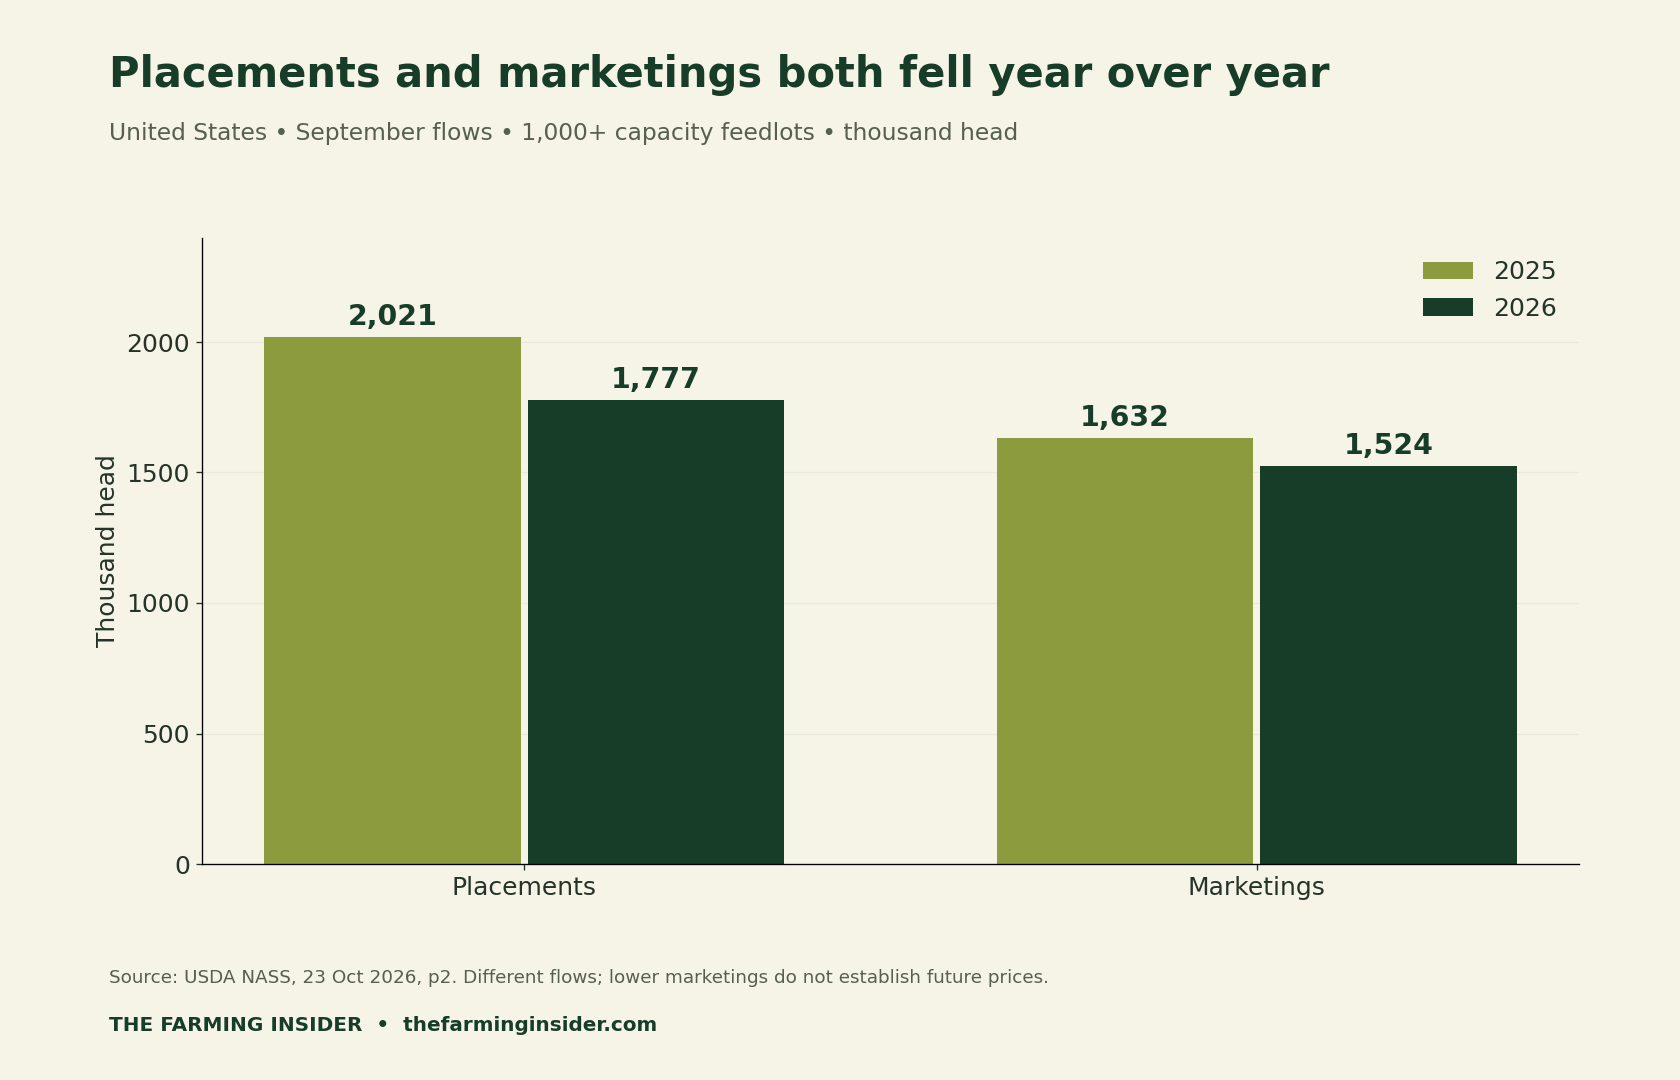
The percentage calculation is (2026 value ÷ 2025 value − 1) × 100. We calculate before rounding and retain the full result in the CSV. A percentage change uses the earlier observation as its denominator; it is not a percentage-point change or a share of the total herd.
Why can monthly inventory rise while annual inventory falls?
The 1 October 2026 inventory was 204,000 head above 1 September 2026, a 1.83% increase. Against 1 October 2025, it was 46,000 head lower, a 0.40% decline. These comparisons start from different dates, so they describe different changes without contradicting each other.
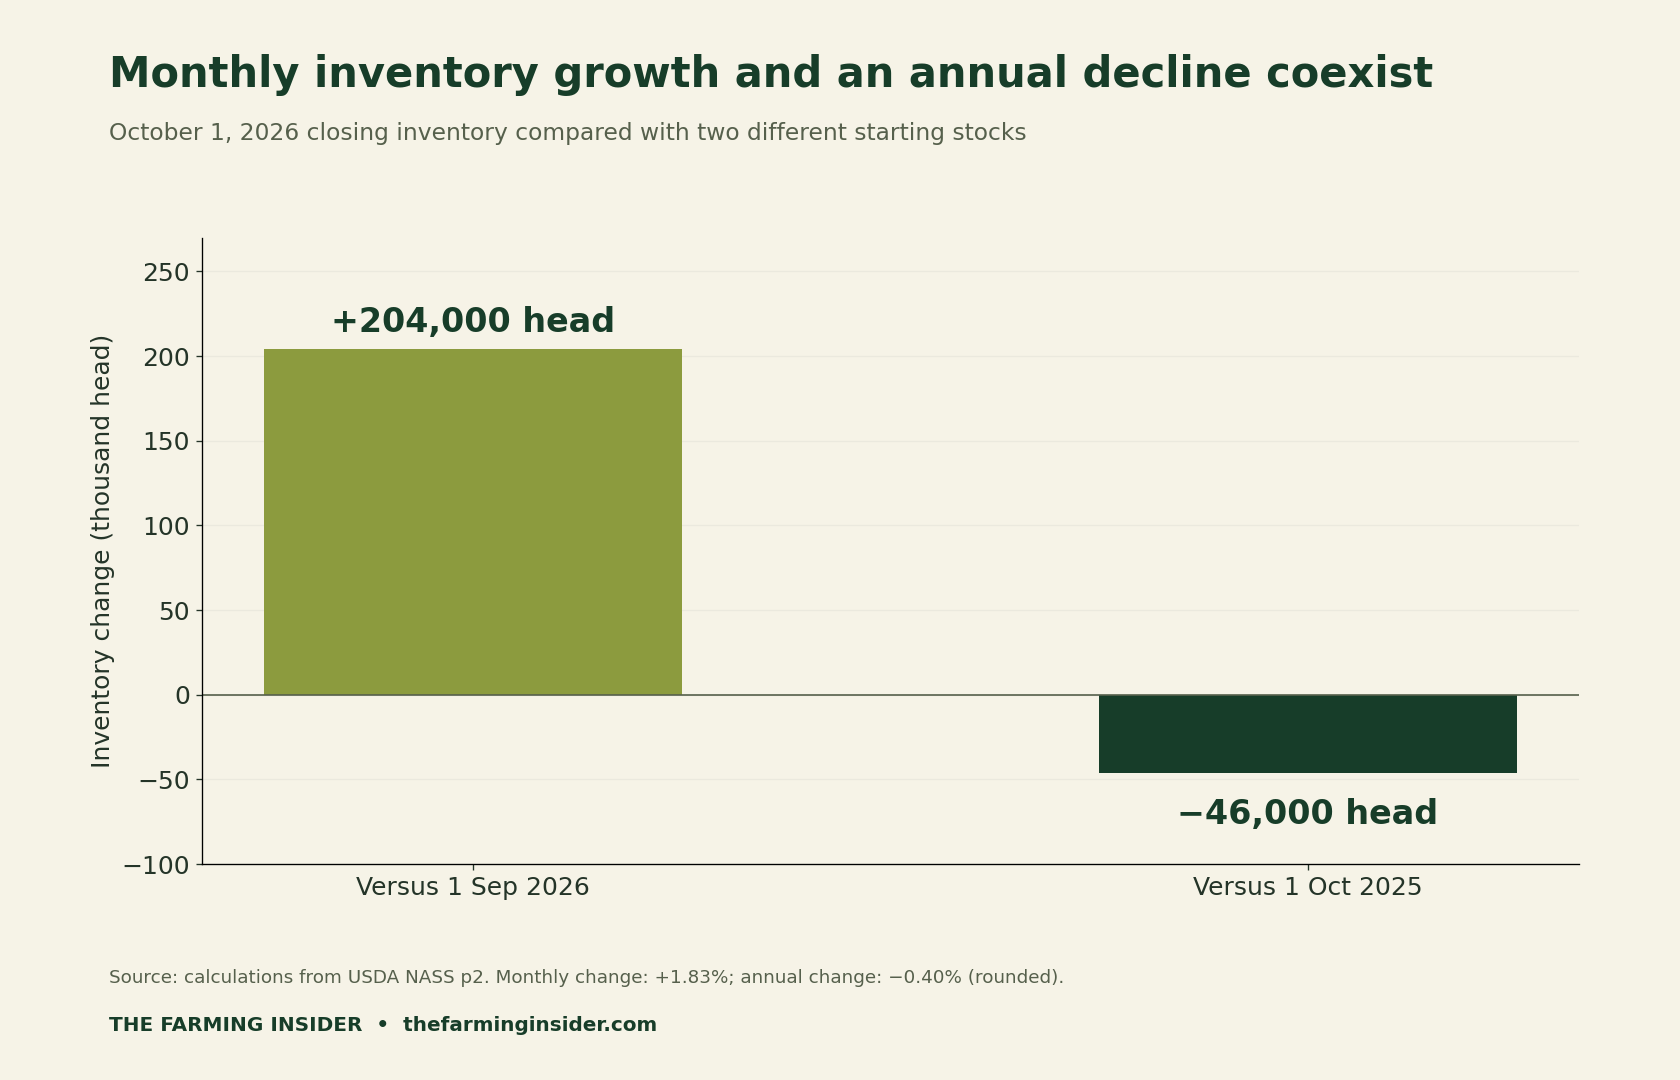
A useful reading habit is to write the reference date beside every change. “Up this month” and “down on last year” are incomplete labels unless the audience knows the starting points. The waterfall explains the month’s accounting identity; the annual comparison supplies a separate historical benchmark.
Placement weights add context, not a shipment calendar
The report also divides September placements into six weight groups. Our chart retains those published boundaries and counts. Adding the six groups gives 1,777 thousand head, matching total placements. That check helps catch transcription errors before the data are reused.
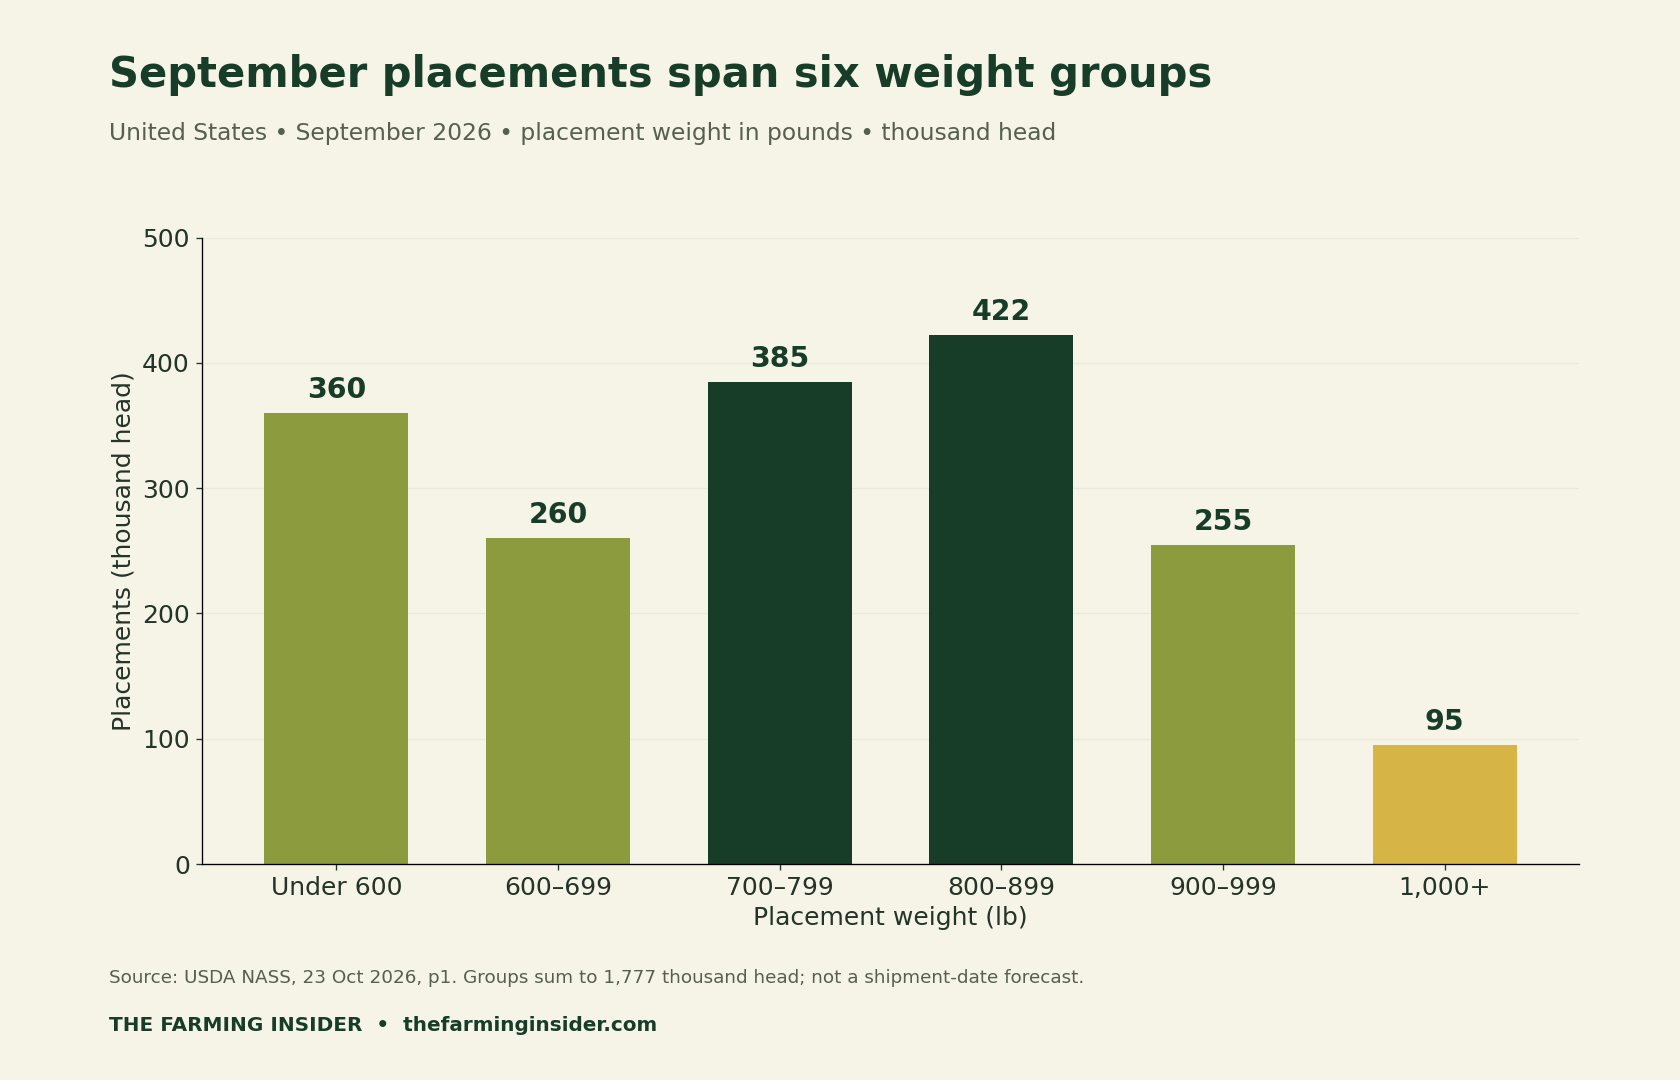
A weight distribution is not an individual farm’s sale schedule. It cannot establish local availability, feeding performance, slaughter timing or profitability. Those decisions need additional operational evidence. This article makes no cattle-purchase recommendation and does not infer herd rebuilding from the selected figures alone.
Apply the reconciliation method to your own records
Keep farm entries separate from the national benchmark. The blank worksheet uses individual head, while the published source table uses thousand head. Record a consistent period, opening stock, arrivals, sales or marketings, other departures and the independently counted closing stock.

Calculate expected closing stock as opening stock plus arrivals minus sales and other departures. Next subtract that calculated balance from the independently counted closing stock. A non-zero difference is an unresolved reconciliation question, not evidence that a national estimate is wrong or that a stocking change is needed.
Check dates, transfer records, duplicated entries and the definition of each departure category before drawing conclusions. Keep the original entries and document corrections. Our livestock record-management article provides broader context; this worksheet does not recommend a particular software product.
Transform Your Agribusiness
Unlock your farm's potential with expert advice tailored to your needs. Get actionable steps that drive real results.
Get StartedDownload the source data and blank farm worksheet
- National stock-flow values and calculated annual changes (CSV): five rows in thousand head, with source and coverage.
- September placement weight-group data (CSV): six groups and calculated shares.
- Blank farm inventory reconciliation (CSV): five empty period rows using individual head.
Methods, versions and limitations
Analysis date: 29 October 2026. We retained the original PDF and transcribed the selected table and placement-weight counts. Both years’ stock-flow identities reconcile at the published precision. The weight groups match the placement total. All changes are descriptive arithmetic; no statistical significance test or confidence interval for a difference was calculated.
NASS notes survey error and possible revisions. Preserve the release date when comparing versions, and refresh inputs when a later report changes an estimate. No local farm records, prices, margins or future supply outcomes were measured here. Explore related Livestock Management reporting.
Suggested citation: The Farming Insider (29 October 2026), October 2026 Cattle on Feed Placements: Reconcile Inventory, analysis and downloadable reconciliation data. Cite USDA NASS directly for its estimates and retain the source unit and reference dates when reusing them.


