




A dairy supplement budget should start with the whole ration. Southern Dairy Hub’s latest weekly snapshot shows why: the Future herd had less silage and in-shed feed, alongside more pasture and slightly more total allocation. The supplement line alone cannot establish a cost or profit advantage.
This report turns that distinction into a practical New Zealand budgeting worksheet. Five original charts separate observed allocations from hypothetical prices, feed losses and revenue thresholds. All dollar amounts in our examples are New Zealand dollars, not current market quotations.
Dairy supplement budget: compare the whole ration
The 16 October HubWatch, posted on 15 October, reports data as at 14 October 2026. Its source table lists the following allocations, in kilograms of dry matter per cow per day.
| Component | Standard herd | Future herd |
|---|---|---|
| Pasture | 10.7 | 15.9 |
| Silage | 2.9 | 0.4 |
| In-shed feed | 4.4 | 2.2 |
| Total allocation | 18.0 | 18.5 |
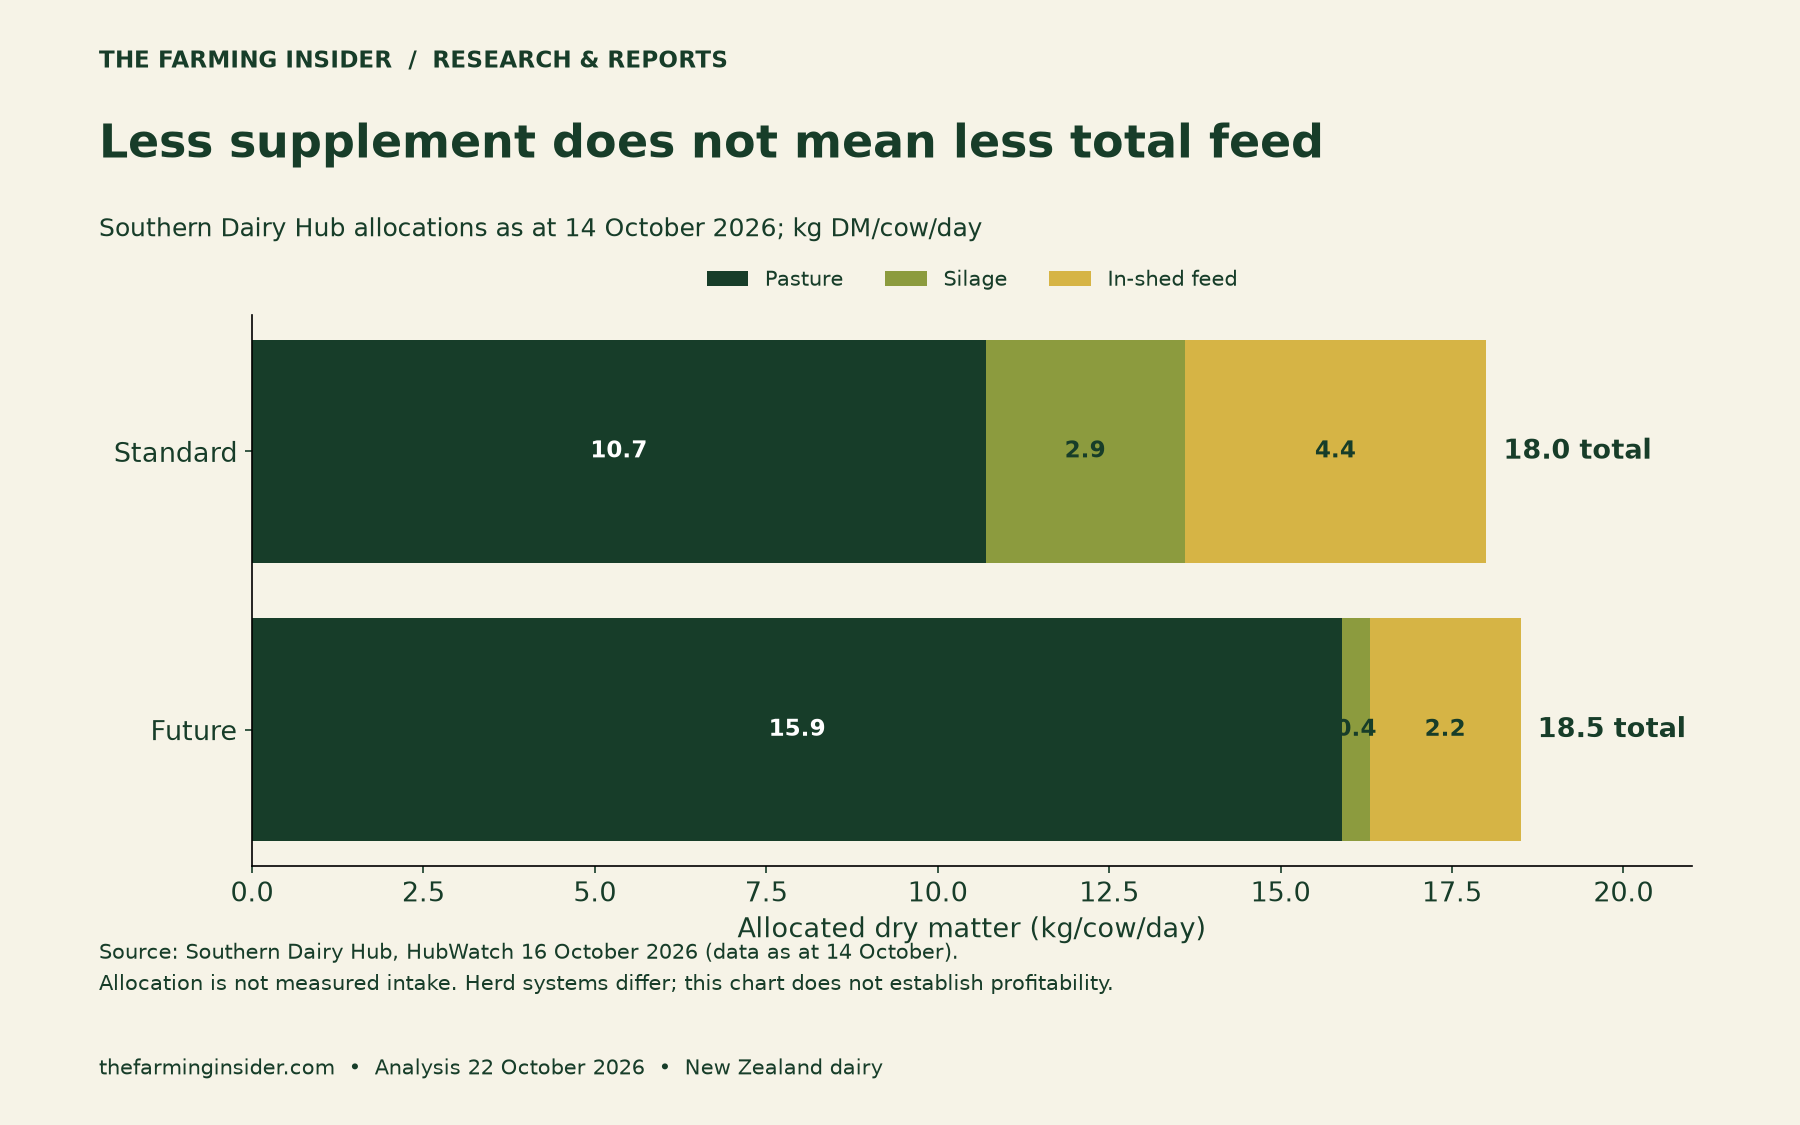
Silage plus in-shed feed totals 7.3 versus 2.6 kg DM/cow/day. That is 4.7 kg less supplement, or about 64.4% less. However, pasture allocation is 5.2 kg higher and total allocation is 0.5 kg higher. Allocation is not measured intake.
The systems also differ in peak stocking rate, genetics and wintering approach. Their comparison is not a controlled test of supplement alone. The 15 October Spring Newsletter says the financial comparison was still under assessment. We therefore make no claim that one herd had greater profit.
First convert wet tonnes to dry matter
A low price per tonne can be misleading when feeds contain different amounts of water. First record whether the quote uses fresh weight or dry matter. Then use the tested dry-matter percentage for that feed batch.
Suppose Feed A costs NZ$120 per delivered wet tonne and contains 30% dry matter. Each tonne contains 300 kg DM, so its delivered cost is NZ$0.40/kg DM. Feed B at NZ$360 per wet tonne and 90% dry matter also costs NZ$0.40/kg DM.
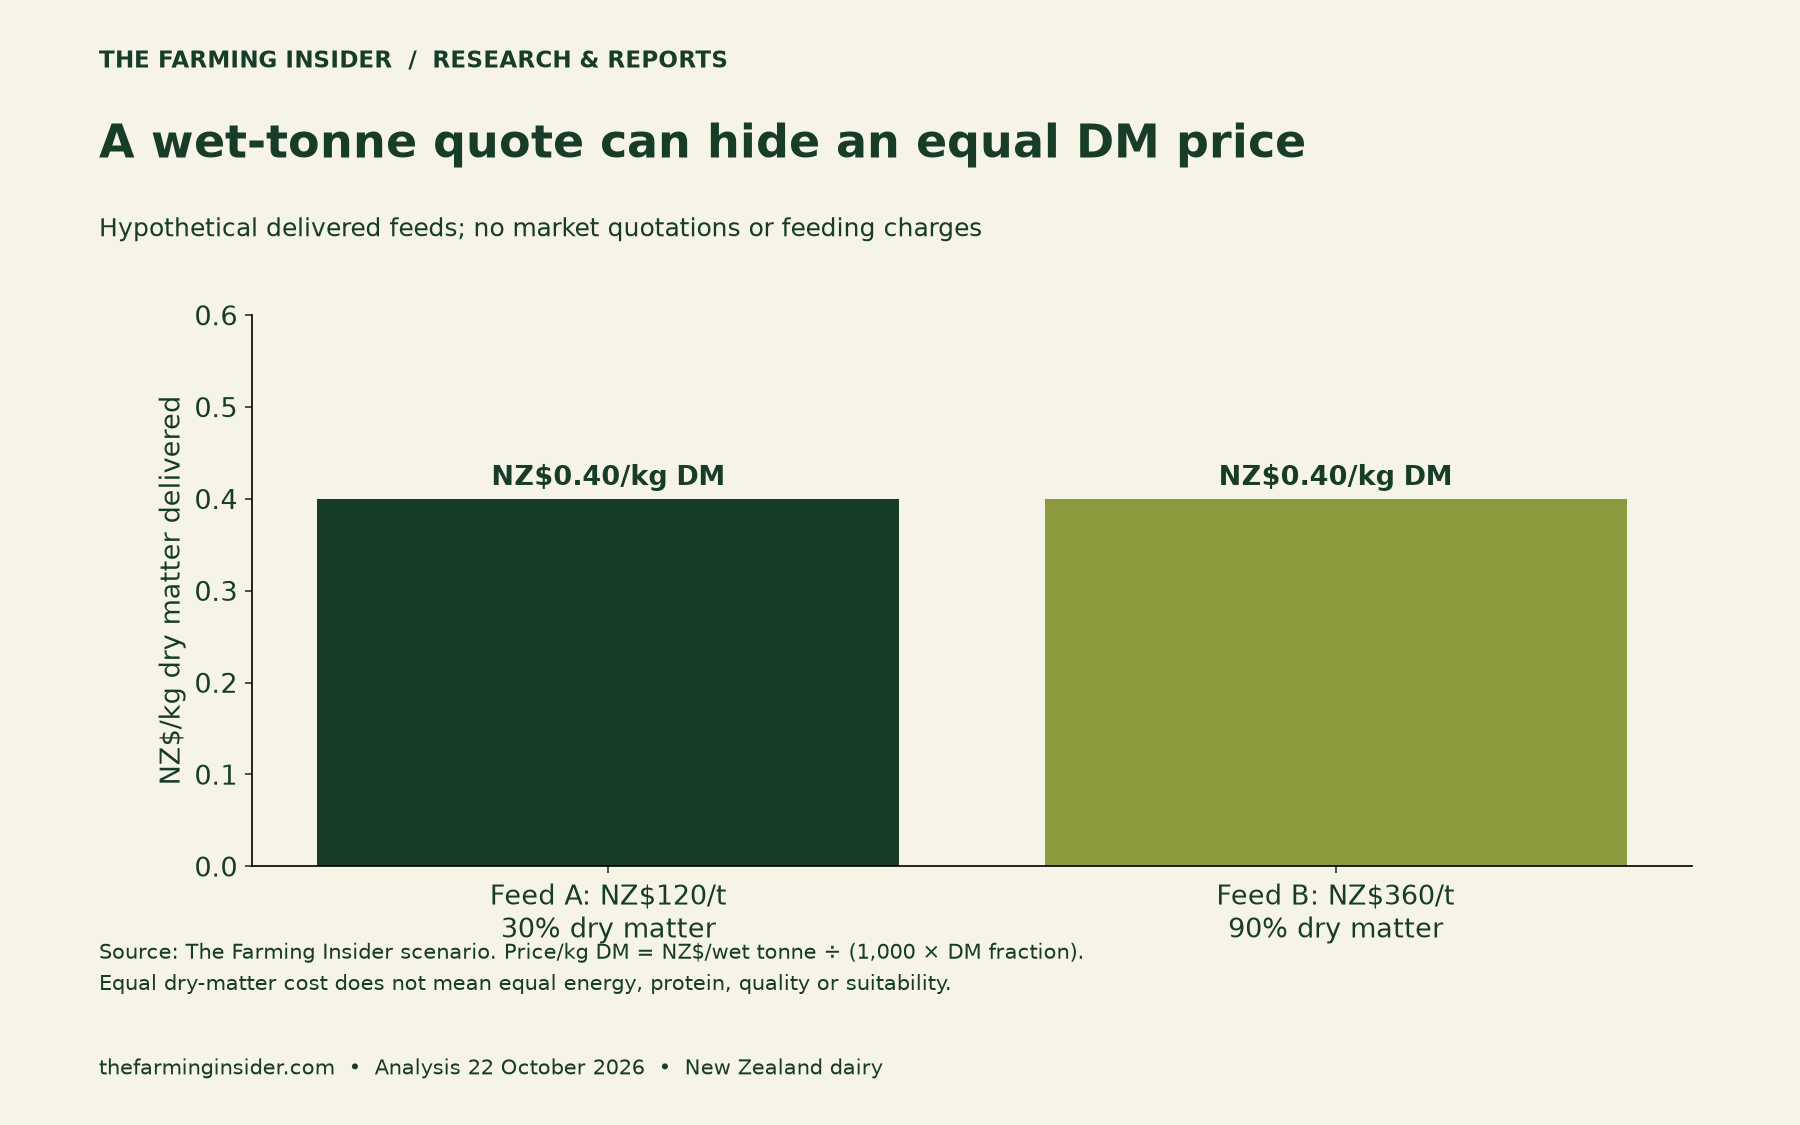
Delivered NZ$/kg DM = delivered NZ$/wet tonne ÷ (1,000 × dry-matter fraction).
These chosen examples illustrate the calculation; they do not describe specific products or supplier offers. Equal dry-matter cost also does not establish equal feed value. Energy, protein, fibre, quality and suitability still matter.
DairyNZ’s nutrition reference sets out costing per kilogram of dry matter eaten and per unit of energy. Its worked prices are historical examples. Use the method with fresh quotations and feed-test results.
Next allow for feed that is not eaten
Delivered dry matter and consumed dry matter are different denominators. If a hypothetical feed costs NZ$0.40/kg DM delivered, the cost rises when less of it is utilised. At 95% utilisation, it is about NZ$0.421/kg DM eaten. At 75%, it is about NZ$0.533.
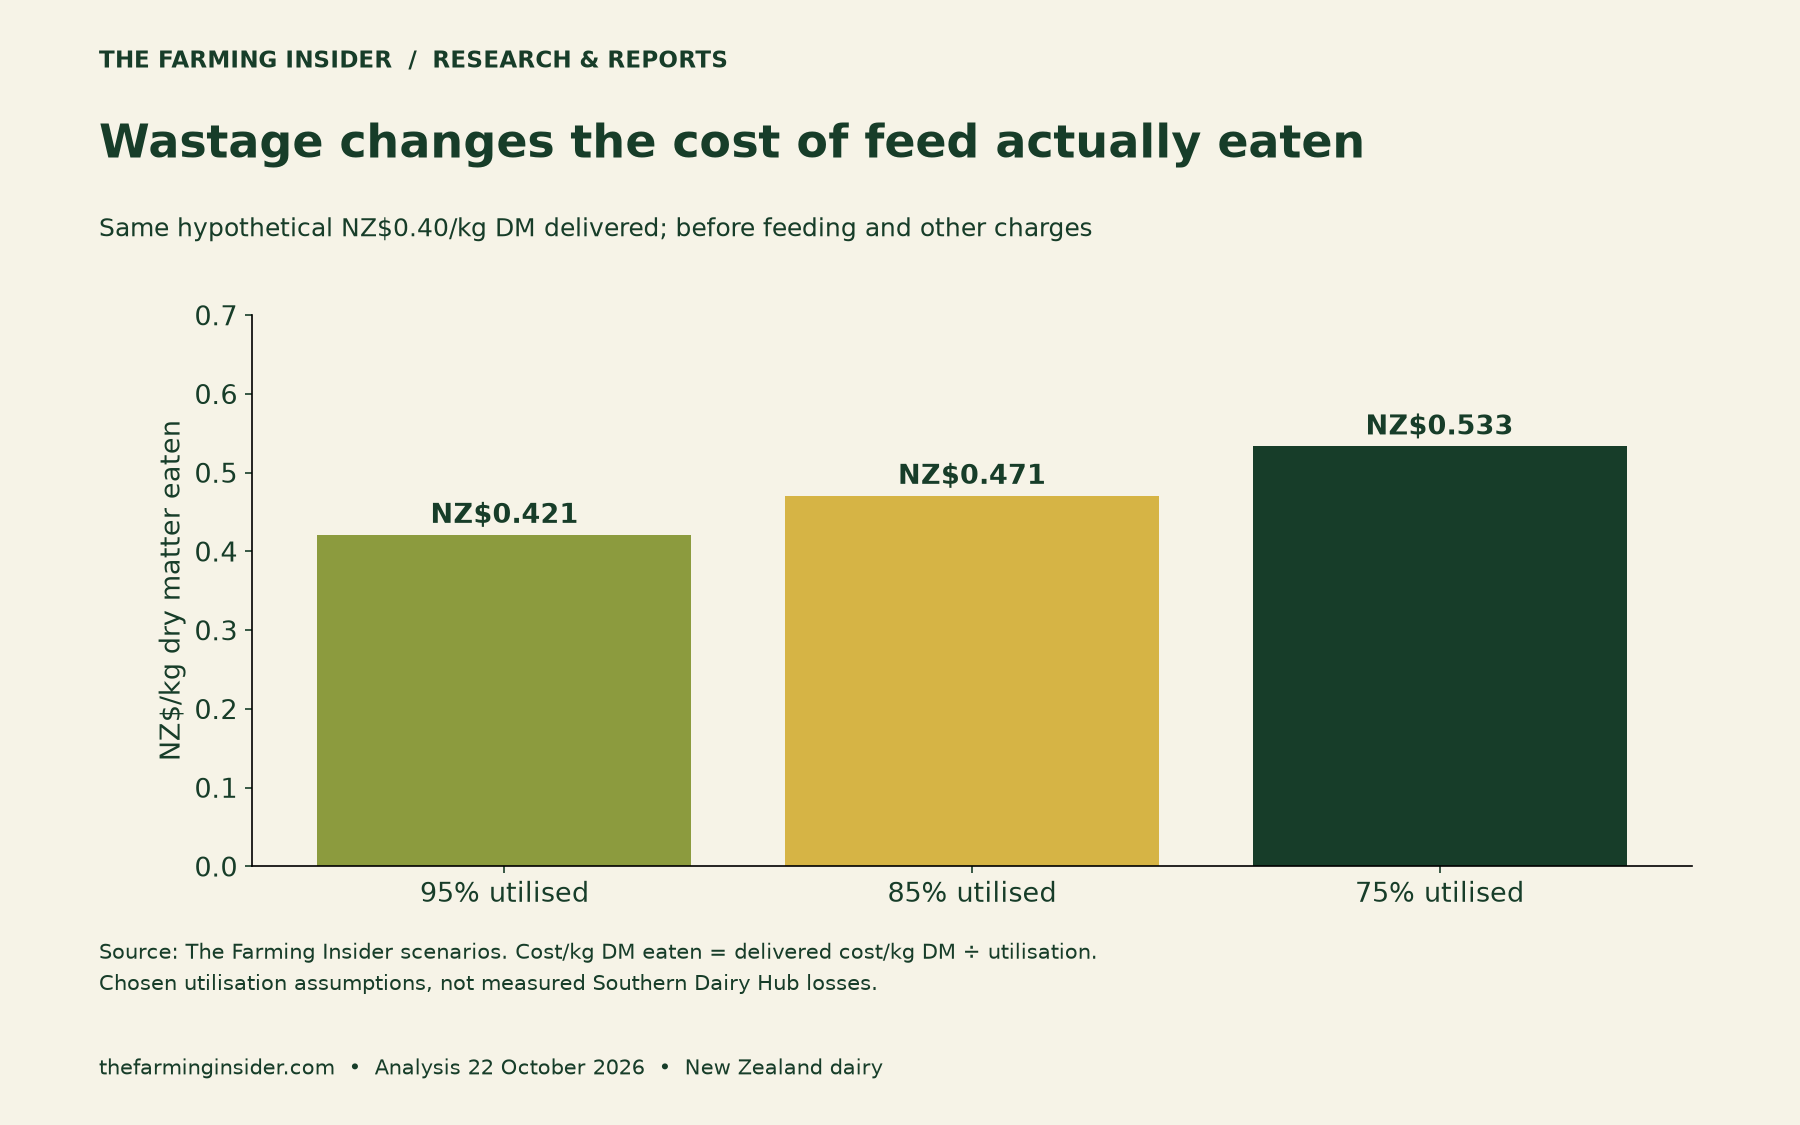
NZ$/kg DM eaten = delivered NZ$/kg DM ÷ utilisation fraction.
The chart’s utilisation rates are selected scenarios, not measured losses at Southern Dairy Hub. Storage and feeding methods can affect the result. Record your own evidence and keep the loss definition clear.
For example, if separate storage and feeding losses are each 10% of the amount entering that stage, combined utilisation is 0.9 × 0.9 = 81%. It is not automatically 80%. If your records already measure total loss, use that total without counting either stage again.
Keep transport, labour, machinery and other feeding expenses visible too. A delivered price may include freight but exclude distribution around the farm. Write down what each quotation covers before comparing offers.
Transform Your Agribusiness
Unlock your farm's potential with expert advice tailored to your needs. Get actionable steps that drive real results.
Get StartedBuild a whole-ration cost scenario

Now assign an explicit cost basis to every component, including pasture. For illustration only, price each allocated kilogram of pasture at NZ$0.20, silage at NZ$0.35 and in-shed feed at NZ$0.50. Applying those assumptions to the reported allocations gives NZ$5.355 and NZ$4.42 per cow per day.
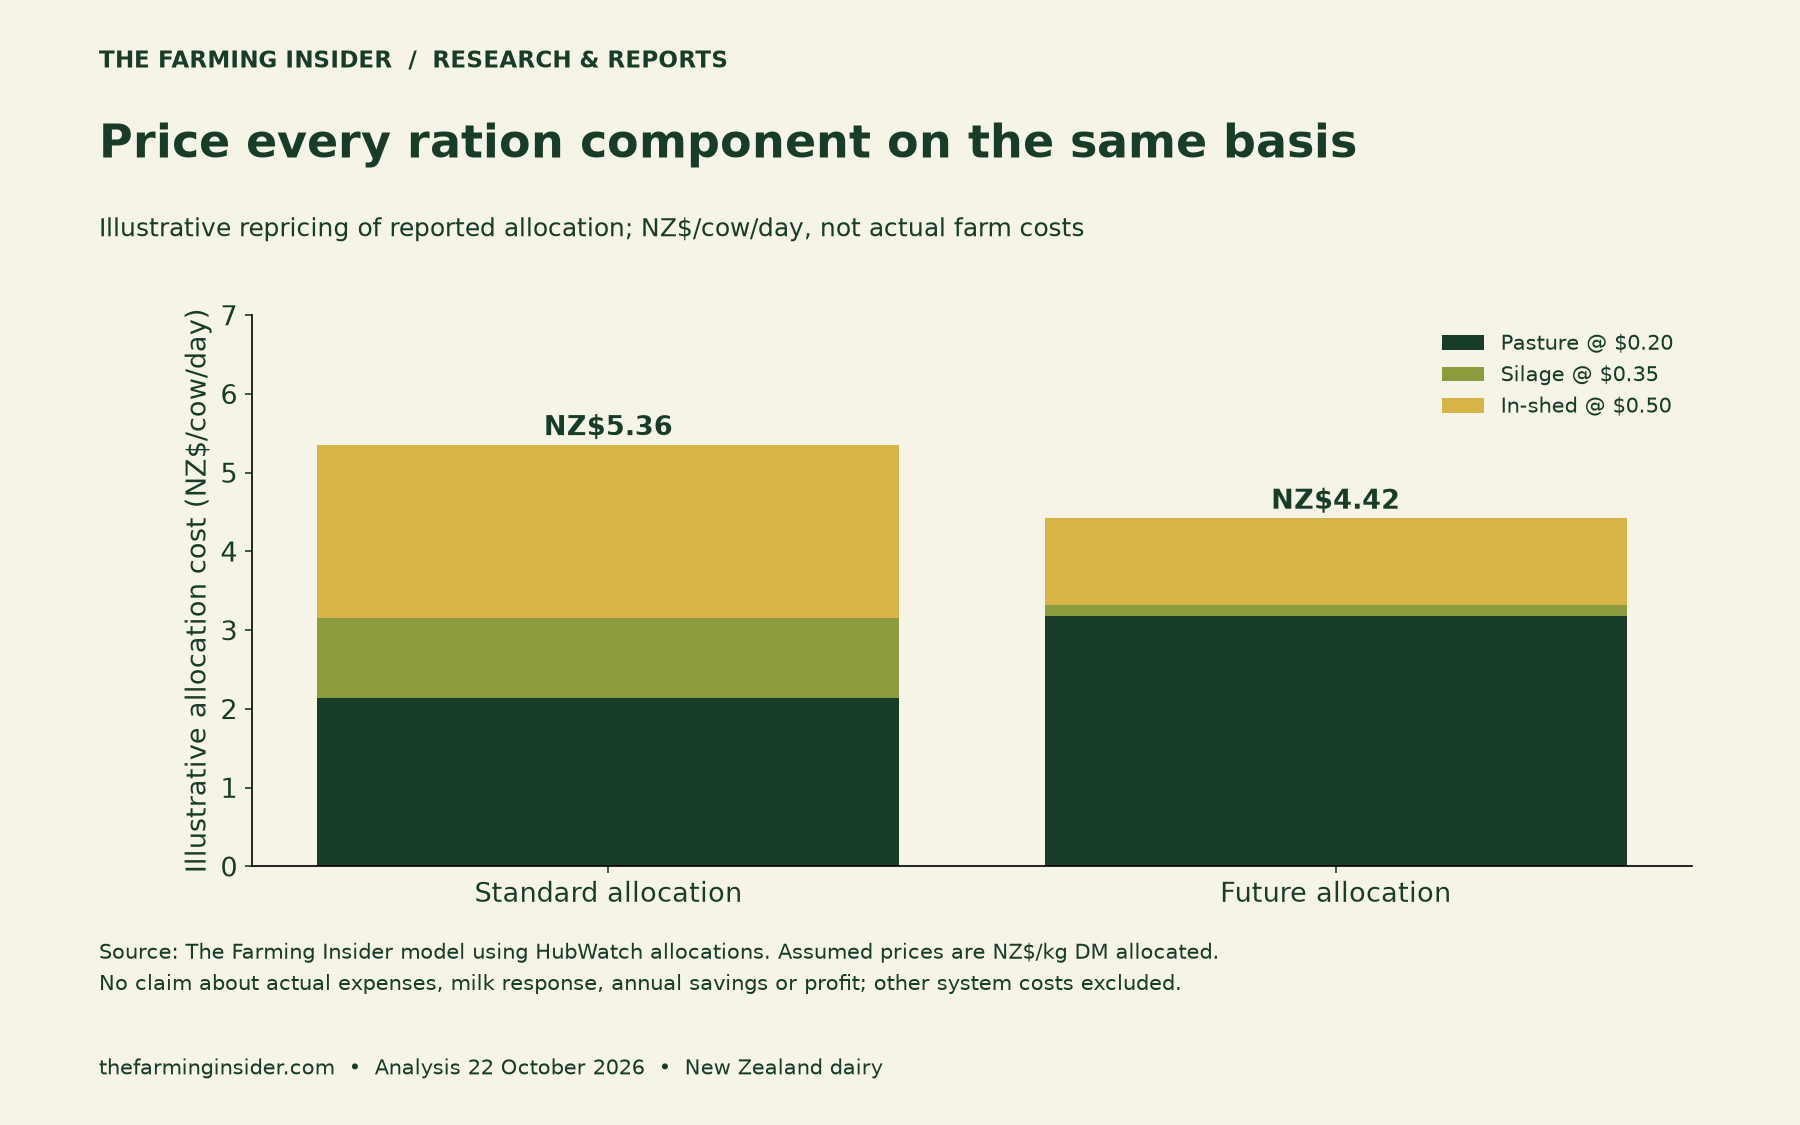
The displayed figures round to NZ$5.36 and NZ$4.42. This is an arithmetic repricing exercise, not the Hub’s actual cost comparison. It excludes milk response and other system costs, so the difference is not profit or a verified saving.
Choose a consistent basis when adapting the example. If the amounts describe allocation, use costs per unit allocated. If you instead build a consumed-feed budget, convert quantities and costs to the eaten basis together. Do not apply wastage twice.
Also distinguish a cash budget from an economic comparison. Purchased feed can require an immediate payment. Home-grown feed may involve costs incurred earlier, stored inventory and an alternative use. Keep those entries separate so the worksheet answers the question you intended.
Test the extra milk needed to cover an extra cost
A further check asks how much additional milk revenue would cover a chosen additional feed cost. Suppose the total incremental cost is NZ$0.60 per kg DM fed. At a net marginal value of NZ$10 per kg of milksolids, the immediate revenue threshold is 0.06 kg, or 60 grams of milksolids per kg DM fed.
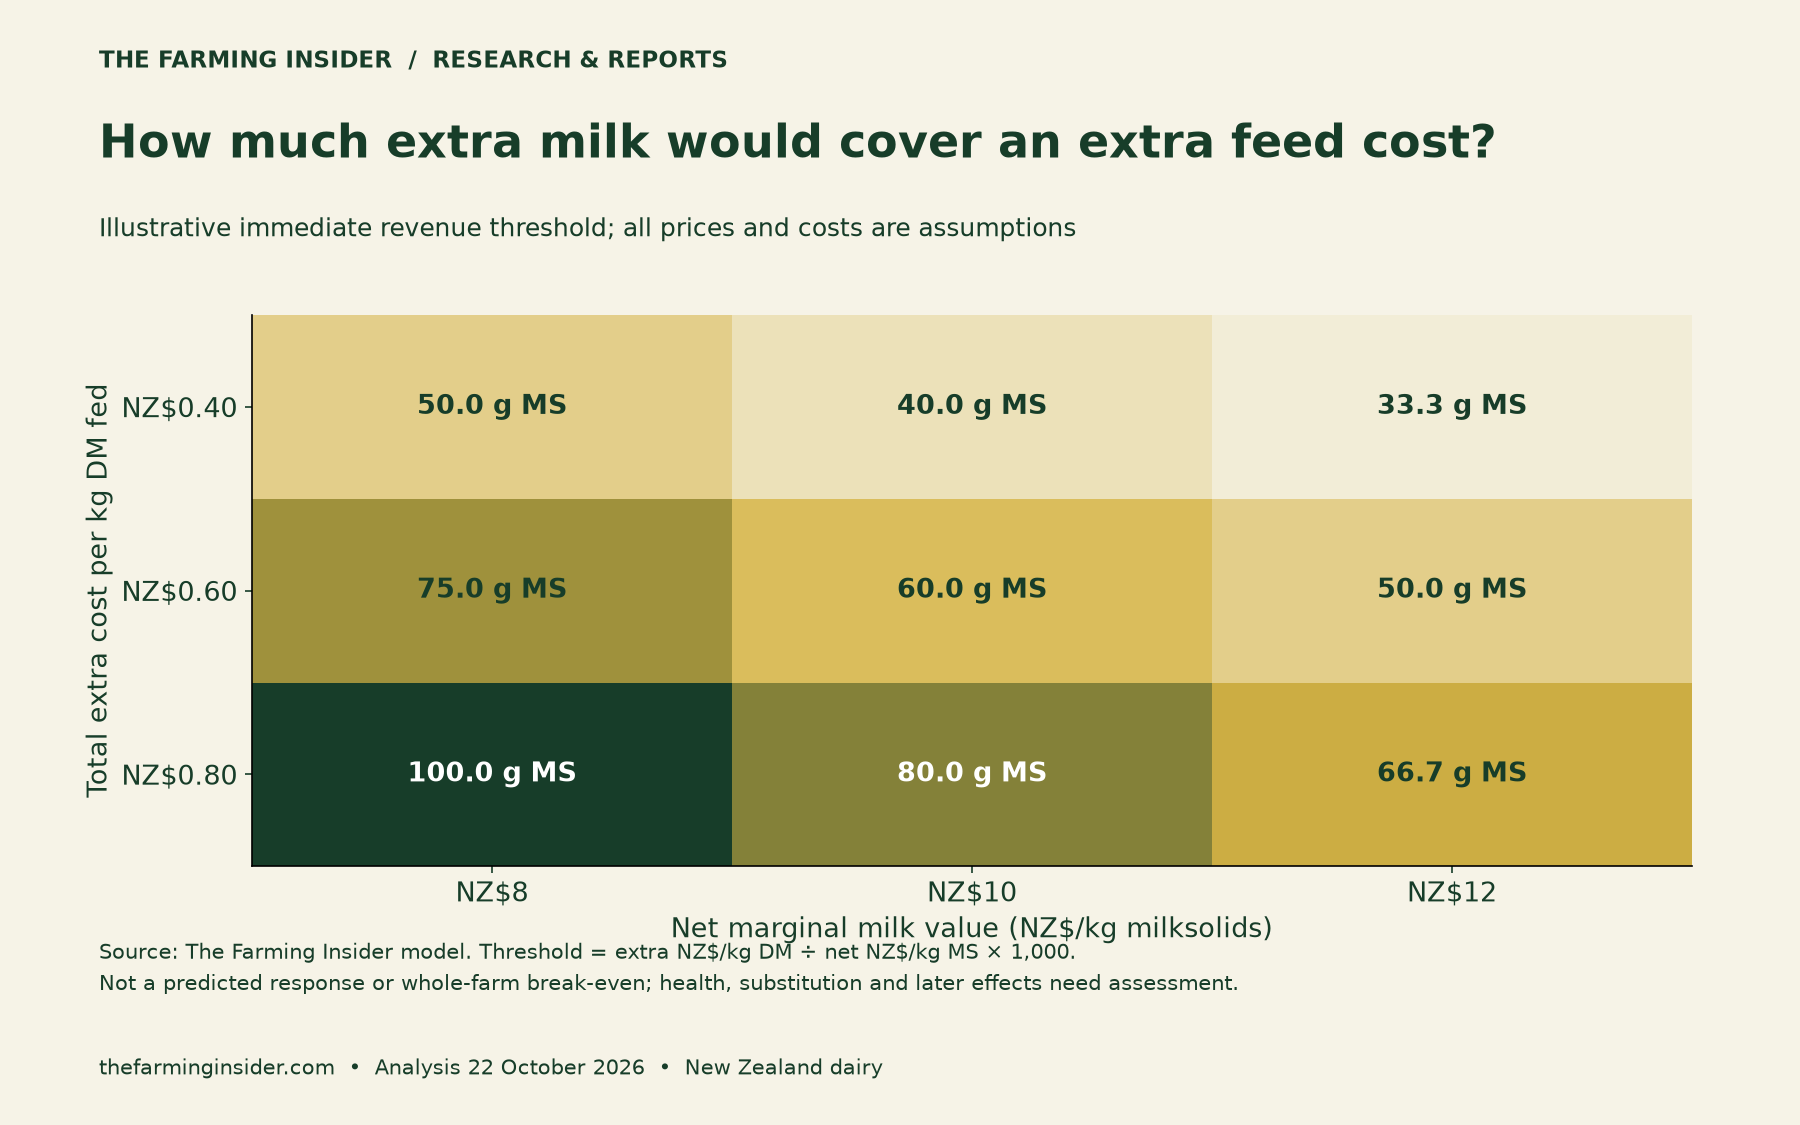
Required extra g MS/kg DM fed = total extra NZ$/kg DM fed ÷ net marginal NZ$/kg MS × 1,000.
This threshold is not a forecast of the cow’s response. It also does not capture later production, body condition, health, reproduction or pasture substitution. Include relevant extra expenses in the cost side, and use the net value of additional milk on the revenue side.
The DairyNZ supplement price calculator offers a more detailed comparison using farm and feed inputs. Its guidance says it is not a ration balancer. Review the feeding plan with your adviser rather than treating a simple price threshold as a complete ration recommendation.
Copy this dairy supplement budget worksheet
| Entry | Record or calculation |
|---|---|
| Feed and supplier | Product, batch, quotation date and inclusions |
| Delivered price | NZ$/wet tonne, with freight treatment stated |
| Dry matter | Test result as a fraction; 30% becomes 0.30 |
| Delivered cost per kg DM | Price ÷ (1,000 × DM fraction) |
| Utilisation | Evidence and definition for total losses |
| Cost per kg DM eaten | Delivered DM cost ÷ utilisation fraction |
| Other feeding expenses | Labour, machinery and other relevant costs |
| Whole ration | Pasture, silage and other feed on one consistent basis |
| Decision check | Feed quality, expected response, cash timing and system constraints |
Our dairy cattle feeding guide provides broader management context. Keep this worksheet beside your feed tests and quotations so another person can trace each assumption.
Methods, dates and limits
Analysis date: 22 October 2026. The latest HubWatch listing checked showed the 16 October edition, with observations dated 14 October. Chart one uses selected source allocations. Charts two to five are original scenarios, not observed market prices or measured economic outcomes.
We calculate before rounding. We do not annualise the weekly snapshot, infer whole-herd totals from inconsistent stock-count rows, or convert the source’s weekly-average milk label into an assumed daily series. Refresh allocations, feed tests, prices and farm conditions before making a current budget.


