



UK cereal demand needs a closer reading than a single headline. A falling total can contain a growing component, while different processing channels move in opposite directions. Before using a market report in a buyer discussion, identify the crop, reporting period, measure and comparison base.
This guide adds three substantive charts, a buyer-enquiry infographic and four free CSV tools. It separates selected reported facts from original arithmetic and blank planning questions. Research checked on 13 November 2026; this is a framework for investigation, not a recommendation to change crops.
UK cereal demand: read total wheat and origin separately
The AHDB Arable Market Report dated 9 November 2026 describes July–September usage. Its rounded comparisons show total wheat milled down 5% year on year, home-grown wheat use up 1% and imported wheat use down 21%. Each change uses its own prior-period base.
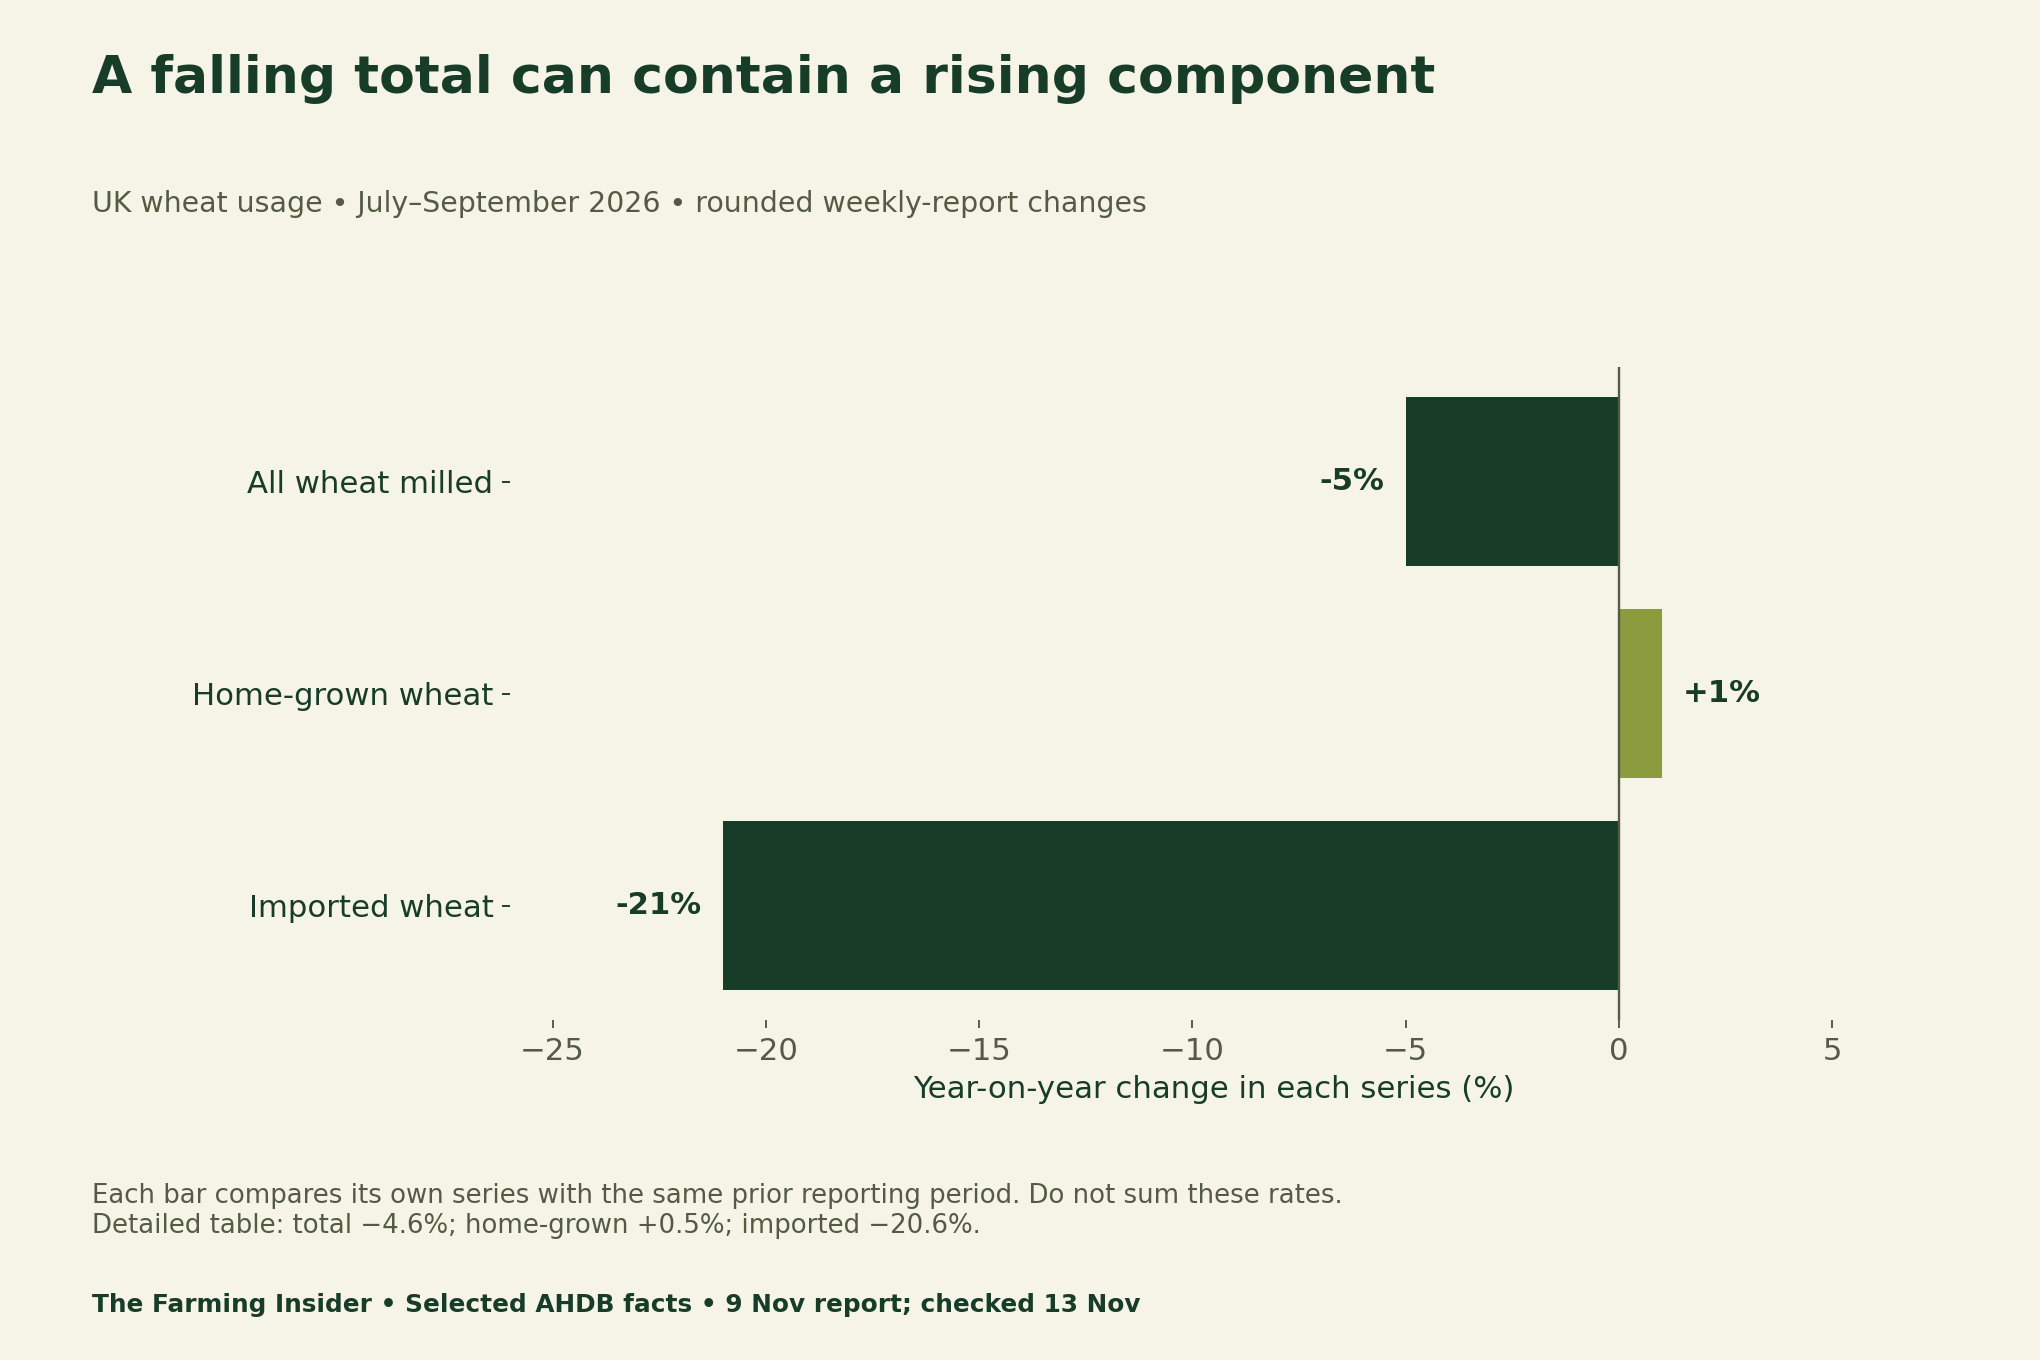
For example, adding +1% and −21% would not calculate the total change. A smaller component can fall sharply without producing an equally sharp fall in the combined total. The starting quantities determine each component’s weight. A percentage change alone does not supply those weights.
Use matching quantities when calculating a share
The underlying usage page, updated 5 November, lists 1,077.8 thousand tonnes of home-grown wheat and 269.7 thousand tonnes of imported wheat in the relevant table. They sum to 1,347.5 thousand tonnes. Dividing each by that matching total gives approximately 80.0% and 20.0%.
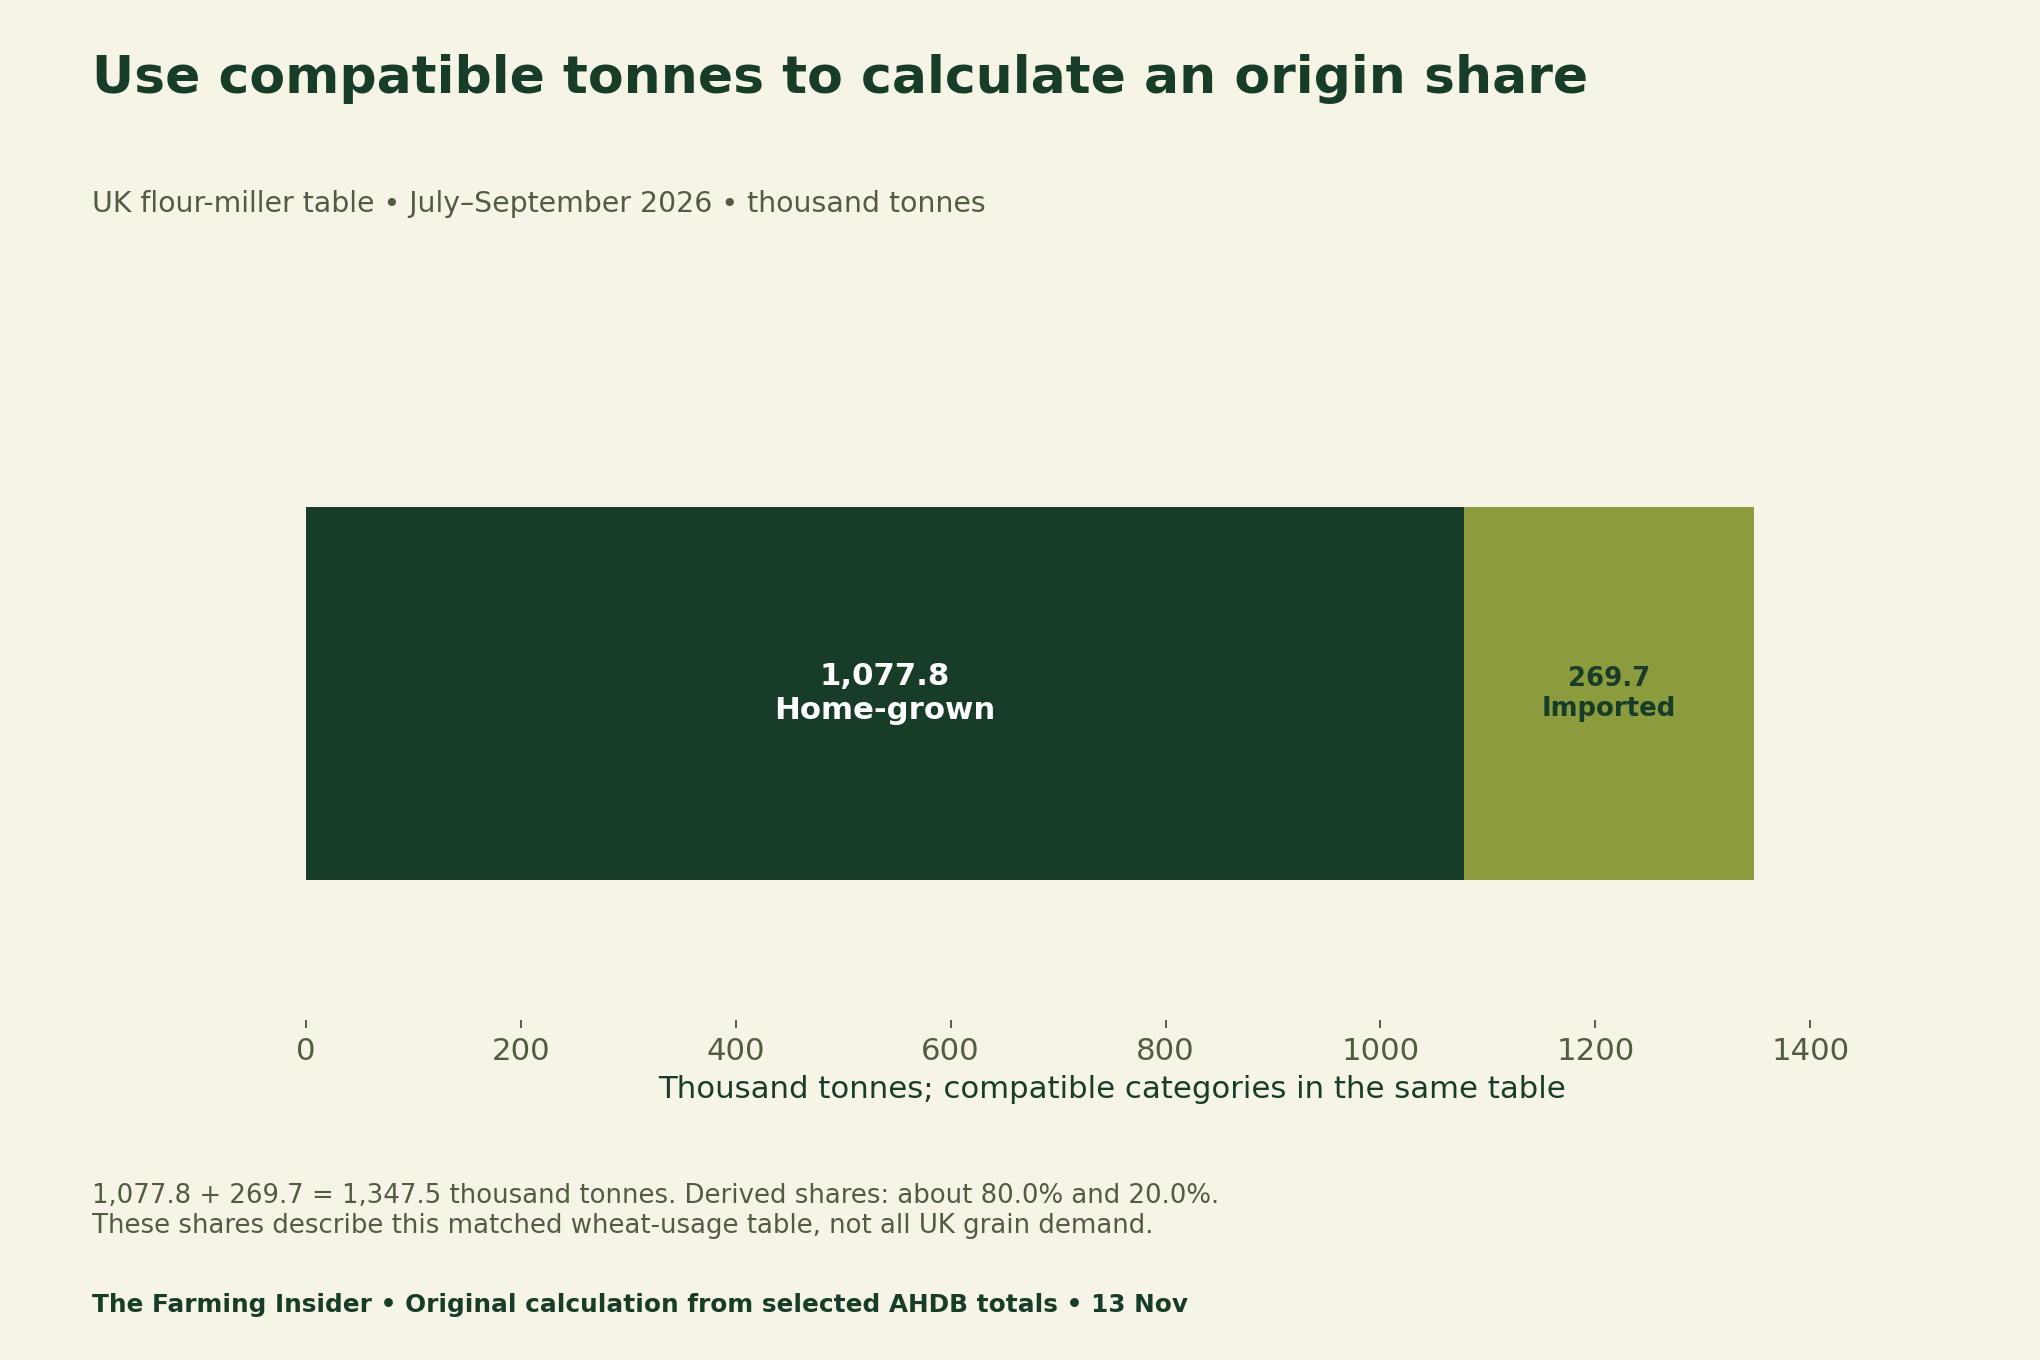
That calculation answers a narrow composition question. It does not establish a buyer’s current sourcing policy, next season’s requirement or the share available to a particular grower. Keep the table scope attached when reusing the numbers. Also distinguish tonnes used from tonnes in stock or tonnes produced.
Barley and oats have different channel evidence
The weekly report describes barley usage by brewers, maltsters and distillers falling 13%, while oat millers used 7% more oats. The detailed table gives −12.8% and +7.2%. These series cover different processing channels and different prior-period quantities; they cannot be summed into one cereal-demand change.
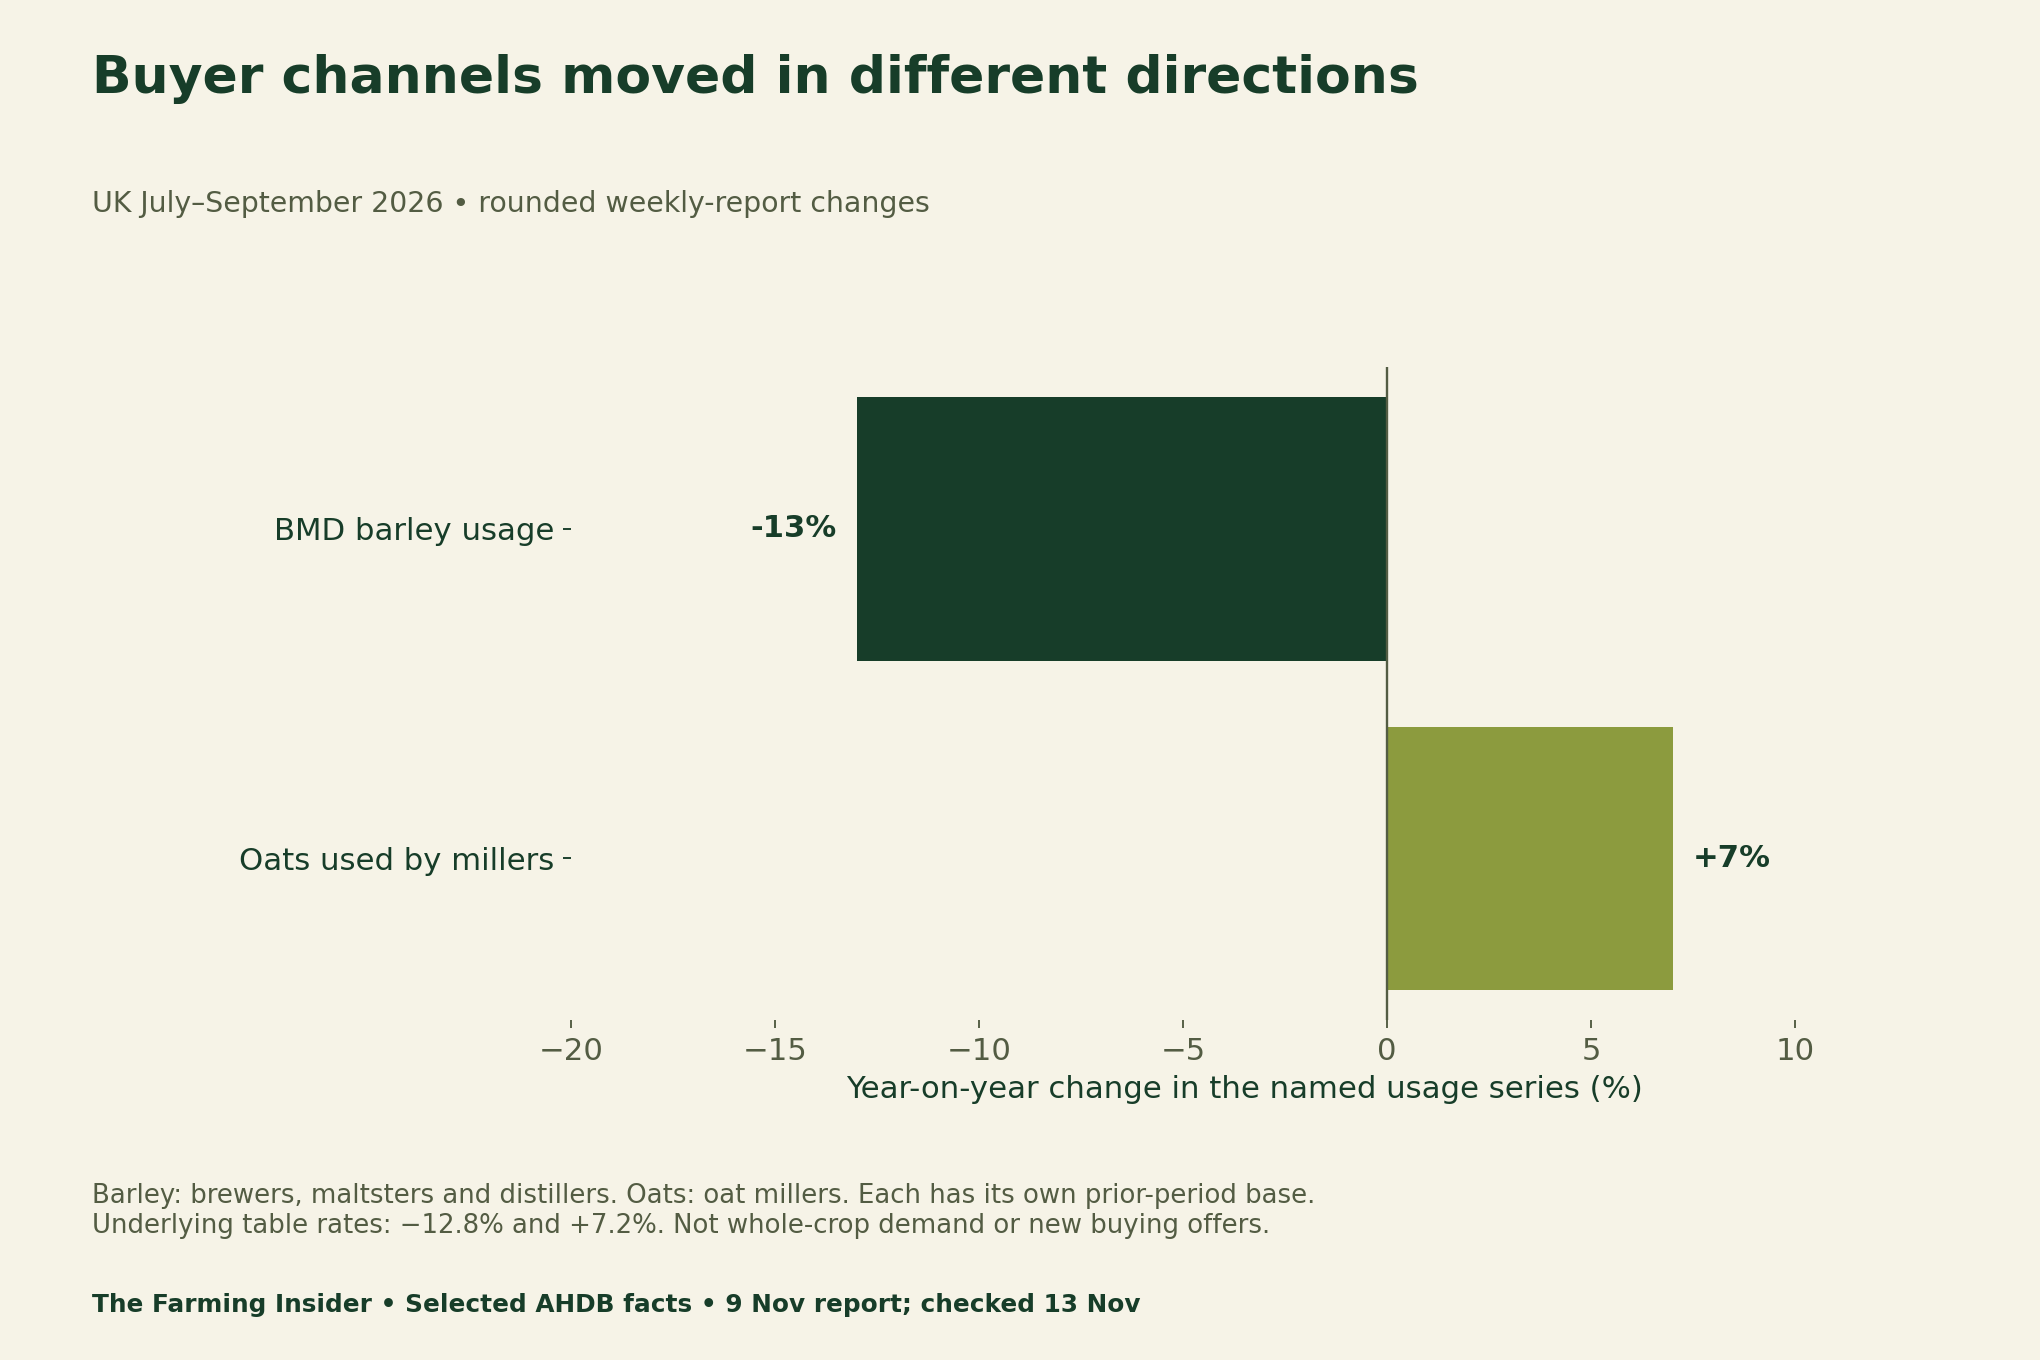
Use these differences to choose the next question, not the next crop. Ask whether a relevant buyer is currently sourcing, what specifications apply and whether its location fits your logistics. An aggregate increase can coexist with a closed contract book, unsuitable delivery terms or requirements your lot does not meet.
Build a buyer-segment evidence map
Start a separate enquiry record for each real buyer. Write the crop and variety first, then the specification source. Next add the delivery location, window, lot size and testing arrangements. Record the commercial basis, including deductions and transport, rather than assuming every quoted price is directly comparable.
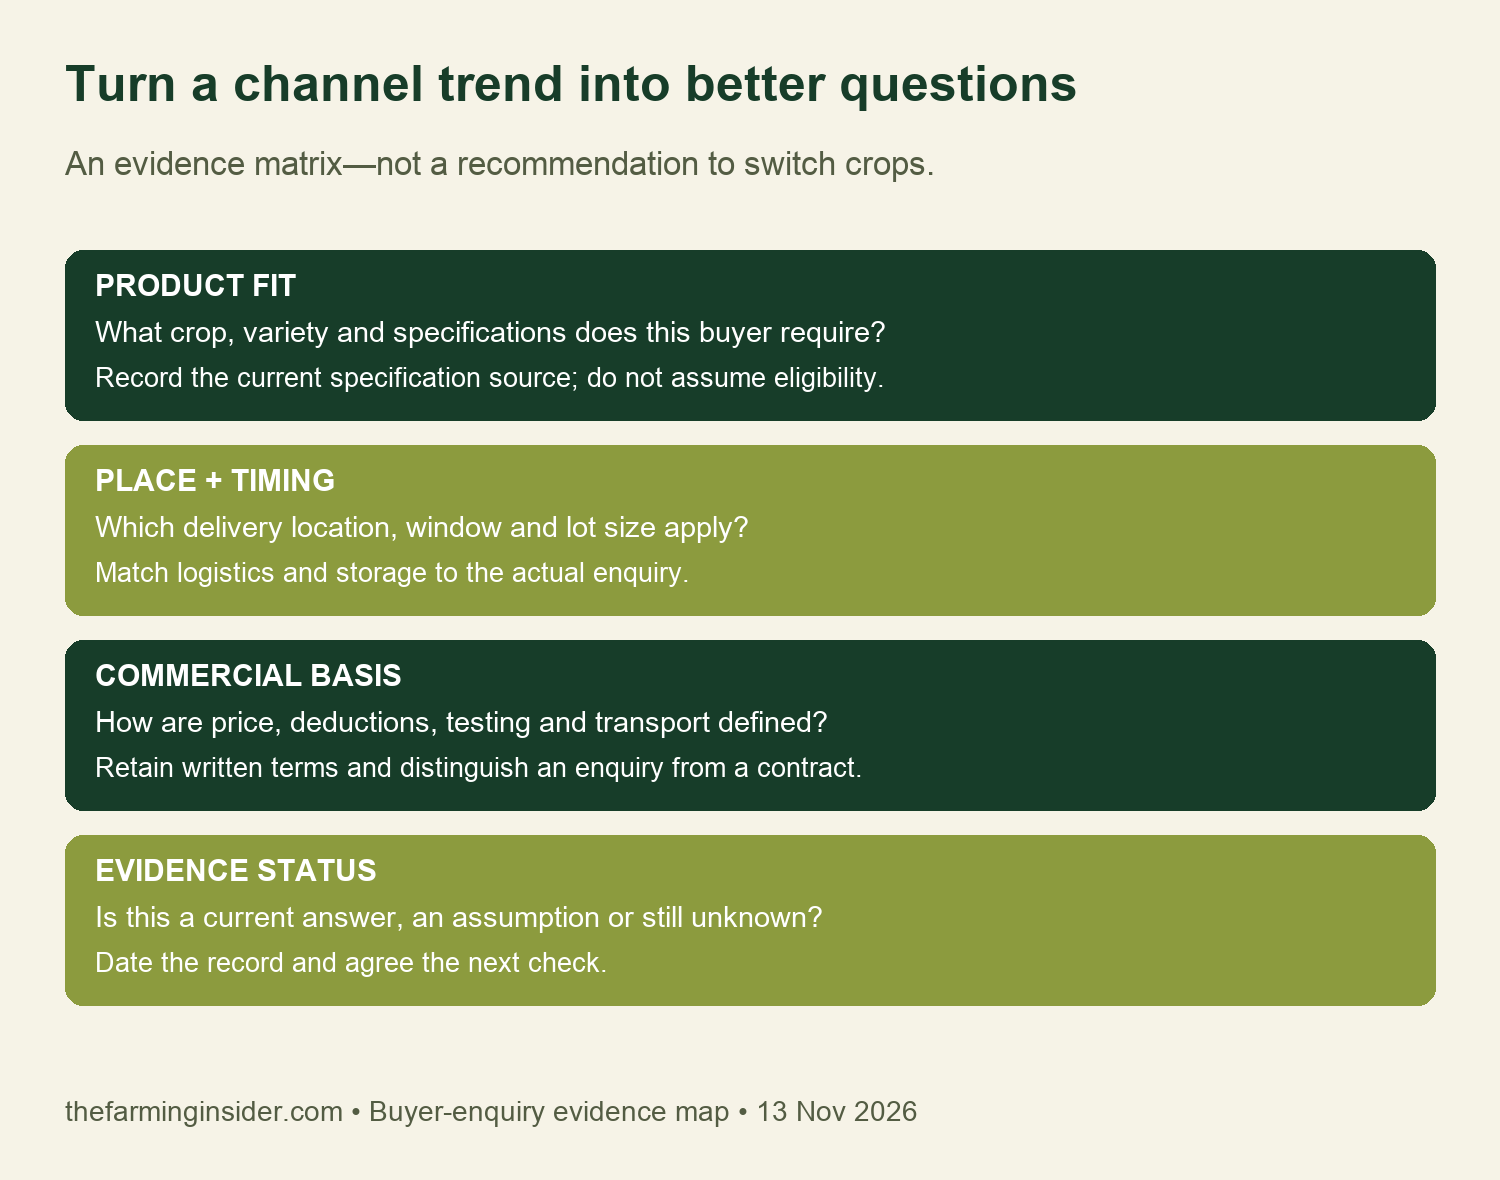
Mark an unanswered question as unknown. A public webpage, an informal conversation and a signed contract have different evidential status. Date each entry and retain the supporting document privately. If another person updates the record, make the source and change visible so an old assumption does not become a false fact.
Our UK farm input-cost exposure guide explains another limit of aggregate headlines. Both exercises begin with your actual business records. Neither a national price index nor a processing-usage trend directly measures your farm’s profit or market access.
Check reporting periods and unavailable values
The usage page provides a statistical reporting calendar. Its July–September 2026 windows span 5 July to 3 October; they are not simply three ordinary calendar months. Use matching reporting windows for comparisons and retain the source’s period label. Do not pair a single September value with a cumulative July–September figure.
The source also distinguishes unavailable figures from zero usage. If a table displays n/a, do not insert a zero merely to complete a spreadsheet. A missing or suppressed value needs a note. Check the AHDB collection and quality-assurance overview when assessing coverage and revisions.
Download the four reader tools
The selected-change notes retain rounded report figures beside detailed-table values. The origin-share file shows the two calculations and their restricted scope. Complete the buyer-enquiry sheet privately with current evidence, then use the definition audit to check period, units, denominator and status.
- Selected cereal-change and rounding notes (CSV)
- Original matched wheat-origin share calculations (CSV)
- Blank private cereal-buyer enquiry sheet (CSV)
- Cereal-demand definition audit checklist (CSV)
Methods, reuse and limitations
We chart selected reported facts and calculate origin shares from matching quantities. Three charts serve distinct questions; extra charts would repeat the same evidence. The infographics and blank worksheets are our original editorial tools. We do not reproduce AHDB’s graphics or redistribute its complete downloadable datasets.
Transform Your Agribusiness
Unlock your farm's potential with expert advice tailored to your needs. Get actionable steps that drive real results.
Get StartedConsult AHDB’s terms before reusing its material. Our small selected-fact commentary is not a licence to redistribute the source database. No analysis here estimates future prices, proves causation, predicts crop acceptance or recommends a crop switch.
Suggested citation: The Farming Insider (13 November 2026), “UK Cereal Demand: Home-Grown Wheat and Buyer Channels”, selected-source commentary, original calculations and reader worksheets. Recheck current buyer terms and newer source releases before acting on a market-planning decision.