




The Australian farm profit outlook places the 2026–27 national broadacre indicator at the 82nd percentile. That is a modelled rank, not an 82% profit increase. Before using the headline in a budget, check the geography, the comparison period and the assumptions that belong to your own enterprise.
The ABARES update released on 19 November 2026 uses climate information available at the end of October. We separate its published percentile examples from original, fictional gross-margin calculations. Three charts and four CSV tools show how to turn a broad outlook into questions for a budget, without treating it as a farm-level forecast.
Australian farm profit outlook: read the unit first
Section 1.3 of the full official report compares current farms under forecast climate and prices with their simulated performance under conditions over the previous 33 years. It does not directly compare today’s farms with their actual historical accounts. A percentile locates the modelled outcome within that reference distribution; it does not state a dollar margin or a growth rate.
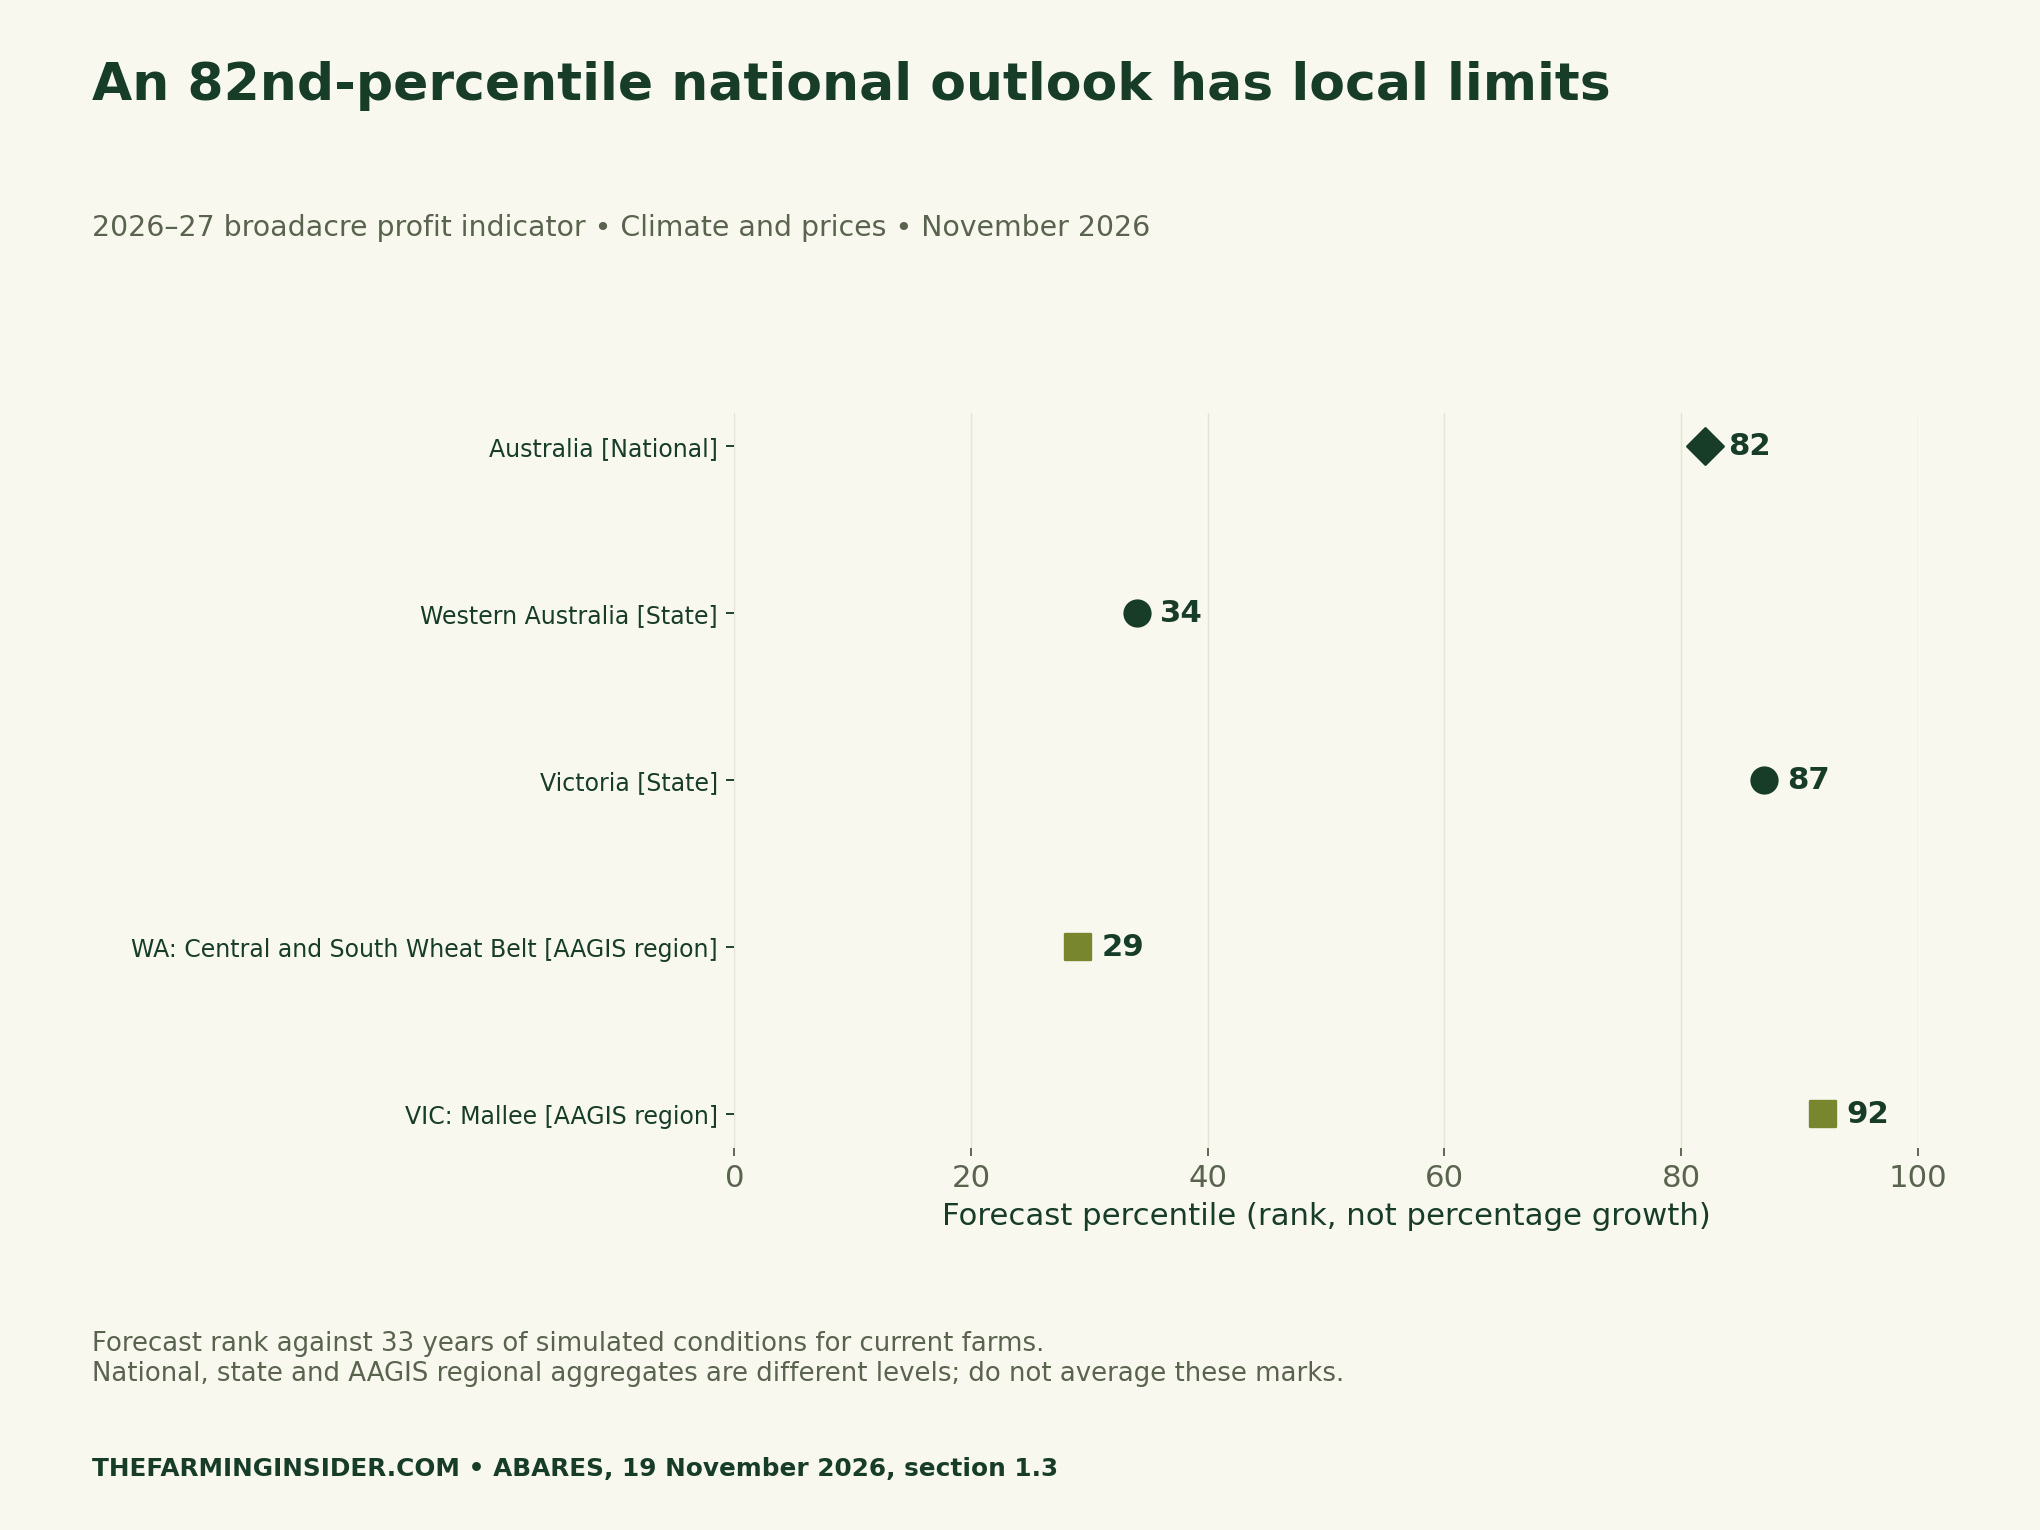
The national figure can therefore coexist with a less favourable result in one state or region. Western Australia is at the 34th percentile, while Victoria is at the 87th. Within the selected AAGIS examples, WA’s Central and South Wheat Belt is at 29 and Victoria’s Mallee at 92. Those are different geographical aggregates, not five interchangeable farm observations.
Do not average the five marks. The national value already covers farms within smaller areas, so that calculation would mix overlapping levels. Likewise, the difference between 92 and 29 is a rank difference, not a 63% profit advantage or an amount of cash available to invest. An ordinal comparison cannot supply a missing dollar denominator.
Write a local assumption before changing the budget
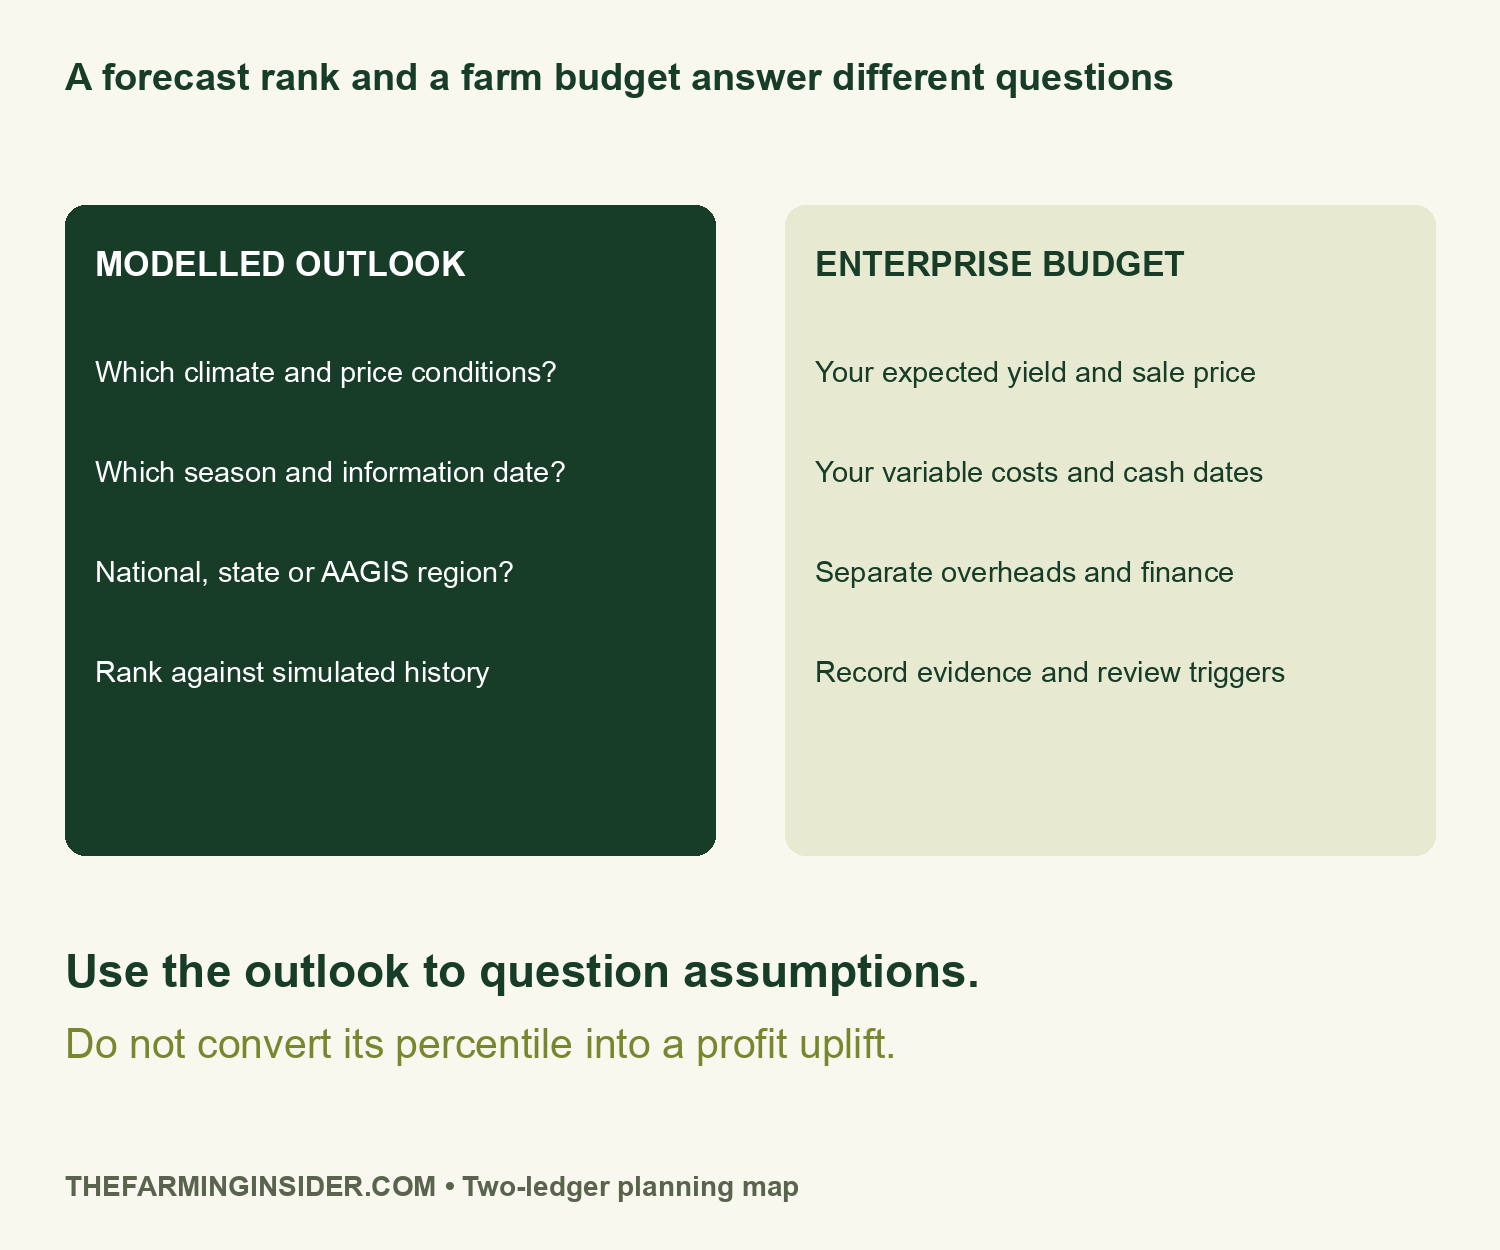
Start a separate enterprise ledger. Enter area, expected saleable yield, price and variable costs, with an evidence date beside each. Use the national or regional outlook to ask which assumptions need checking. Keep your own production records, current quotes and known commitments as the basis for the actual numbers.
For example, ask whether a price assumption refers to the product you expect to sell and the point at which it is priced. Then identify which transport, quality, storage or other charges belong in your chosen margin definition. Avoid mixing a delivered price with a cost base that assumes those charges have already been deducted. The worksheet leaves these judgements for the business and its adviser.
Test a fictional gross margin in dollars per hectare
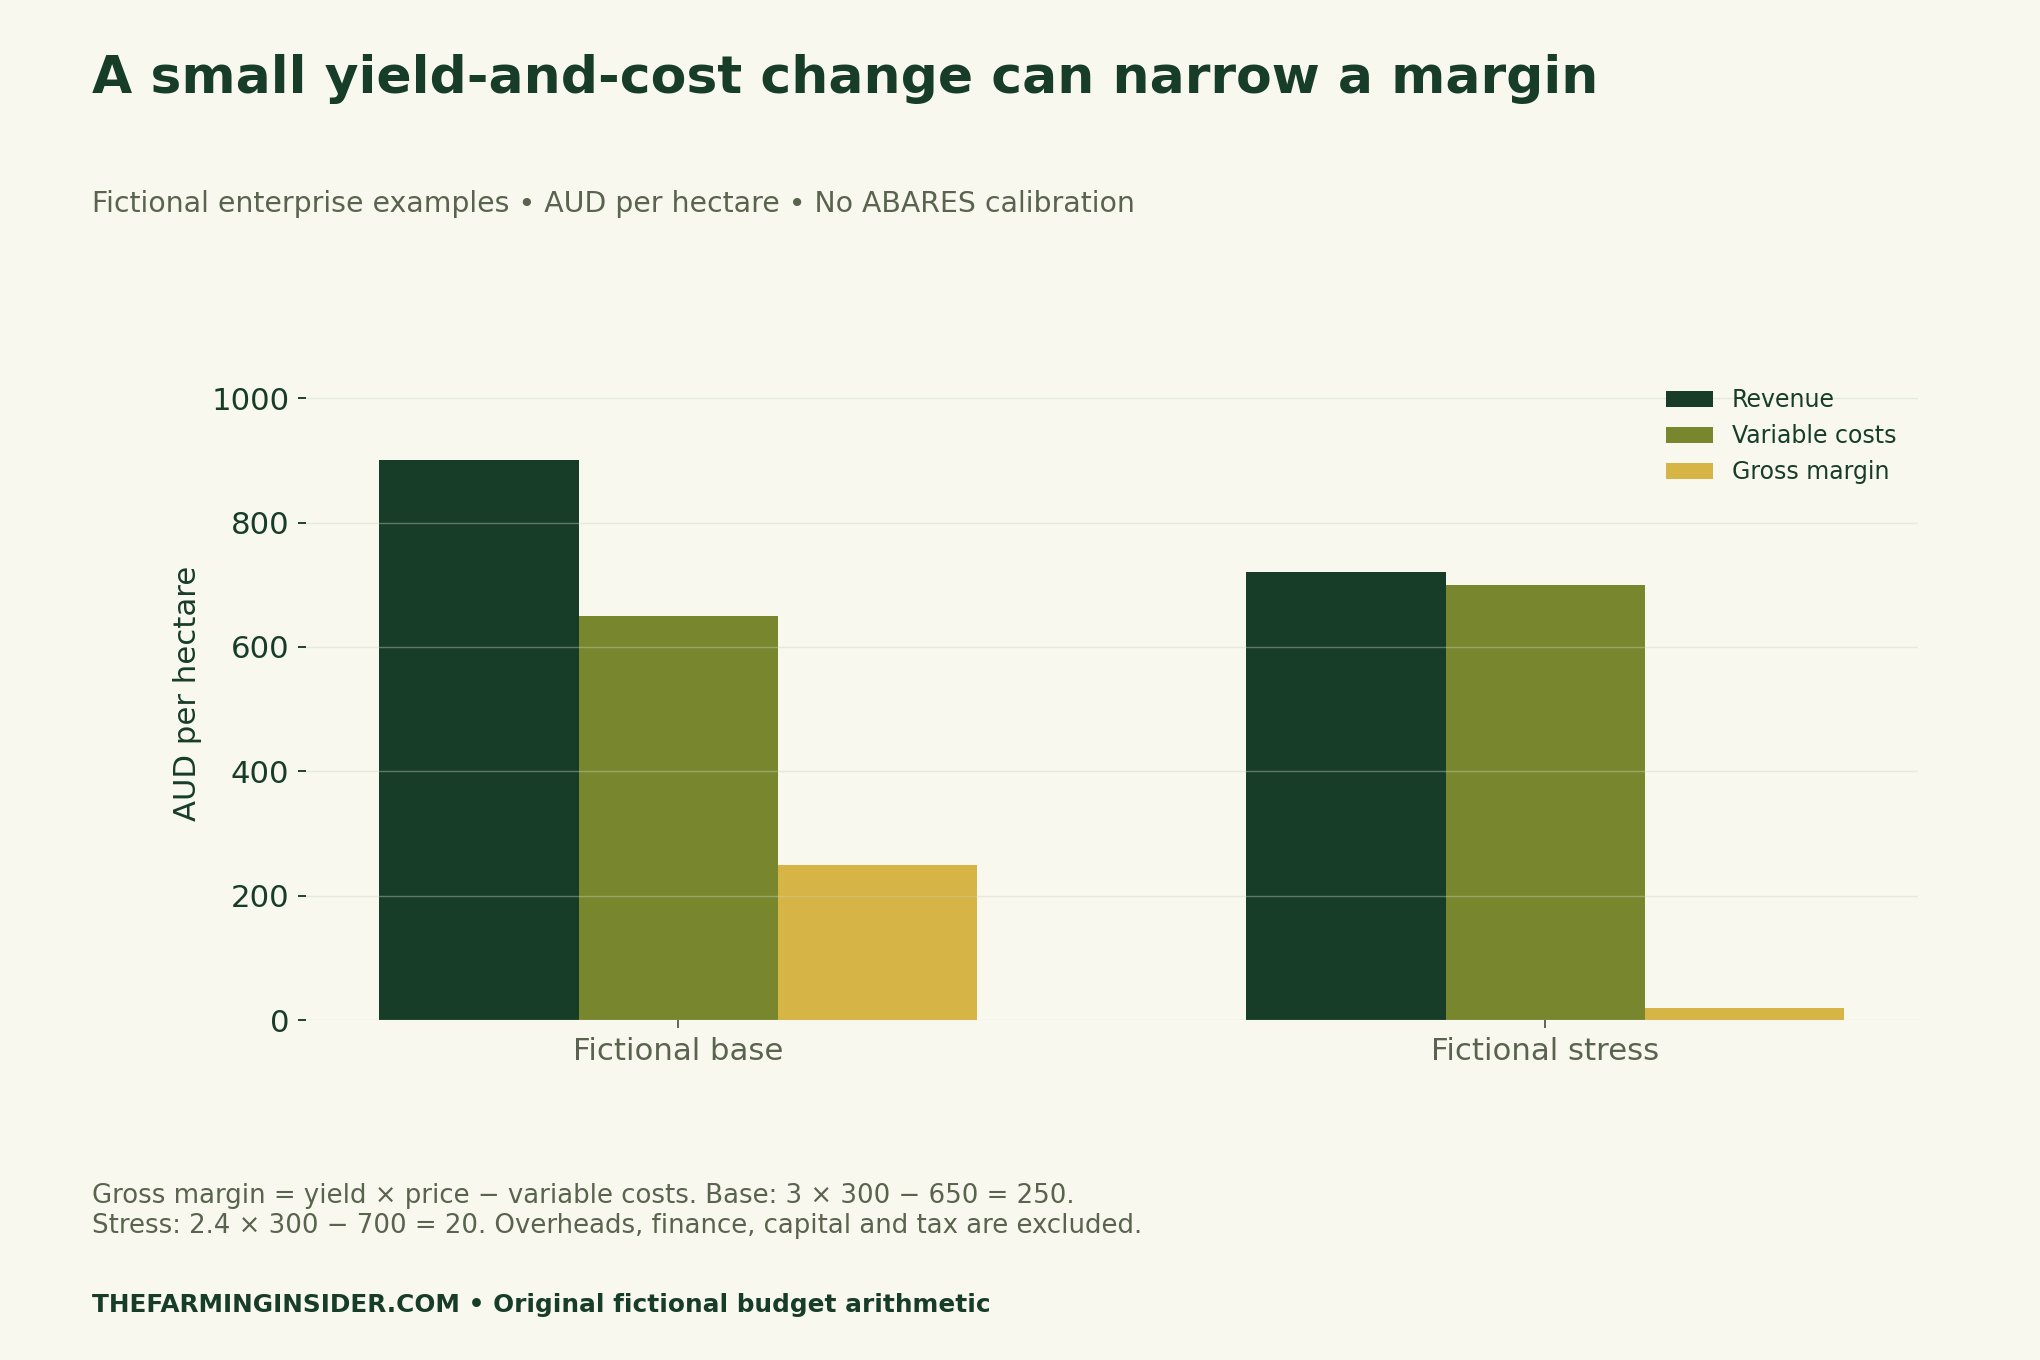
Our base example assumes 3 tonnes per hectare sold at AUD300 per tonne, with AUD650 per hectare in variable costs. Revenue is 3 × 300 = AUD900 per hectare. Subtracting those costs leaves a gross margin of AUD250 per hectare. The figures are deliberately fictional and are not drawn from a farm survey.
The stress example holds price at AUD300 per tonne, lowers yield to 2.4 tonnes per hectare and raises variable costs to AUD700 per hectare. Revenue becomes AUD720 and the gross margin AUD20 per hectare. This is a transparent sensitivity exercise, not a forecast of what the 82nd-percentile headline means for an enterprise.
Neither AUD250 nor AUD20 is whole-business net profit. A positive gross margin may still be insufficient after overheads, finance and other obligations. Keep those items in a separate schedule and avoid labelling the chart “farm profit”. The distinction matters because the published indicator and this simple enterprise calculation use different methods and scopes.
Change yield, price and costs separately
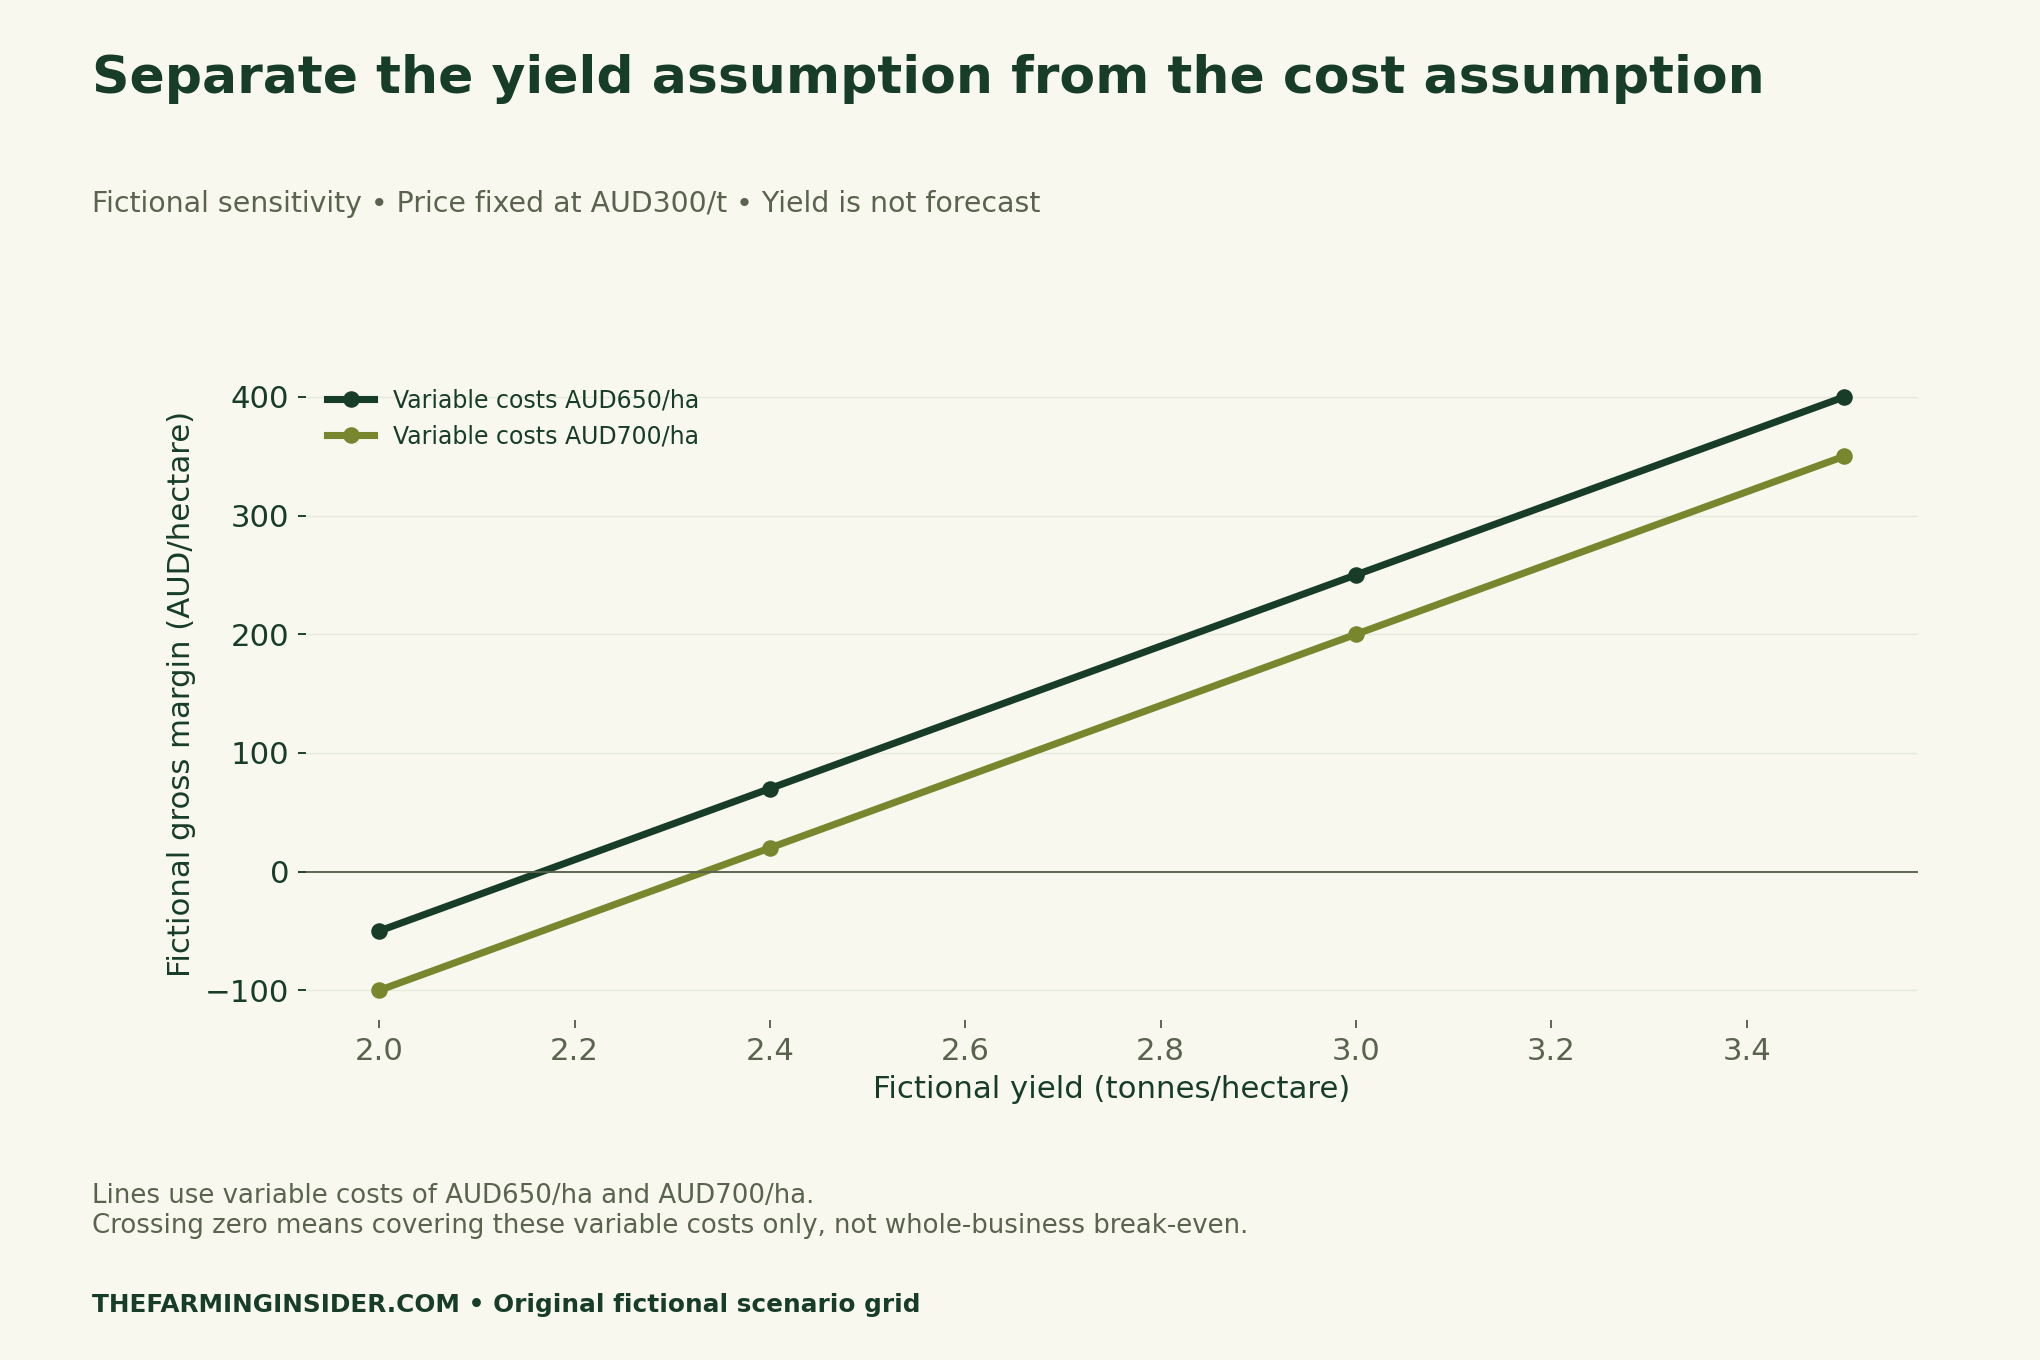
The downloadable grid varies yield, price and variable costs without attaching probabilities. Begin by changing one input at a time, so the reason for the margin change remains visible. Then review combinations that matter to your own plans. Retain the source and date of each assumption rather than selecting a favourable cell as if it were evidence.
At AUD300 per tonne, AUD650 of variable costs are covered at about 2.17 tonnes per hectare; AUD700 requires about 2.33 tonnes. These are arithmetic thresholds for the specified costs only. They are not agronomic yield targets, whole-farm break-even levels or recommendations to change production. A borrowing decision would need a wider cash-flow and risk assessment.
Methods, limits and downloadable working files
We transcribed five labelled percentile examples from the November release and kept their aggregation levels intact. We then calculated revenue as yield multiplied by price, and gross margin as revenue minus variable costs, using fictional inputs. The charts do not estimate local forecast uncertainty, realised profit, a yield distribution or the chance that a farm remains solvent.
Information can change after a release. The end-October climate cutoff, November publication and 2026–27 forecast horizon serve different purposes. Record all three when citing the report. Revisit a budget when its own assumptions change; do not silently replace the source figures or mix a later seasonal update with this version’s scenario sheet.
For related context, browse Agribusiness Strategies and the Research & Reports archive. Use the official report for the modelled outlook and your own verified records for a business plan. Our tools help document the distinction; they do not assess a real enterprise.
Transform Your Agribusiness
Unlock your farm's potential with expert advice tailored to your needs. Get actionable steps that drive real results.
Get Started- Published percentile examples and aggregation levels (CSV)
- Fictional gross-margin calculations (CSV)
- Yield, price and cost sensitivity grid (CSV)
- Blank enterprise budget assumption ledger (CSV)
Source: ABARES, Weekly Australian Climate, Water and Agricultural Update, 19 November 2026, section 1.3, printed pages 7–8. Source data are attributed to the Commonwealth of Australia; original charts add our selected transcription and clearly fictional scenarios. Suggested citation: The Farming Insider, “Australian Farm Profit Outlook: Check the Budget Assumptions”, 21 November 2026.


