







US rice production acreage vs yield in 2026 tells a clearer story than a small-crop headline alone. USDA forecasts a sharply smaller harvested footprint, even though national yield exceeds the previous year. A separate, much smaller monthly revision reflects a four-pound yield adjustment. Those comparisons use different baselines.
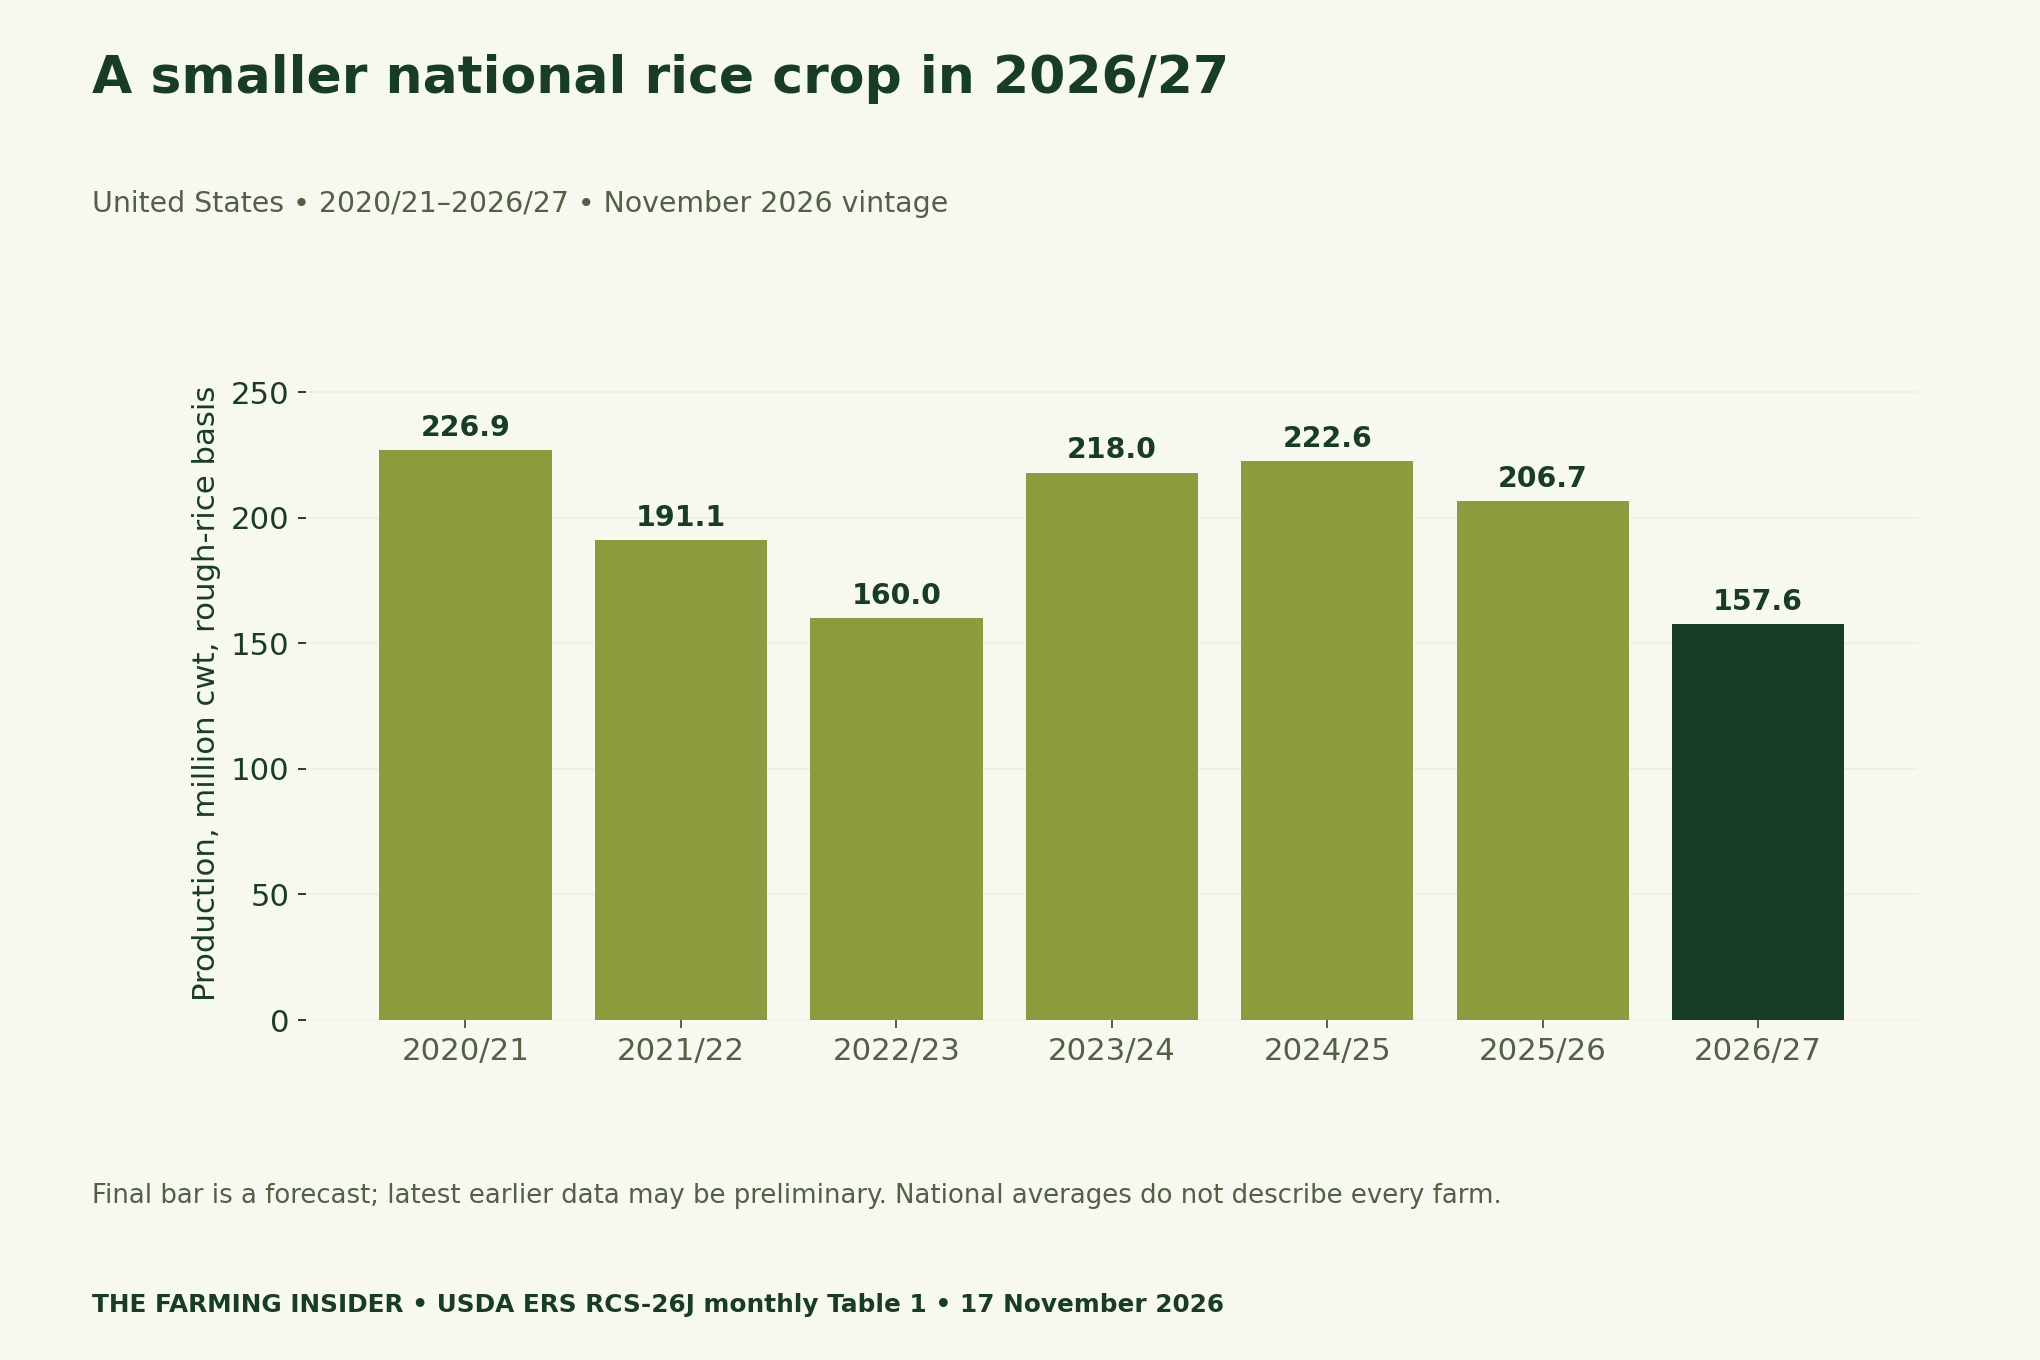
The USDA Economic Research Service’s 13 November Rice Outlook forecasts 157.6 million hundredweight for 2026/27. Its accompanying workbook reports 2.057 million harvested acres and 7,664 pounds per acre. The report identifies reduced acreage as the main reason for the low crop, rather than a broad collapse in yield.
US rice production acreage vs yield in 2026: start with the footprint
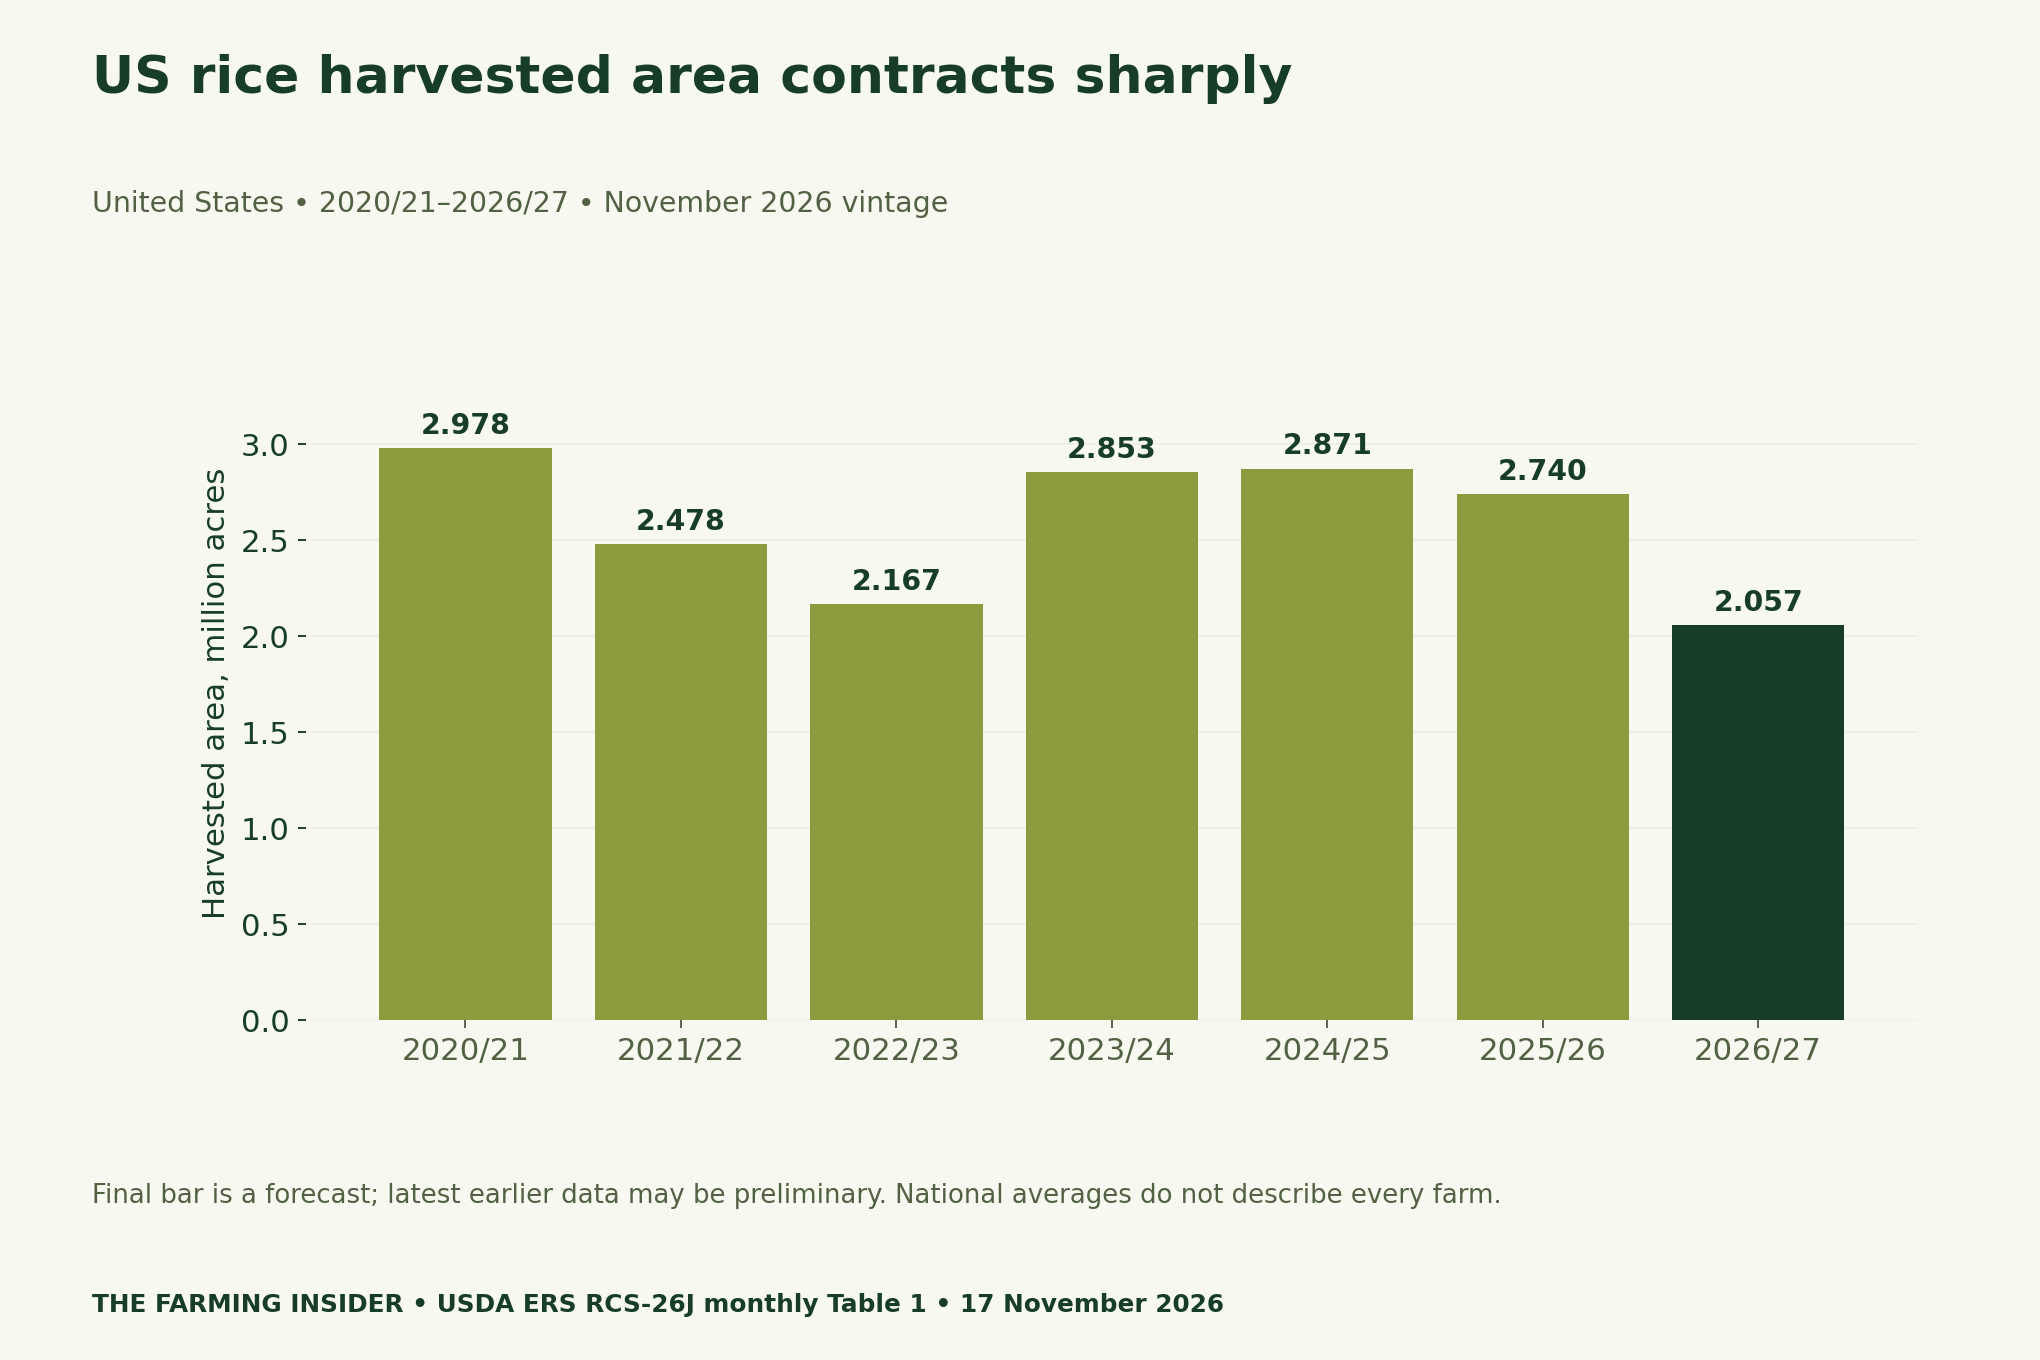
Harvested area measures the land contributing to the crop. It differs from planted area, because some planted land may not reach harvest. Keep that distinction in a budget or statistical note. Substituting planted acres into a harvested-area identity changes the question and can distort the result.
The national footprint also combines different growing regions and rice classes. Consequently, an aggregate contraction does not identify what happened on an individual holding. Use local acreage records to investigate a farm question, and retain the national series as context rather than as a substitute.
A higher yield can coexist with lower production
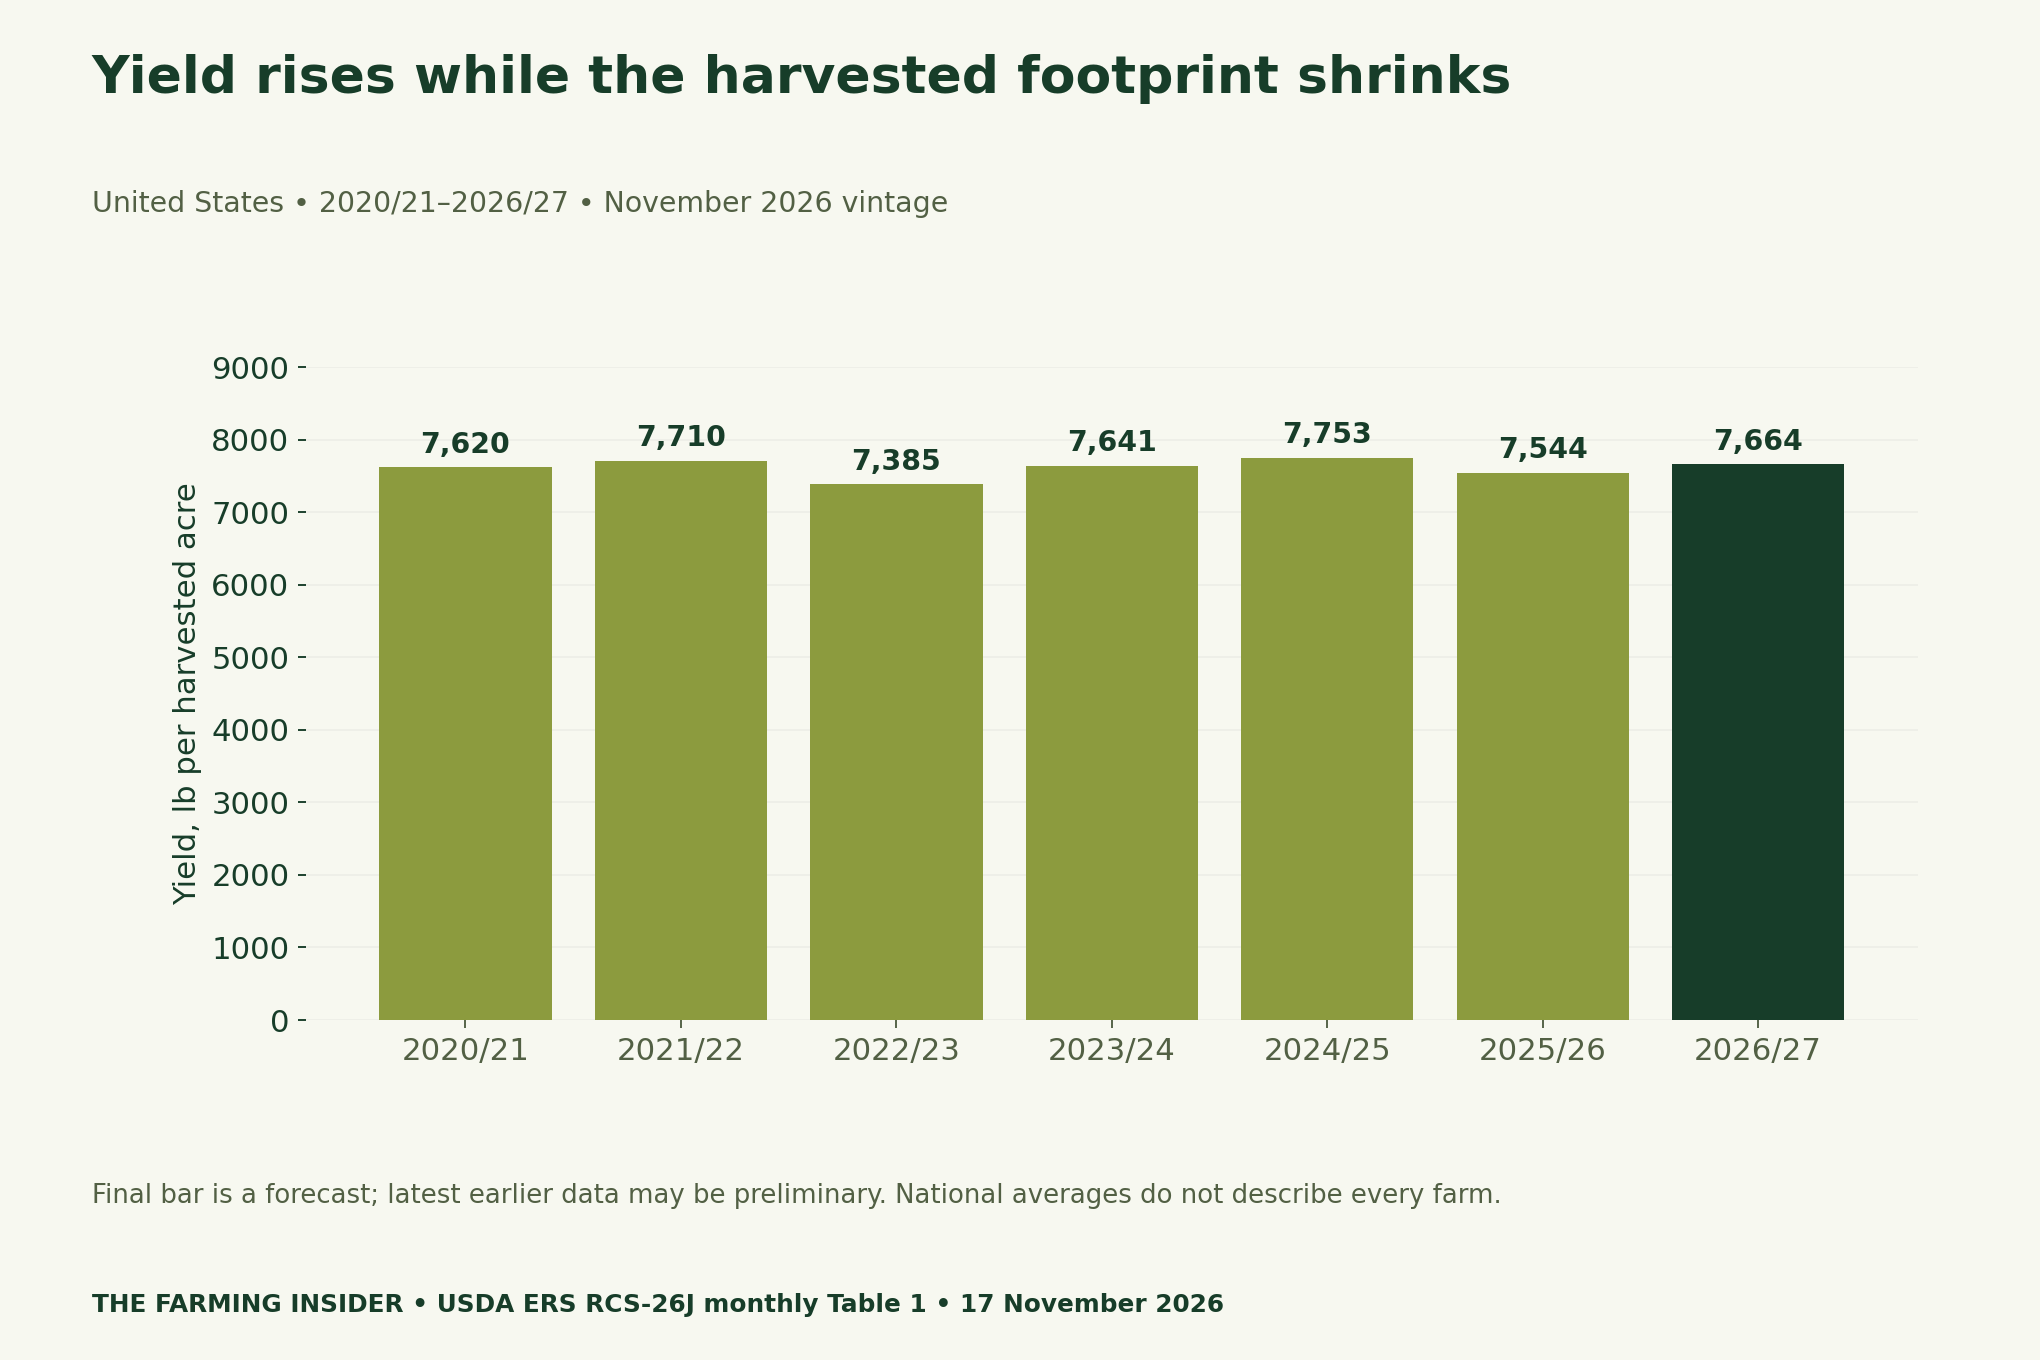
Yield is output per unit of harvested land. In contrast, production is total output. The first can increase while the second falls if enough area leaves the calculation. This is why a national production headline should not automatically become a claim that remaining rice fields performed worse.
Nor does a higher average guarantee that every grower gained. Regional composition, crop classes and individual conditions can differ. Before applying the national figure, identify the relevant geography, class, moisture basis and season. A national mean is a useful summary with a particular denominator.
Check the area-times-yield identity and its rounding
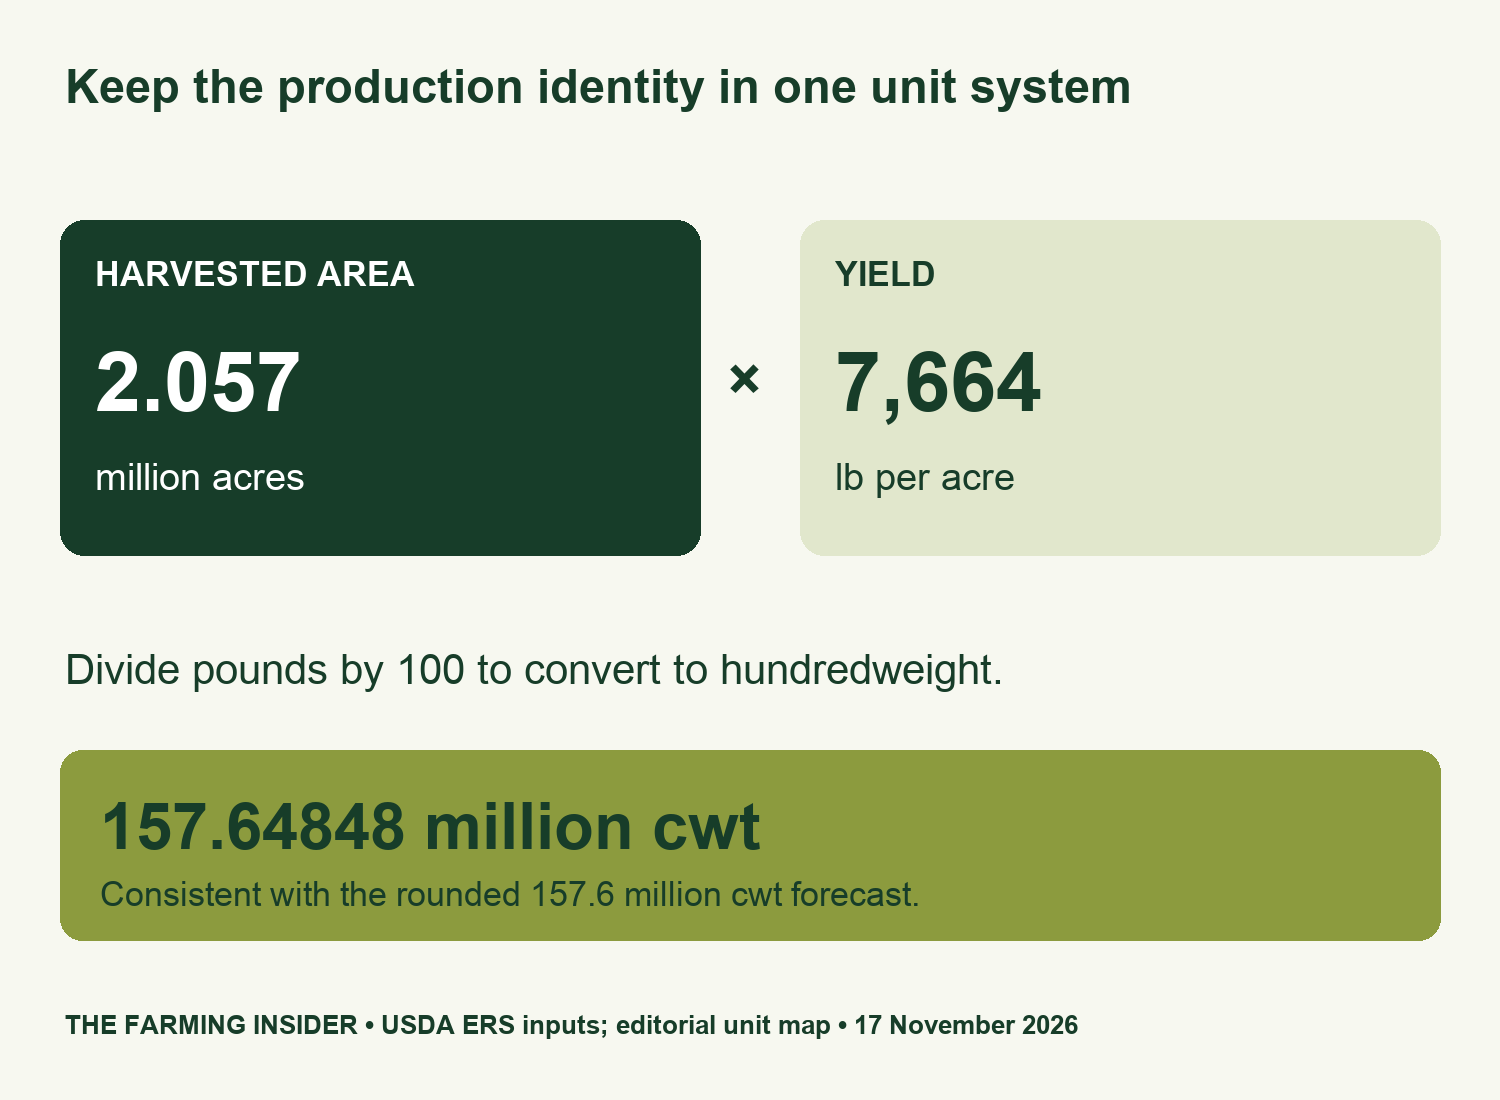
Multiplying the displayed inputs gives 2.057 × 7,664 ÷ 100 = 157.64848 million cwt. For comparison, the workbook gives 157.648 million cwt. That tiny residual reflects displayed precision; it is not evidence of unaccounted rice. Retain both the reported quantity and the input-based check in a reproducible file.
Keep rough and milled rice quantities distinct as well. Processing changes the weight basis. A valid conversion needs its own assumptions and source, rather than an unexplained replacement of one number with another. The identity here reproduces the national crop on the stated source basis.
Decompose the annual change without claiming causation
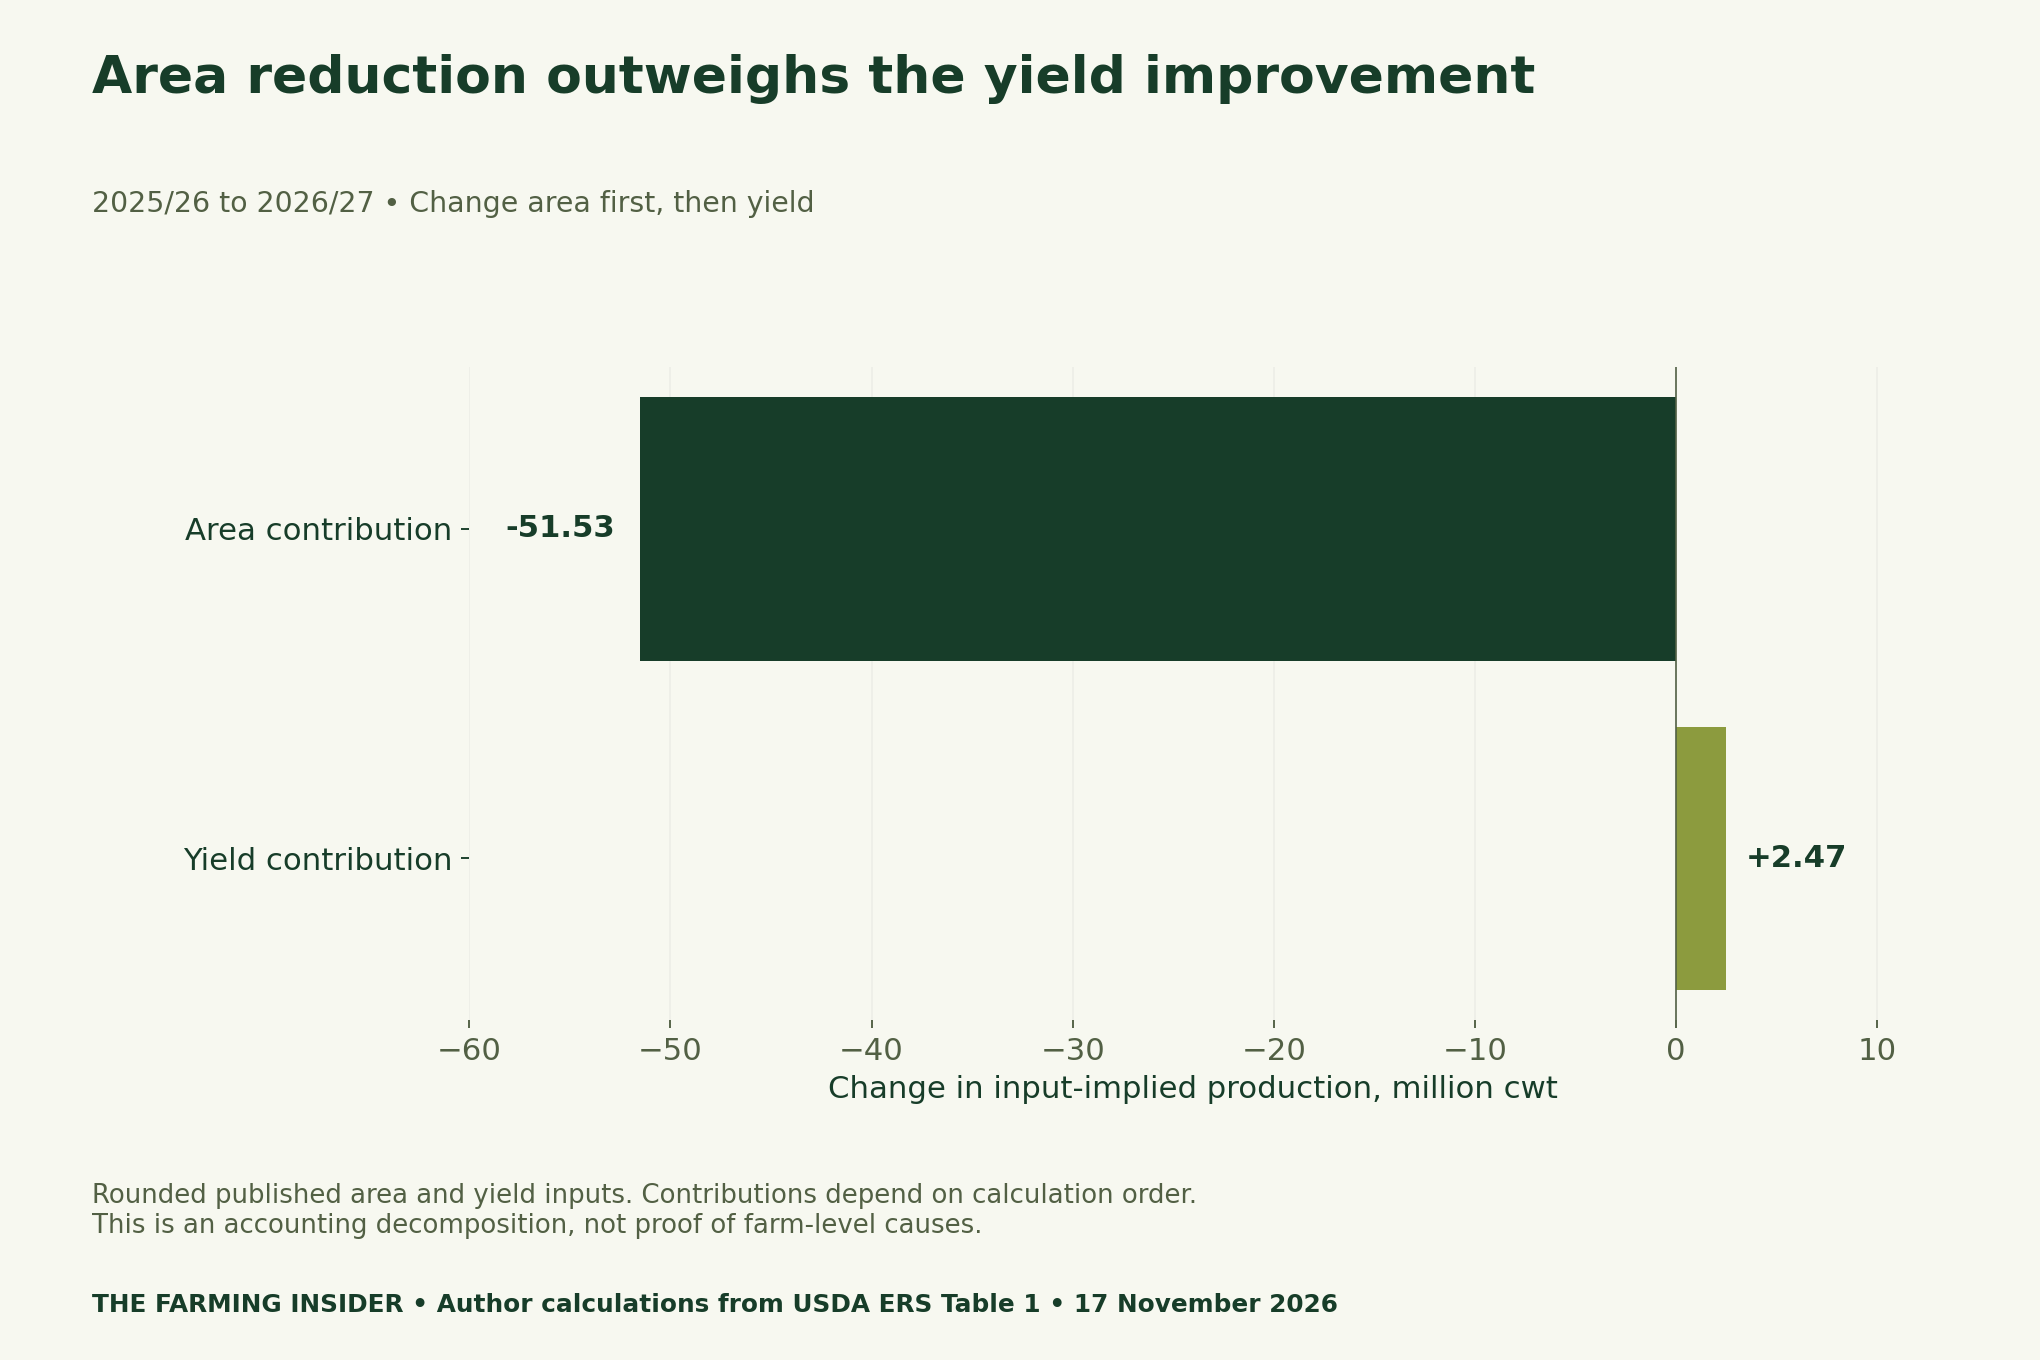
Our decomposition first changes harvested area while holding the earlier yield constant. It then changes yield at the new area. The two contributions sum to the change implied by those displayed inputs. Changing the calculation order reallocates the interaction term, so state the convention beside the result.
This calculation does not estimate what would have happened under a policy or price intervention. It also cannot isolate weather, costs or planting decisions. Those require additional evidence and an appropriate design. Use the contributions to explain the identity, while keeping causal questions separate.
Do not confuse an annual contraction with a monthly revision
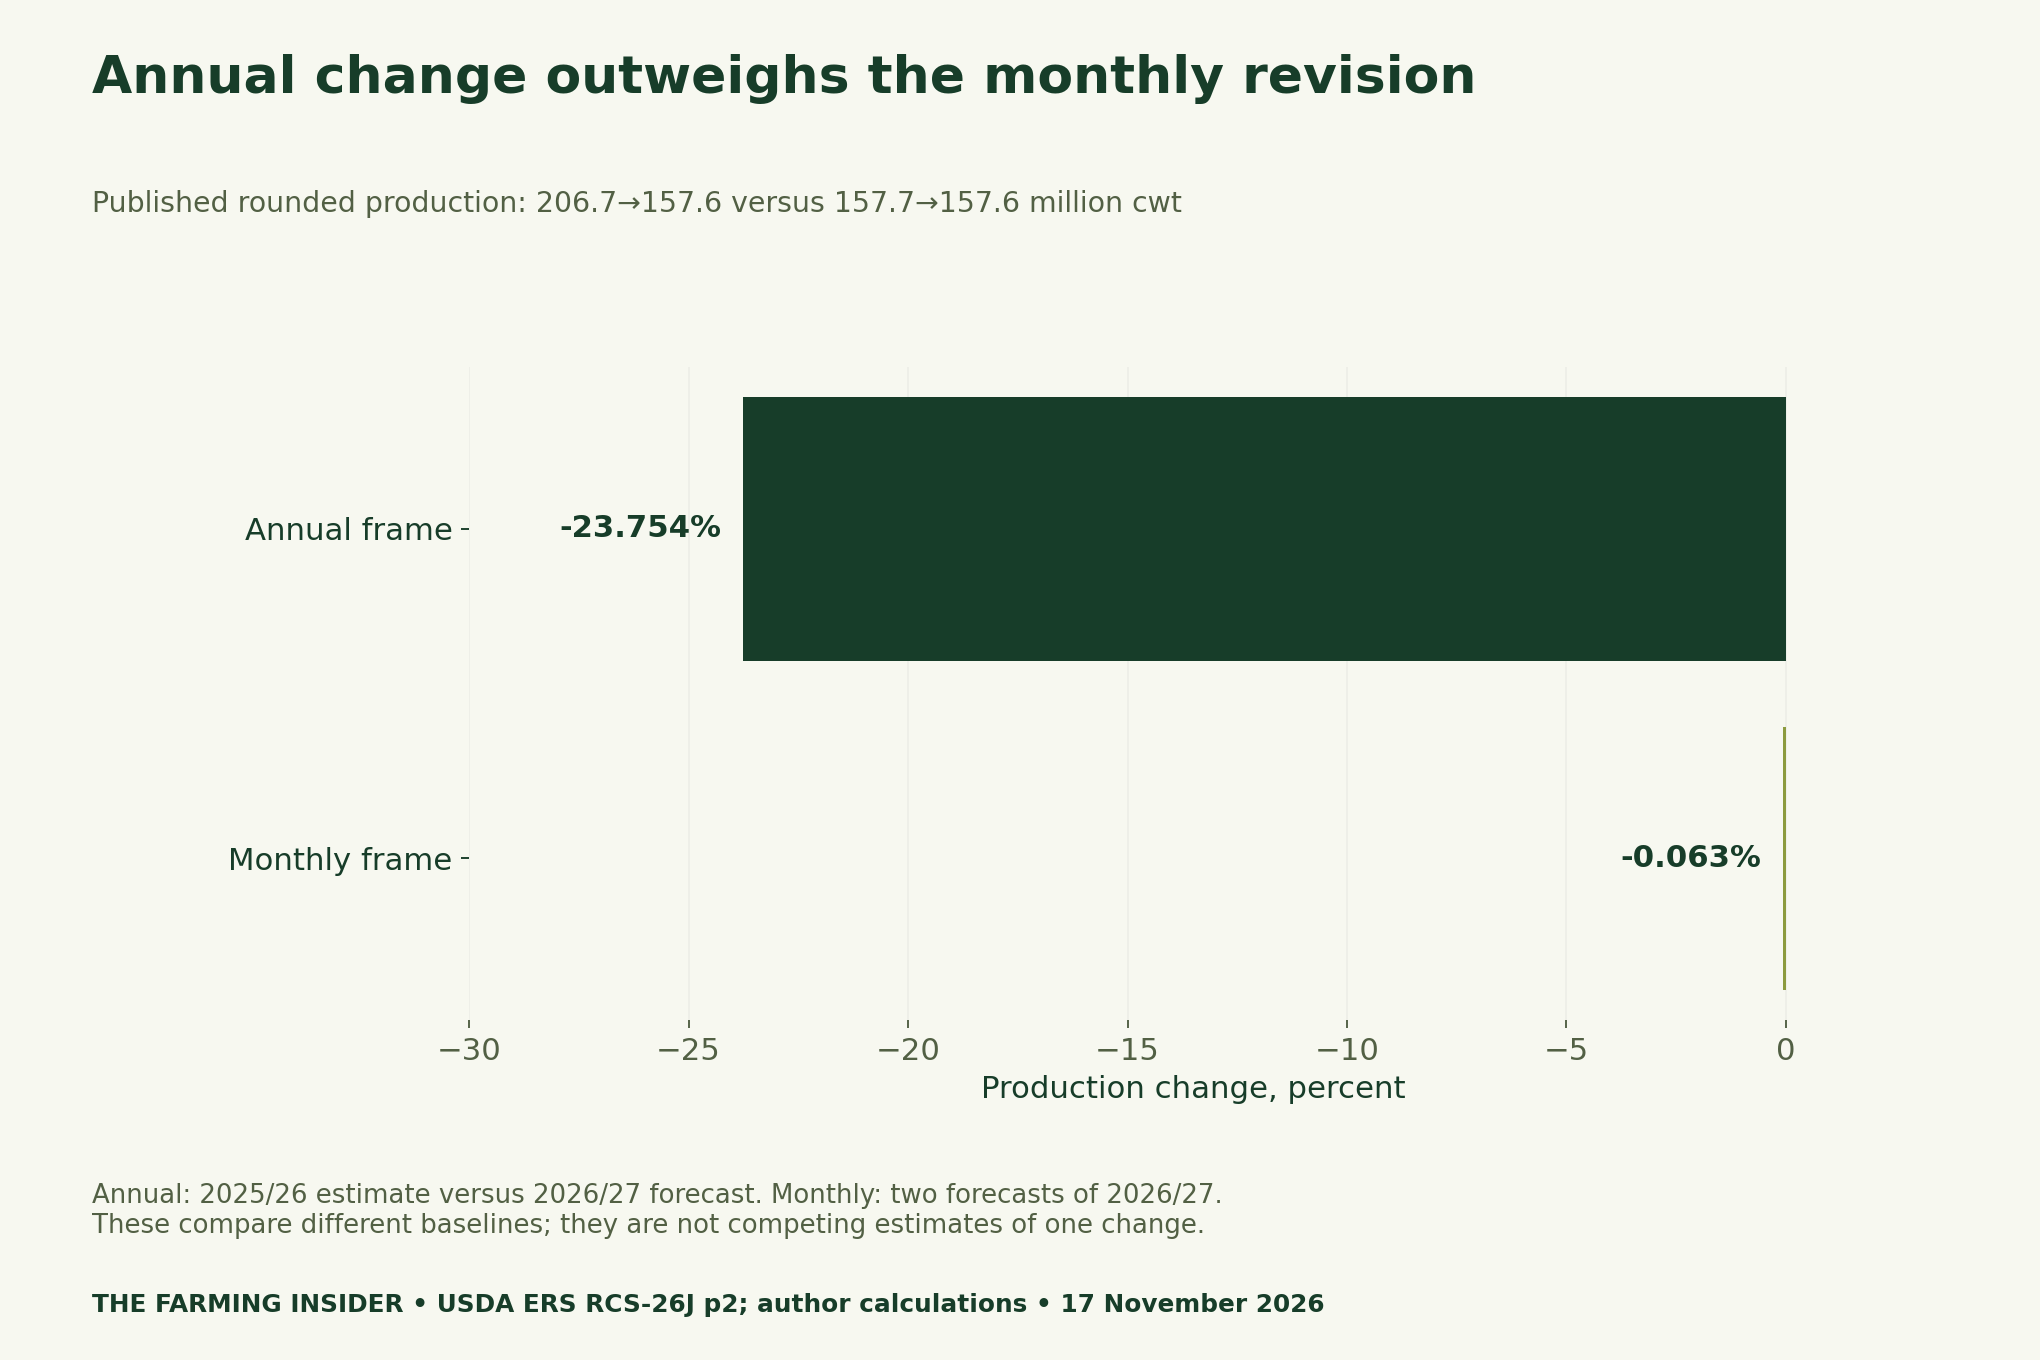
October’s forecast yield was 7,668 pounds per acre; November’s is 7,664. Harvested area stayed unchanged. Multiplying the four-pound difference by the displayed area gives an input-implied reduction of 0.08228 million cwt, consistent with a published rounded monthly change of 0.1 million cwt.
Therefore, attach the starting date and reference year to each percentage. A revision asks what changed in the forecast since last month. An annual comparison asks how one crop year differs from another. Neither should appear in a social caption without enough context to identify that baseline.
What a grower or adviser can check next
Use the blank ledger to record the national measure alongside the farm evidence actually needed. For acreage, consult harvested field records. Yield checks should match measured output and harvested area. To assess profitability, add the relevant revenue, quality, input and fixed-cost records rather than inferring margin from tonnage alone.
Our Crop Cultivation and Management archive provides related context. National accounting is a starting point for questions, not a planting recommendation, price forecast for a particular sale or a diagnosis of a farm’s performance.
Method, limitations and downloadable files
We downloaded the November outlook and monthly workbook on 17 November 2026. The charts reproduce Table 1’s area, yield and production series. Calculations preserve source precision, while the comparison-frame chart deliberately uses the report’s rounded production values. The 2026/27 observations remain forecasts.
Transform Your Agribusiness
Unlock your farm's potential with expert advice tailored to your needs. Get actionable steps that drive real results.
Get StartedThe tools are editorial teaching and recordkeeping aids. They do not estimate local profit, future prices or an optimal crop choice. The separate historical, forecast and hypothetical fields make it easier to reuse the arithmetic without transferring the national result to an individual farm.
- National rice source series and forecast status (CSV)
- Production identity and order-specific decomposition (CSV)
- Annual versus monthly comparison checks (CSV)
- Blank national-to-farm question ledger (CSV)
Suggested citation: The Farming Insider, “US Rice Production 2026: Separate Acreage Loss From Yield Performance”, 17 November 2026. Source: USDA ERS, Rice Outlook RCS-26J, pages 2–3 and monthly Table 1; charts and calculations by this publication.