



USDA corn forecast uncertainty matters when a single national number enters a planning conversation. The point estimate is useful, but it is not the final harvest total. Keep its range, date and geographic scope alongside it. Then record your own saleable crop and local price assumptions separately.
This guide provides four original charts, an evidence-map infographic and four downloadable CSV tools. It explains the November release without building a price forecast or offering a trading recommendation. Research checked on 13 November 2026.
USDA corn forecast uncertainty: the November figures
The USDA NASS Crop Production report, released 10 November 2026, uses conditions on 1 November. Its rounded corn production forecast is 15.9 billion bushels; average yield is 179.6 bushels per acre. Harvest information was incomplete, so these are forecasts rather than final results.
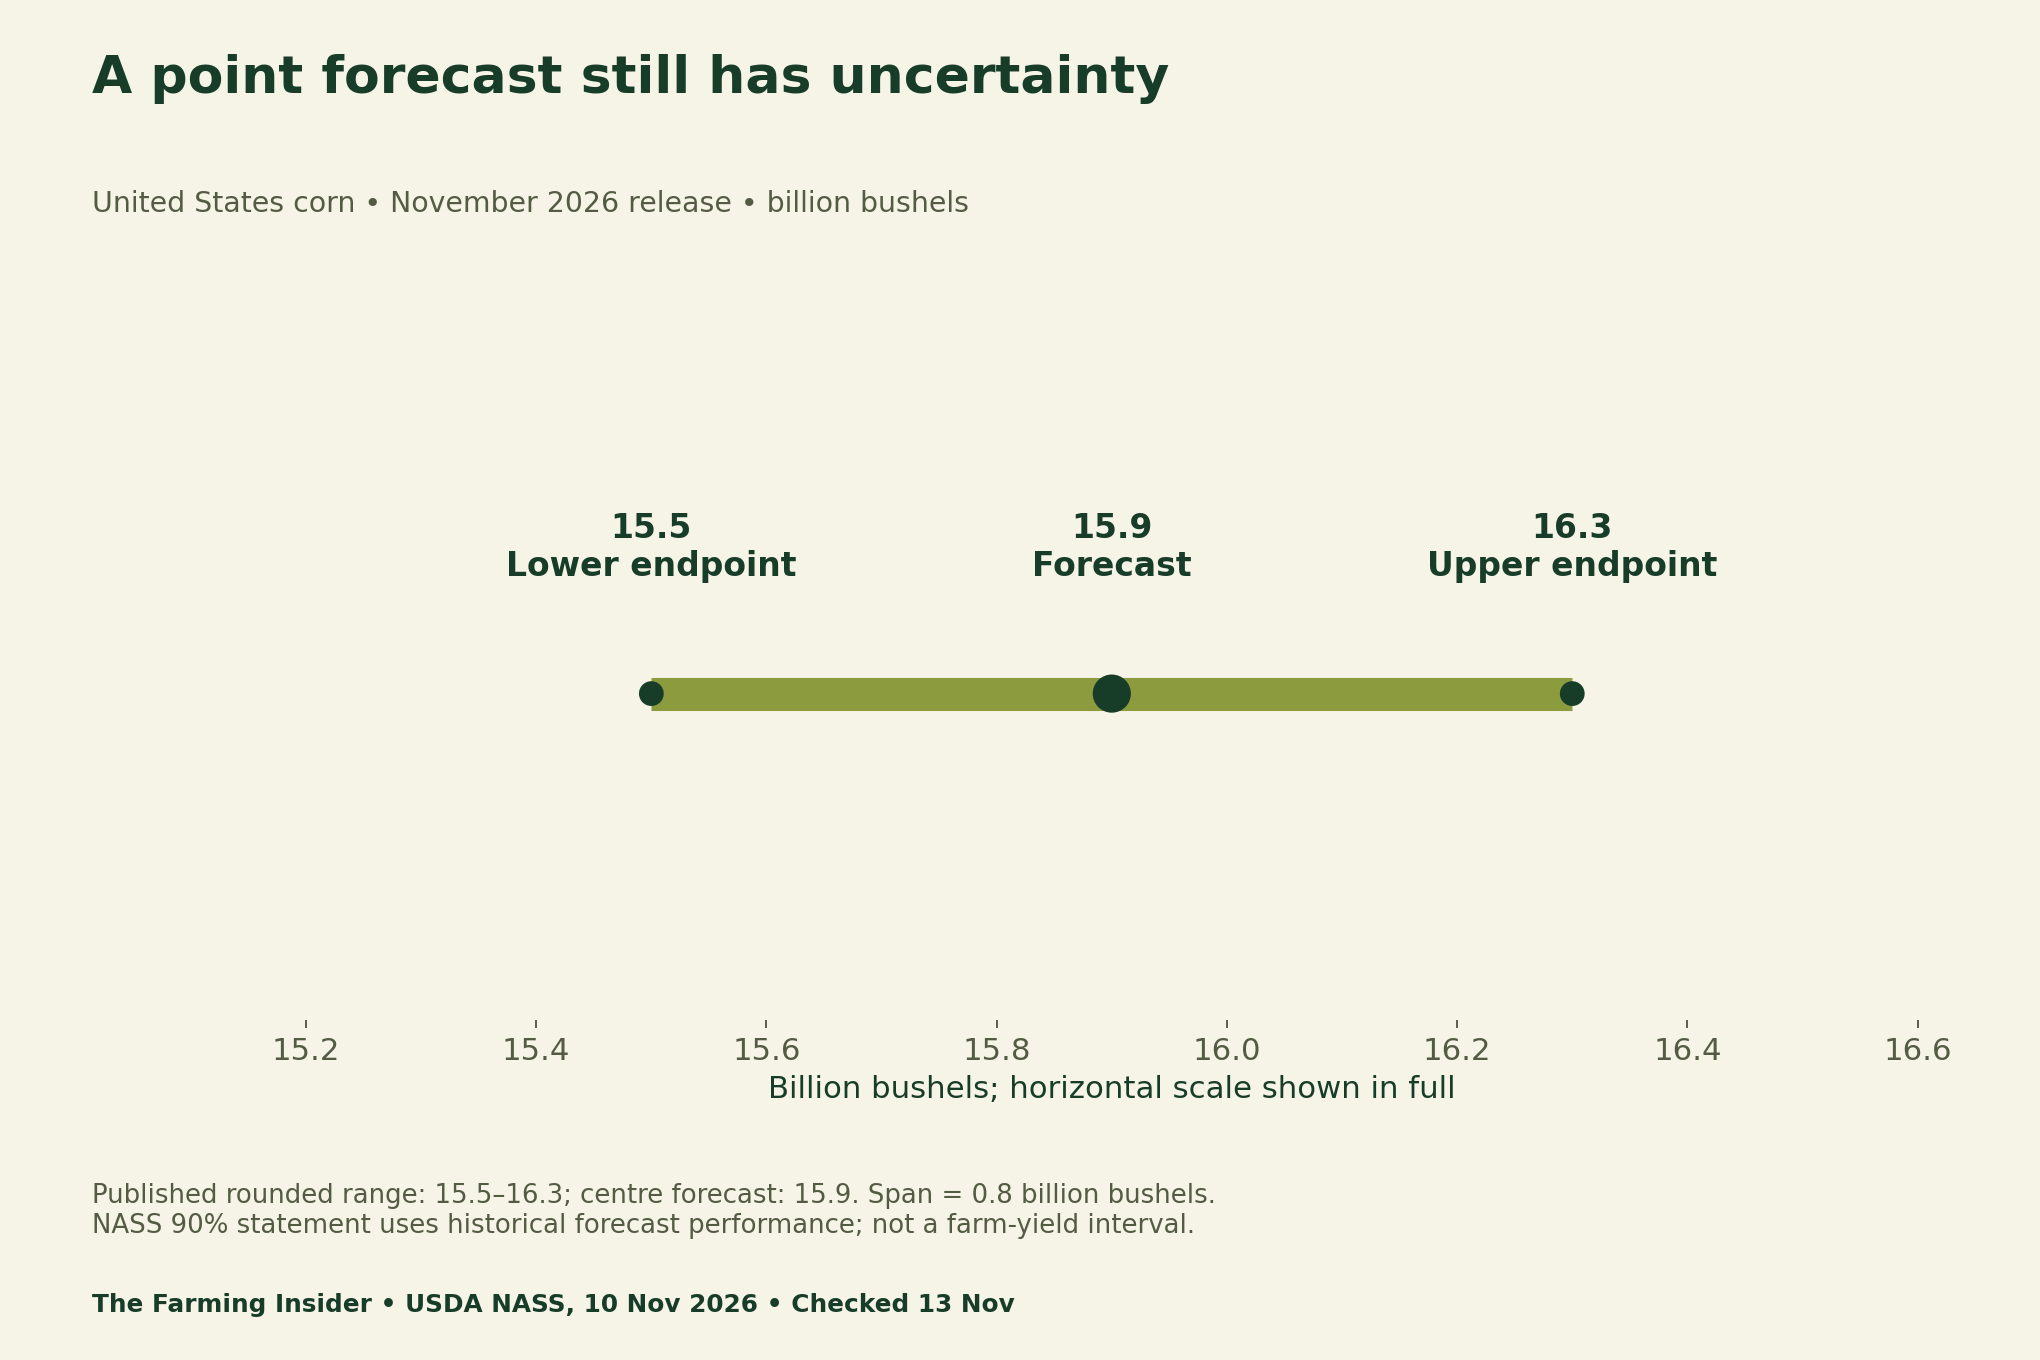
The report places final national corn production within a rounded 15.5–16.3 billion-bushel range in its 90% statement, based on twenty years of forecast performance. Read the reliability method on pages 34–35 as well as the front-page summary. The statement is conditional on historical factors remaining relevant.
Read the range without inventing a probability curve
Subtracting the published endpoints gives 0.8 billion bushels, or 800 million. Each endpoint sits 0.4 billion from the rounded centre. Those arithmetic facts do not tell us that every point inside is equally likely. They also do not establish that the endpoints are the lowest and highest possible outcomes.
Keep the published rounding when quoting this front-page range. Do not mix its one-decimal figures with a more detailed table and imply that the small differences are new information. Retain the exact table version if a separate calculation requires more precision. Never imply a more precise forecast than the evidence supports.
Historical forecast errors are useful context
NASS reports absolute November-to-final corn differences averaging 144 million bushels over the historical window, with a smallest difference of 4 million and a largest of 420 million. These are descriptive summaries of past forecast revisions. They are not a current-year loss estimate or a new uncertainty model.
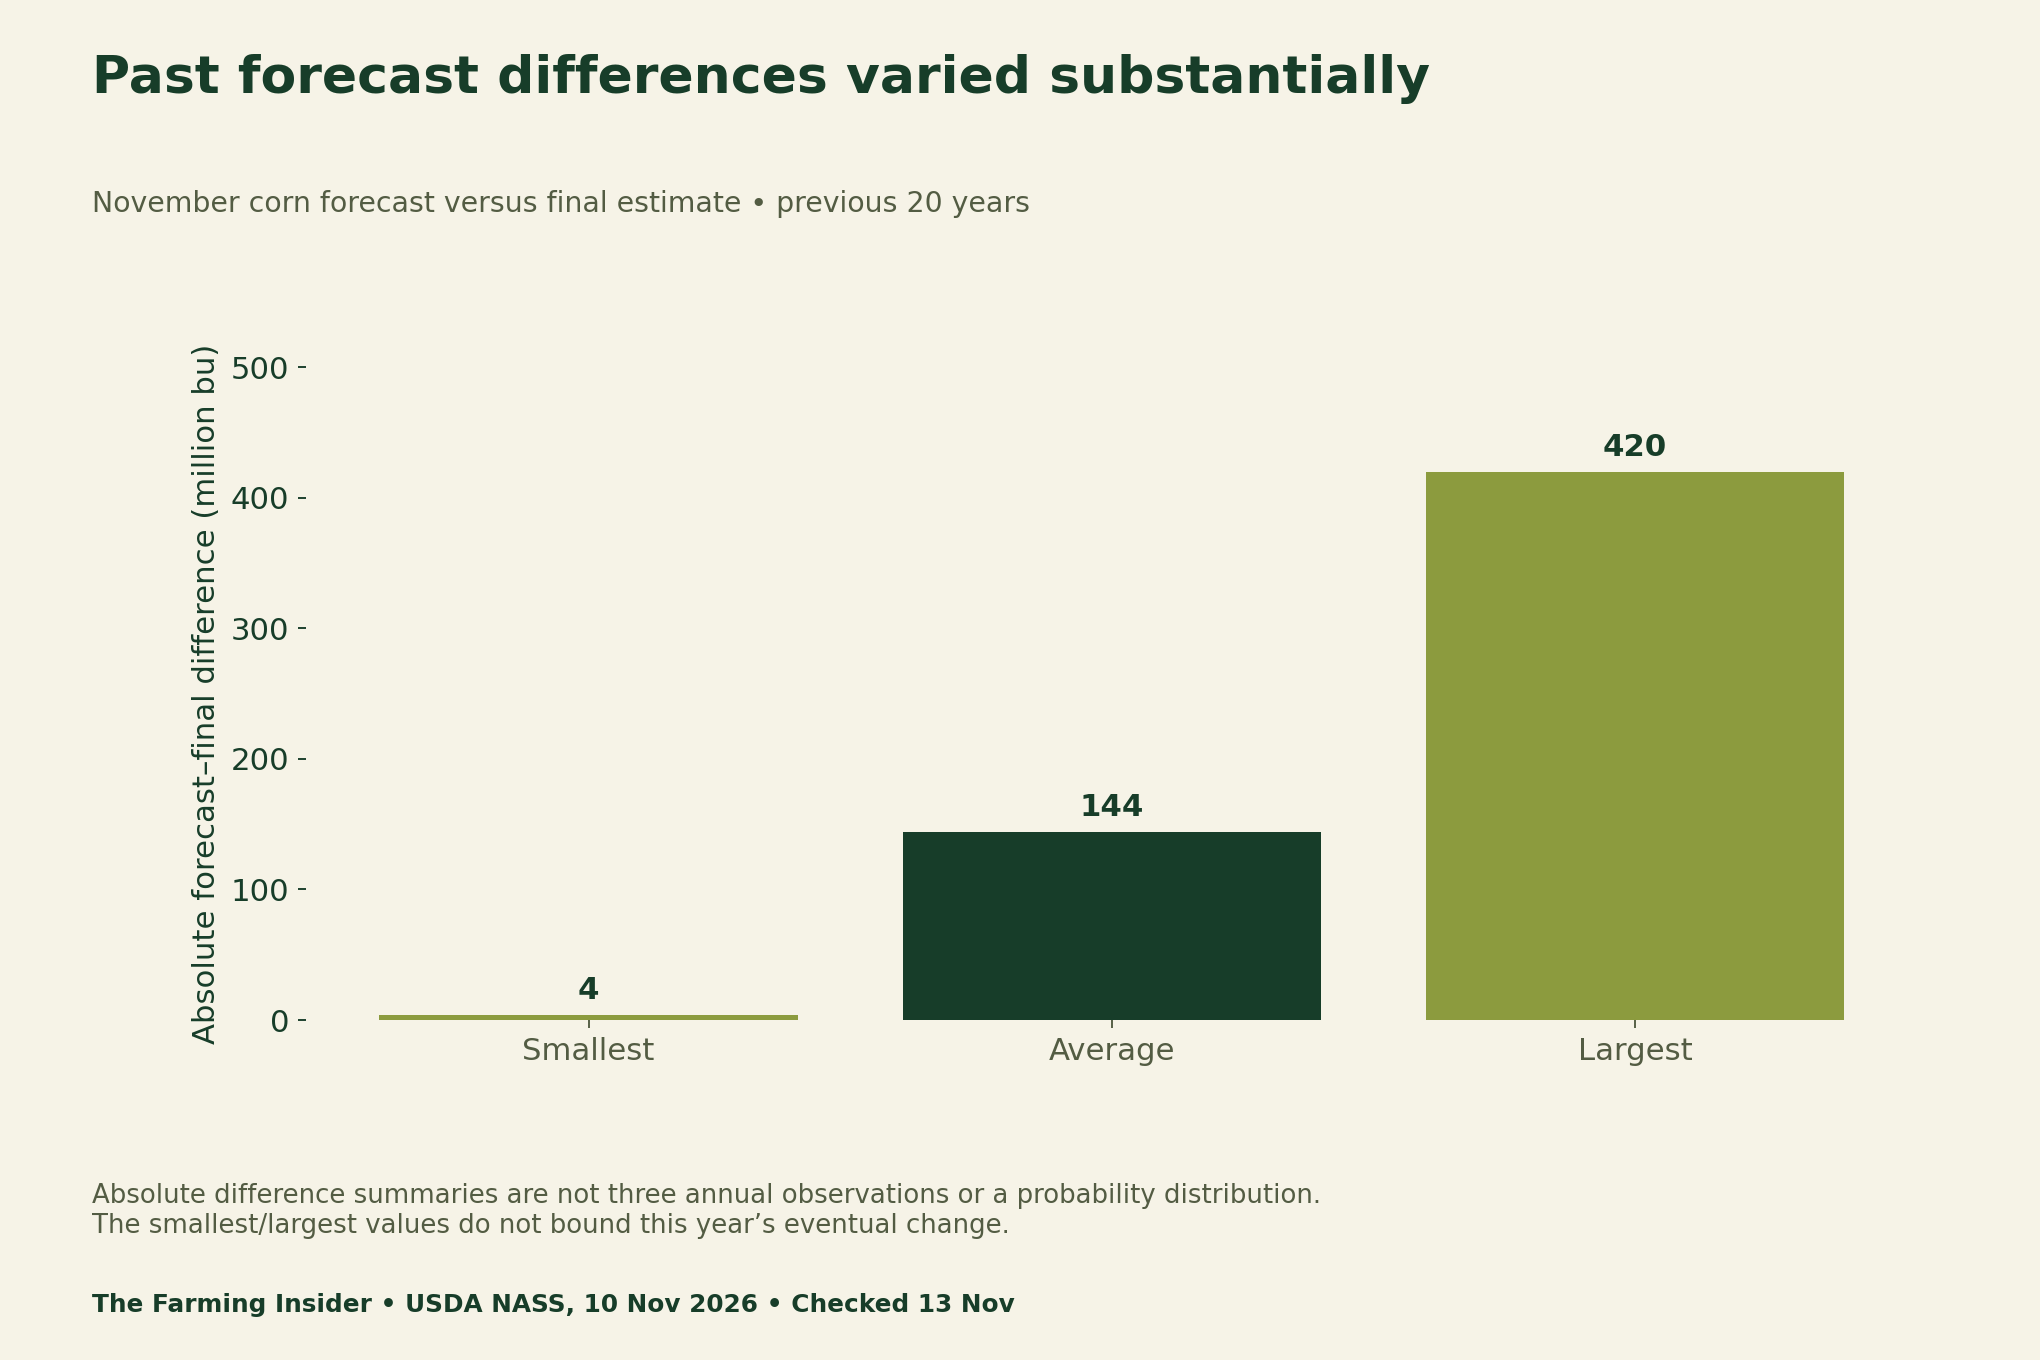
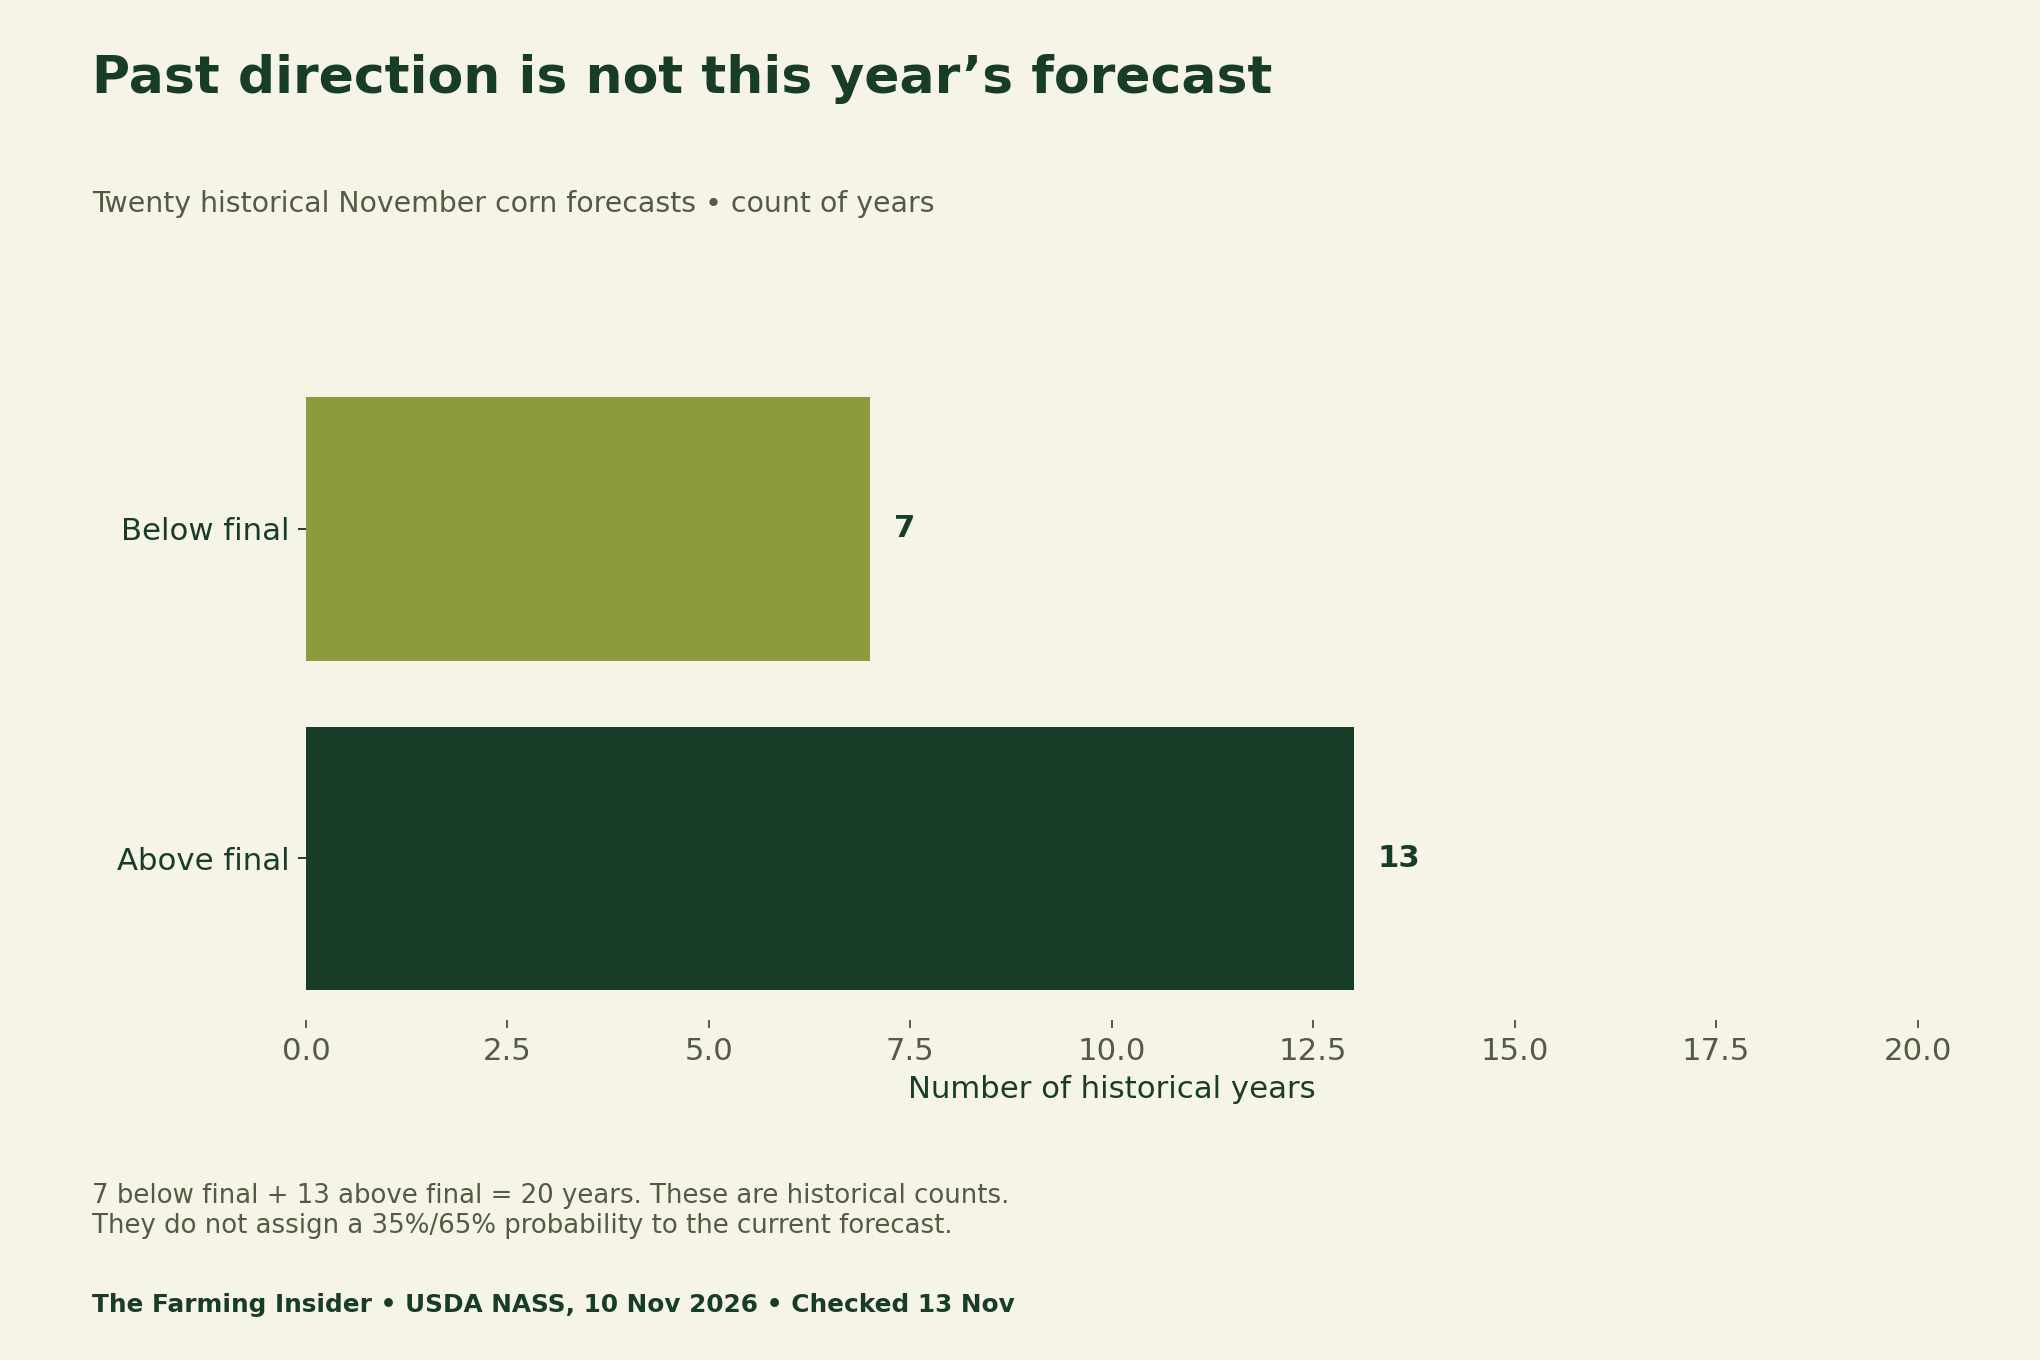
The same source records seven forecasts below the final figure and thirteen above it. NASS cautions against using this history to infer the direction of this year’s difference. Avoid turning those counts into an asserted probability for a new season.
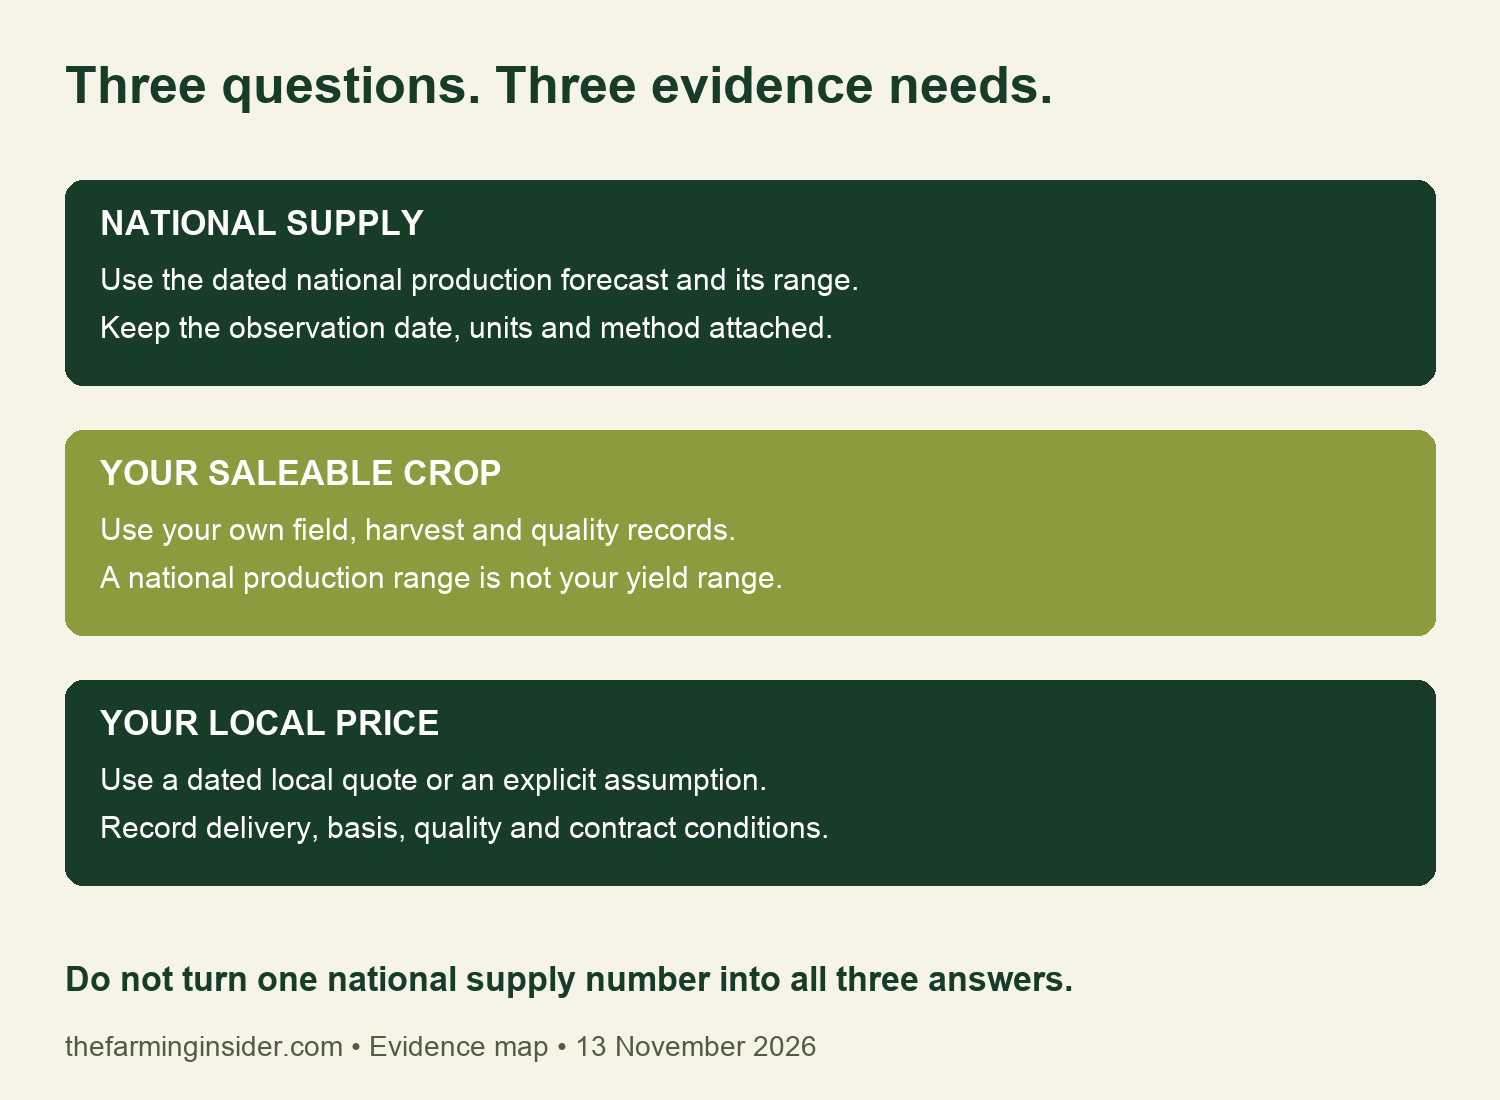
Separate national supply, your crop and your local price
A farm planning sheet needs different evidence at each level. National production describes the country. Saleable farm quantity requires field and harvest records, with quality and storage losses treated explicitly. A local net price requires a quote or a stated assumption with compatible delivery and contract terms.
Our operating-loan interest budget makes a related distinction between an asset value and repayment cash. A market headline also cannot answer every business question. Check which decision the evidence actually informs before adding it to a worksheet.
Use independent scenarios rather than a hidden price rule
The example below crosses fictional saleable quantities of 9,000, 10,000 and 11,000 bushels with assumed net prices of US$3.50, US$4.00 and US$4.50 per bushel. Each cell multiplies quantity by price. All nine combinations are deliberate stress cases, not predictions generated from national corn supply.
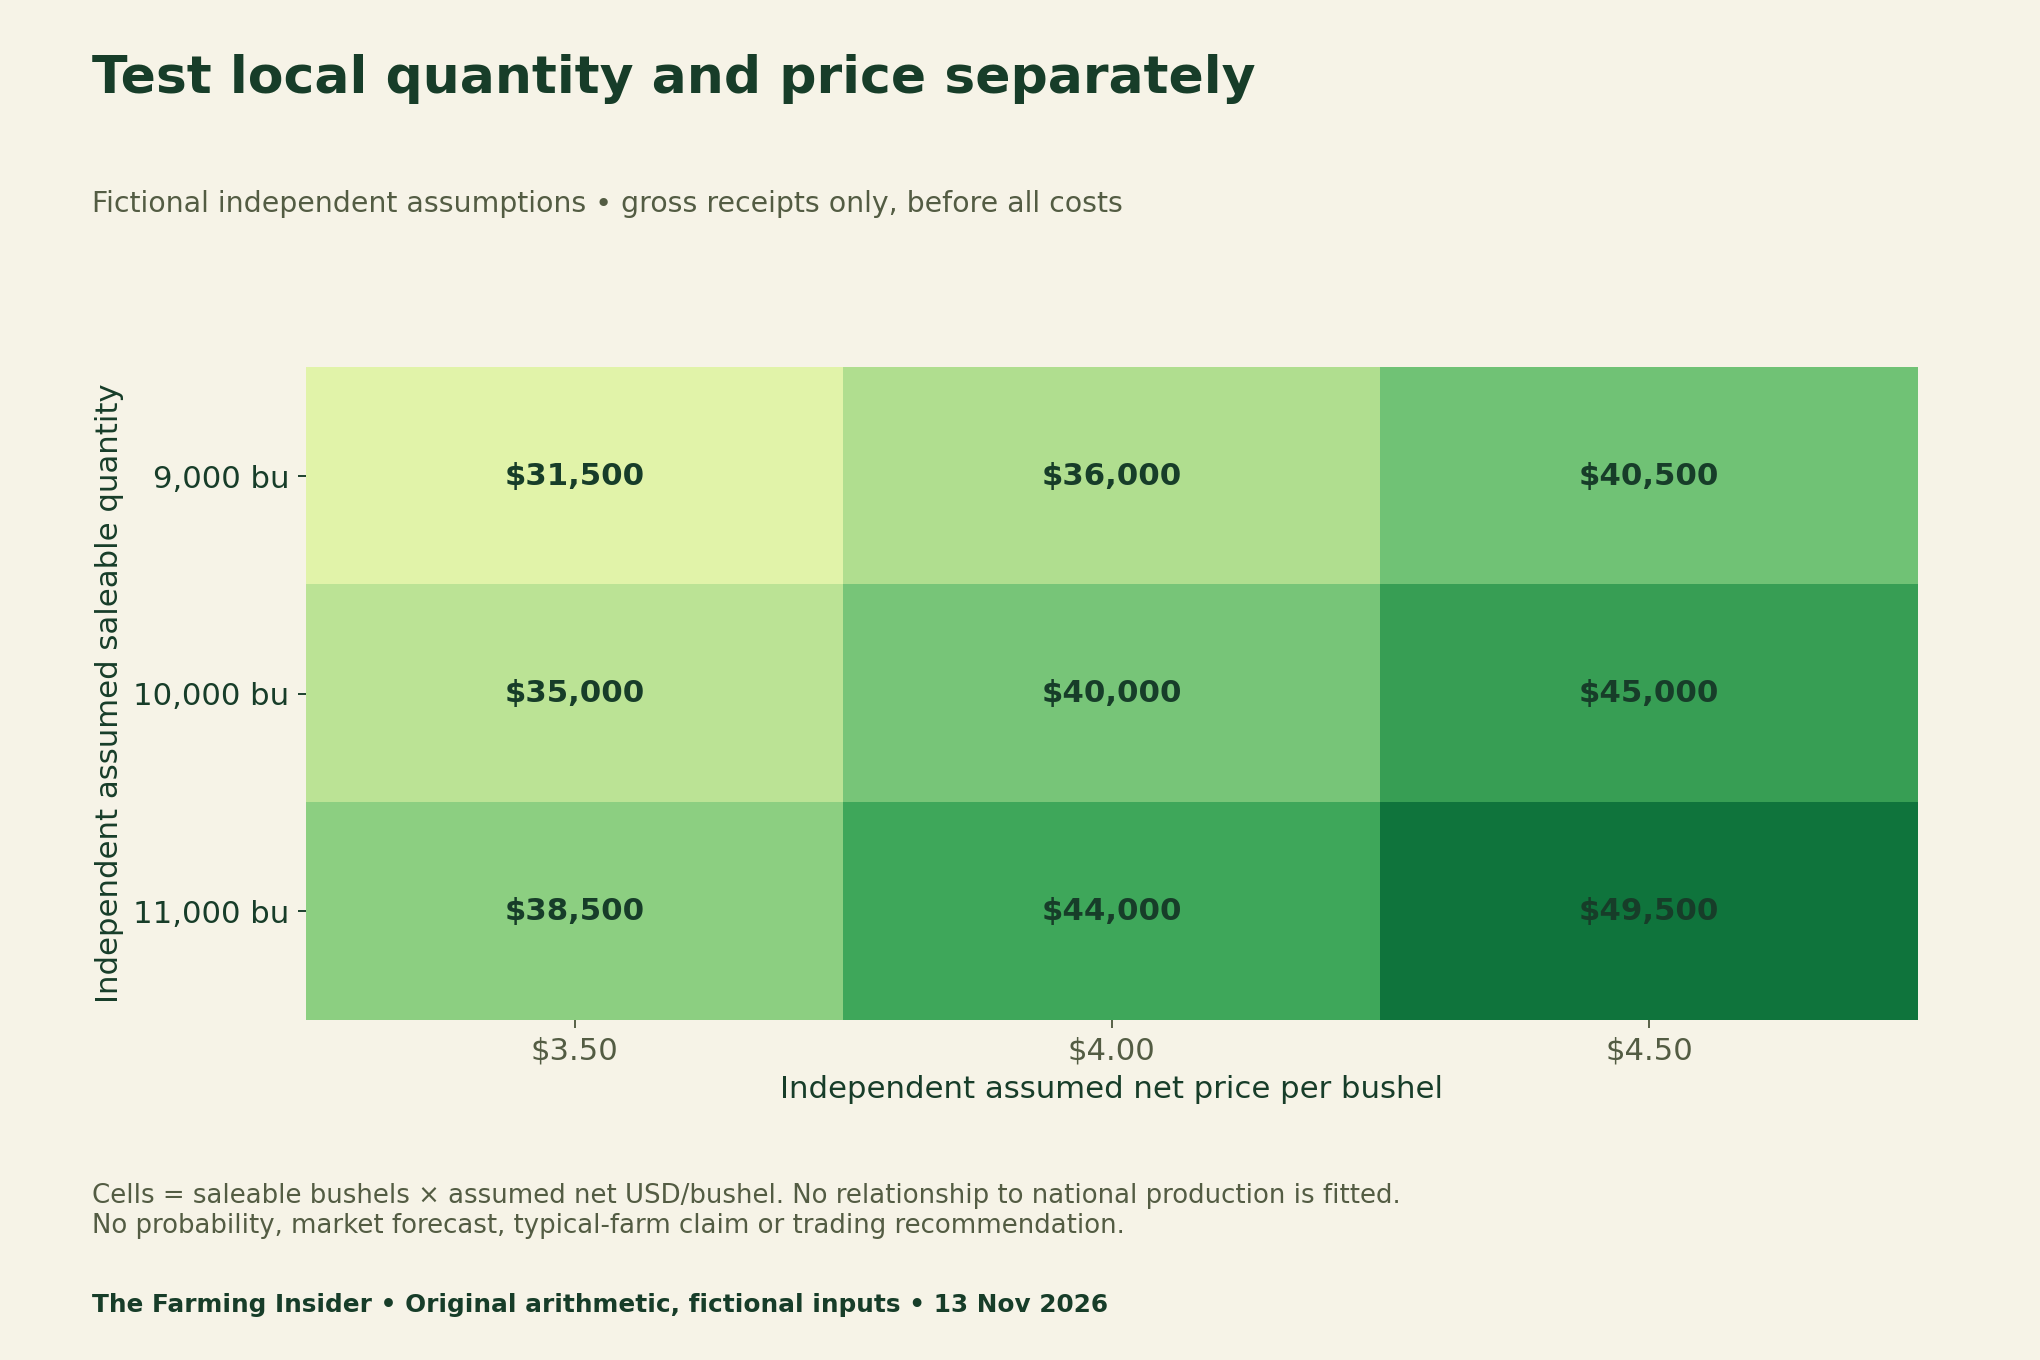
For example, 10,000 bushels at US$4.00 gives US$40,000 before costs. Write the assumptions above the result so another reader can reproduce it. If quality, deductions or delivery change the net price, explain those separately. Do not silently replace an assumption with an observed quote from a different place or month.
Download the evidence and planning files
Use the source-measures file to retain the release dates and units. The fictional matrix file lists every calculated cell. The blank market sheet leaves local quantity and price for your own evidence; it does not populate them from national supply. The claim checklist helps identify unsupported jumps.
- National forecast and historical reliability measures (CSV)
- Fictional independent grain-receipts scenarios (CSV)
- Blank grain-market assumptions sheet (CSV)
- Corn forecast claim-and-evidence checklist (CSV)
Method, boundaries and refresh notes
We transcribed selected official figures and drew original explanatory charts. Our calculations cover the range span and a separate fictional receipts matrix. The work does not fit a probability distribution, reconstruct individual historical years, estimate a local price response or calculate farm profit. Keep each chart’s scope and exclusions attached when reusing it.
Before the next planning discussion, check the official Crop Production release archive for a newer report. Record the release you used, the reference date and any changed inputs. This article addresses uncertainty interpretation; it does not replace the earlier task of checking whether a spreadsheet uses the correct data version.
Transform Your Agribusiness
Unlock your farm's potential with expert advice tailored to your needs. Get actionable steps that drive real results.
Get StartedSuggested citation: The Farming Insider (13 November 2026), “USDA Corn Forecast Uncertainty: Read the Range”, original visuals and planning worksheets based on the dated NASS report. Keep private farm records locally and seek appropriate professional advice for actual marketing or financing decisions.