




A Victoria irrigation water budget needs more than a headline about a dry year. It needs a clear estimate of crop demand, usable supply and delivery timing. New historical accounts show why keeping those numbers separate matters.
Victoria released its 2024–25 Water Accounts on 15 October 2026. Irrigation use rose 28.7% from the previous year, while accounted water availability fell 39.5%. These are historical statewide measures. They do not describe your current allocation or predict next season.
Below, five charts explain the evidence and a copyable worksheet turns it into a planning method. Our worked example finds an 80 ML gap on a hypothetical 100-hectare farm. It identifies a quantity to resolve, without assuming that buying water is the right response.
What the new water accounts actually measure
The Victorian Water Register release announcement dates the new publication. Its observation period is 2024–25, rather than October 2026. Keep both dates when citing the report.
In the DEECA Year in water tables, irrigation use rises from 2,440,484 to 3,140,262 ML. The increase is 699,778 ML. Accounted availability moves from 22,613,346 to 13,675,649 ML.
Available water combines streamflows, defined groundwater availability, treated wastewater and desalinated production. It is not a reservoir balance or a total of farm allocations. Therefore, subtracting irrigation use from that total would not reveal water available for your business.
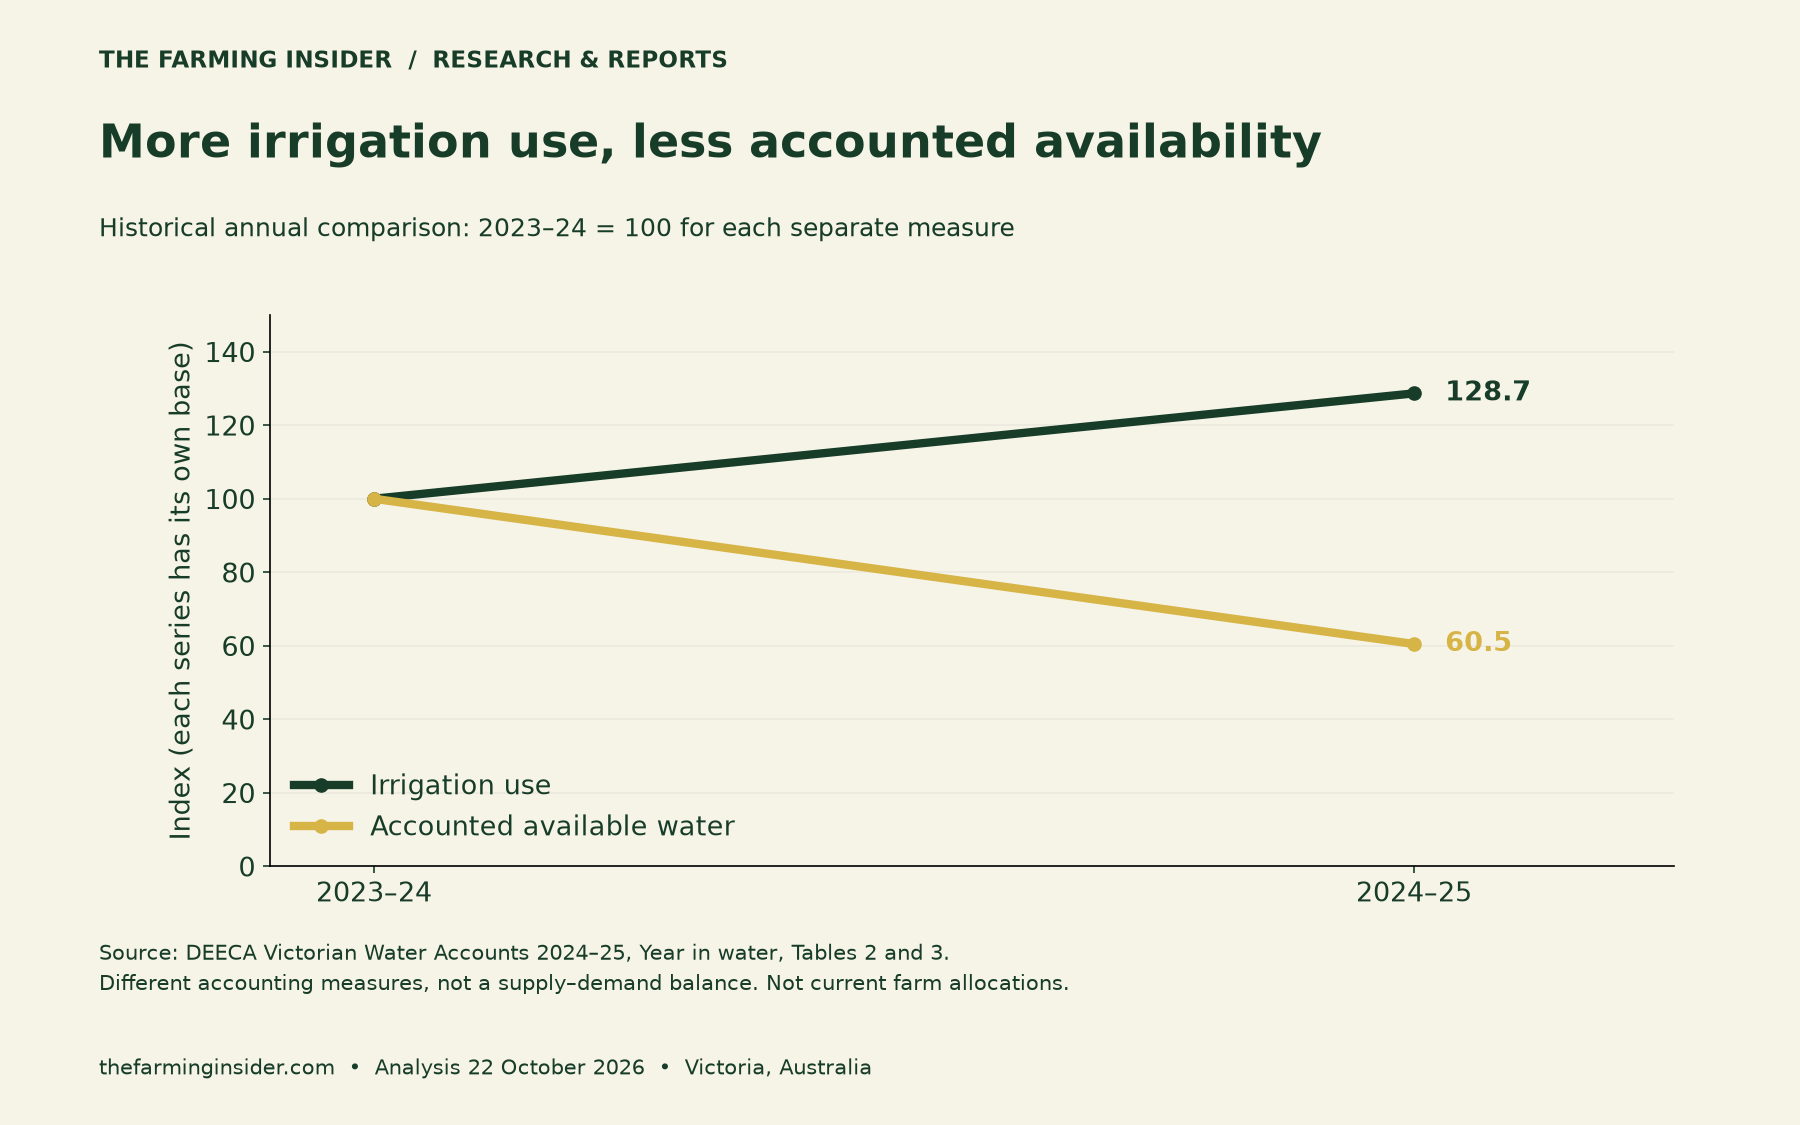
The index sets each series to 100 in 2023–24. Their next values are 128.7 and 60.5. This shows relative change across two distinct measures. It does not show an efficiency score, an allocation percentage or a farm-level shortage.
Keep storage separate from annual availability
Major storages held 10,100 GL at the end of June 2024 and 7,480 GL at the end of June 2025. Reported capacity filled fell from 82% to 61%, according to DEECA’s surface-water accounts. That is a fall of 21 percentage points.
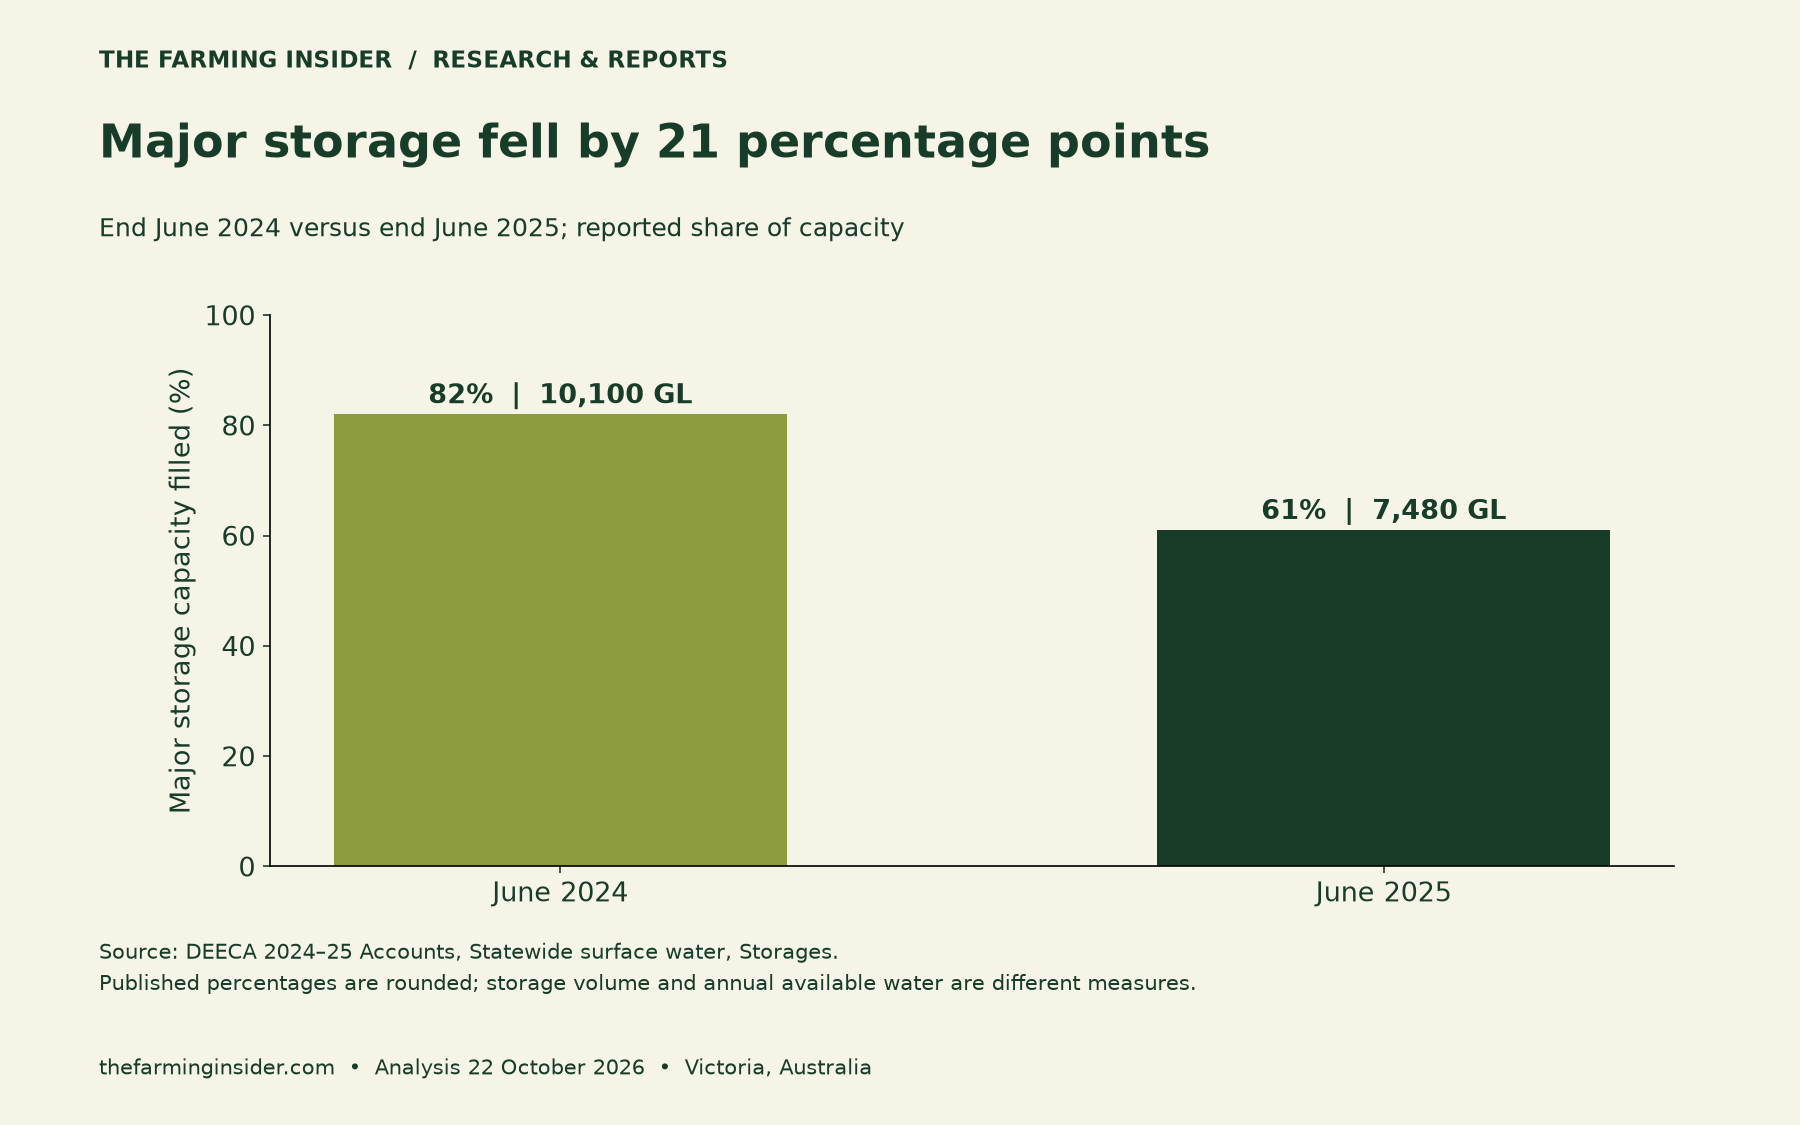
A storage snapshot tells a different story from an annual flow measure. For example, water can enter and leave a reservoir during a year. Neither number alone tells you the volume that your farm can receive when it needs it.
Also, the published percentages are rounded. Do not calculate a precise reservoir capacity by dividing the reported volume by a rounded percentage. Use the source’s capacity measure when that is the question you need to answer.
Where surface-water irrigation diversions occurred
Table 4 records 2,789,112 ML of surface-water irrigation diversions in 2024–25. Murray accounts for 1,312,721 ML and Goulburn for 1,117,792 ML. Our residual for all other basins is 358,599 ML.
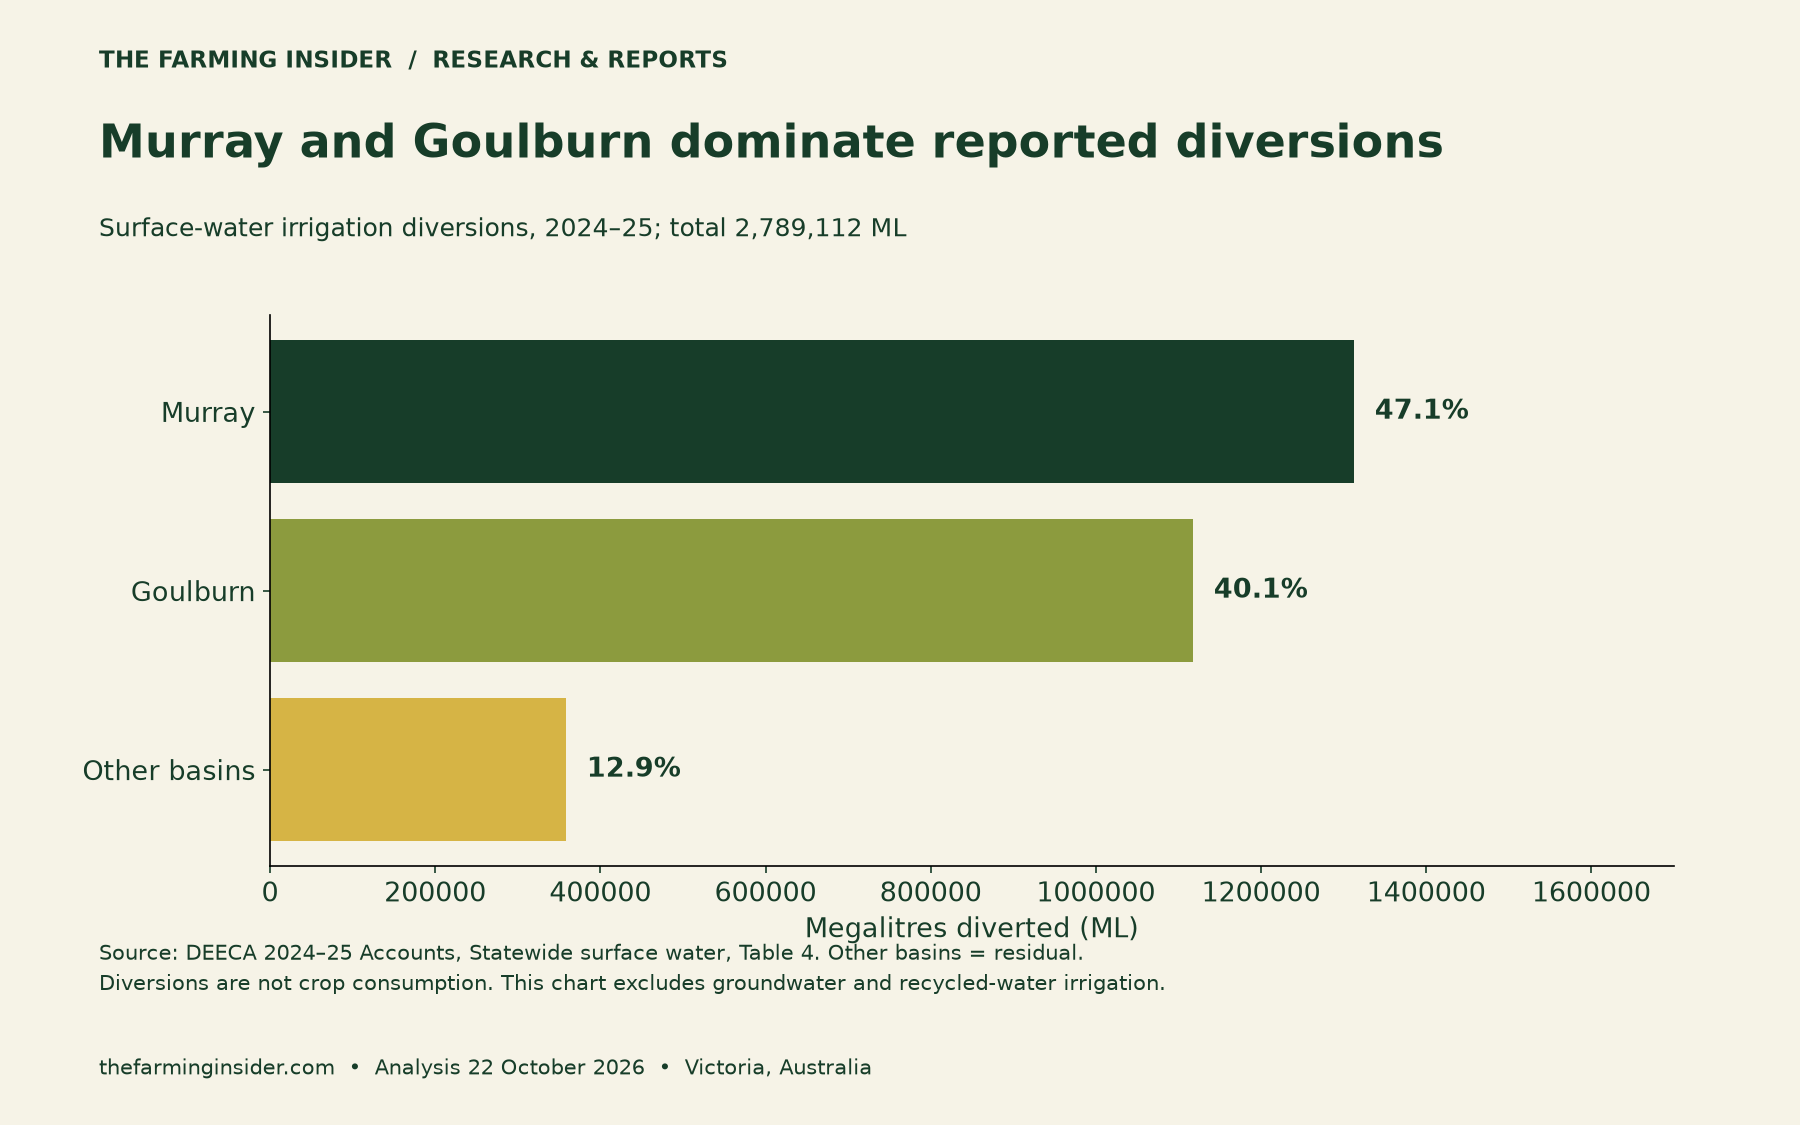
The calculated shares are 47.1%, 40.1% and 12.9%, respectively. Rounding explains why they sum to 100.1%. These figures concern surface-water diversions, not water consumed by crops. They also exclude groundwater and recycled-water irrigation.
Use that distinction when comparing a local operation with a statewide headline. A farm’s source mix, delivery system and production plan may differ greatly from the aggregate. The basin chart provides context; it does not supply a crop watering rate.
Build a Victoria irrigation water budget for your farm
Start with hectares and a planning requirement that suits the crop, soil and season. Next, list supply that you have confirmed is usable. Finally, reconcile the dates and constraints. A total that looks adequate on paper may still arrive too late.
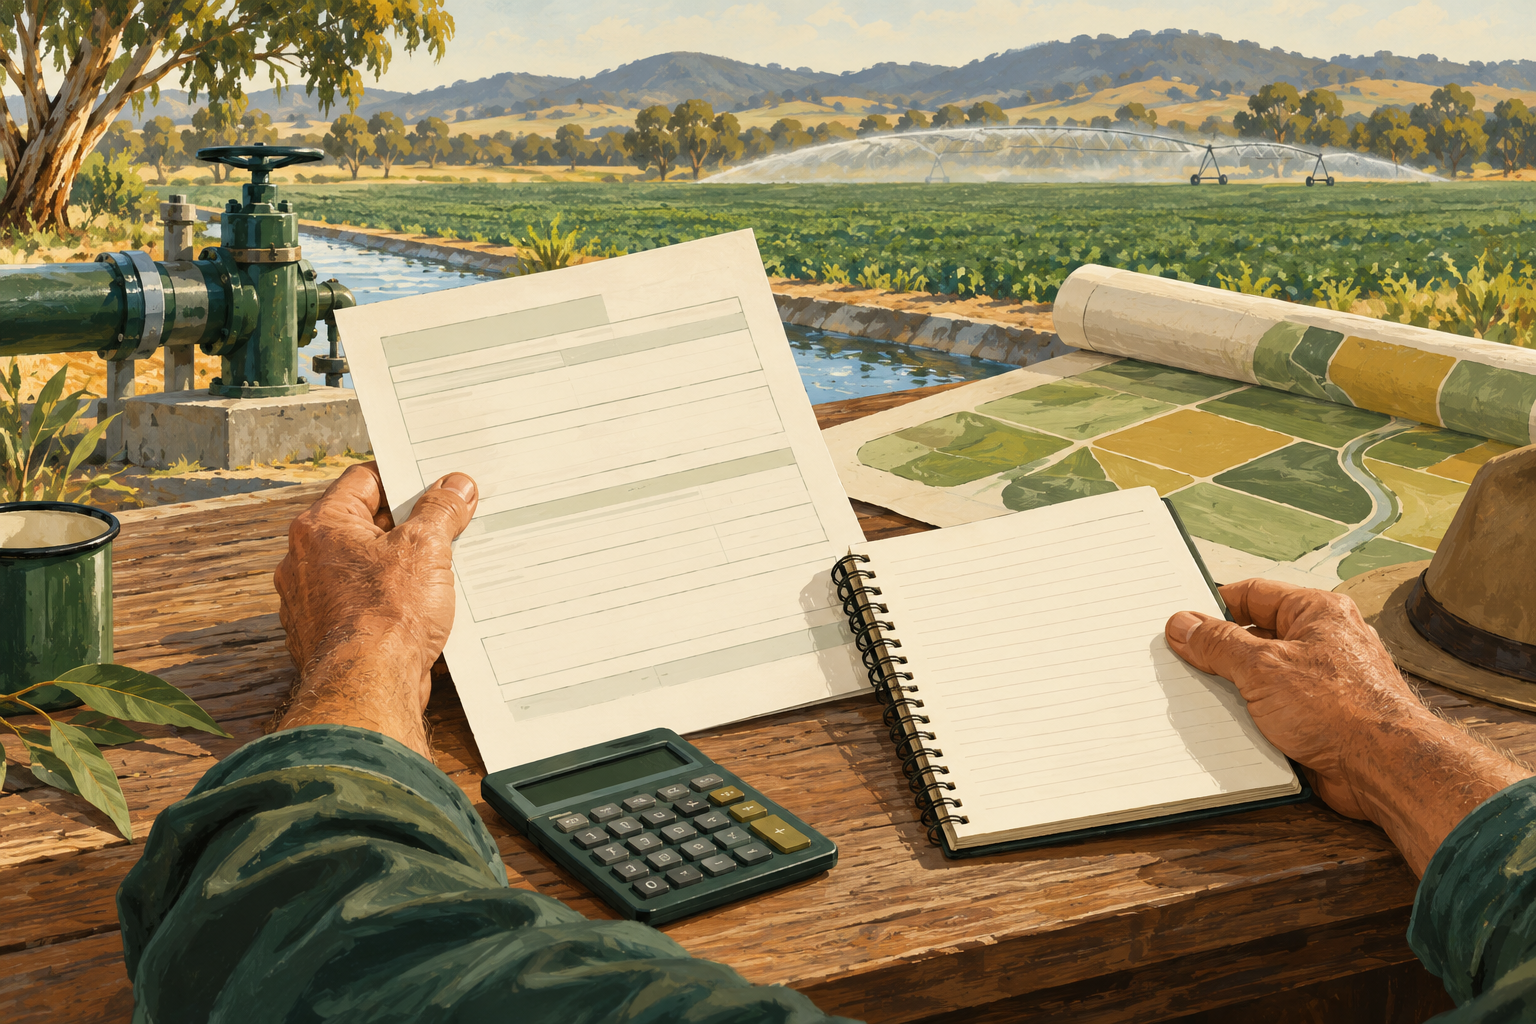
Our hypothetical farm plans to irrigate 100 hectares at 4 ML per hectare. Its requirement is 400 ML. With 320 ML of confirmed usable supply, the unresolved gap is 80 ML. Every input here is illustrative.
Transform Your Agribusiness
Unlock your farm's potential with expert advice tailored to your needs. Get actionable steps that drive real results.
Get Started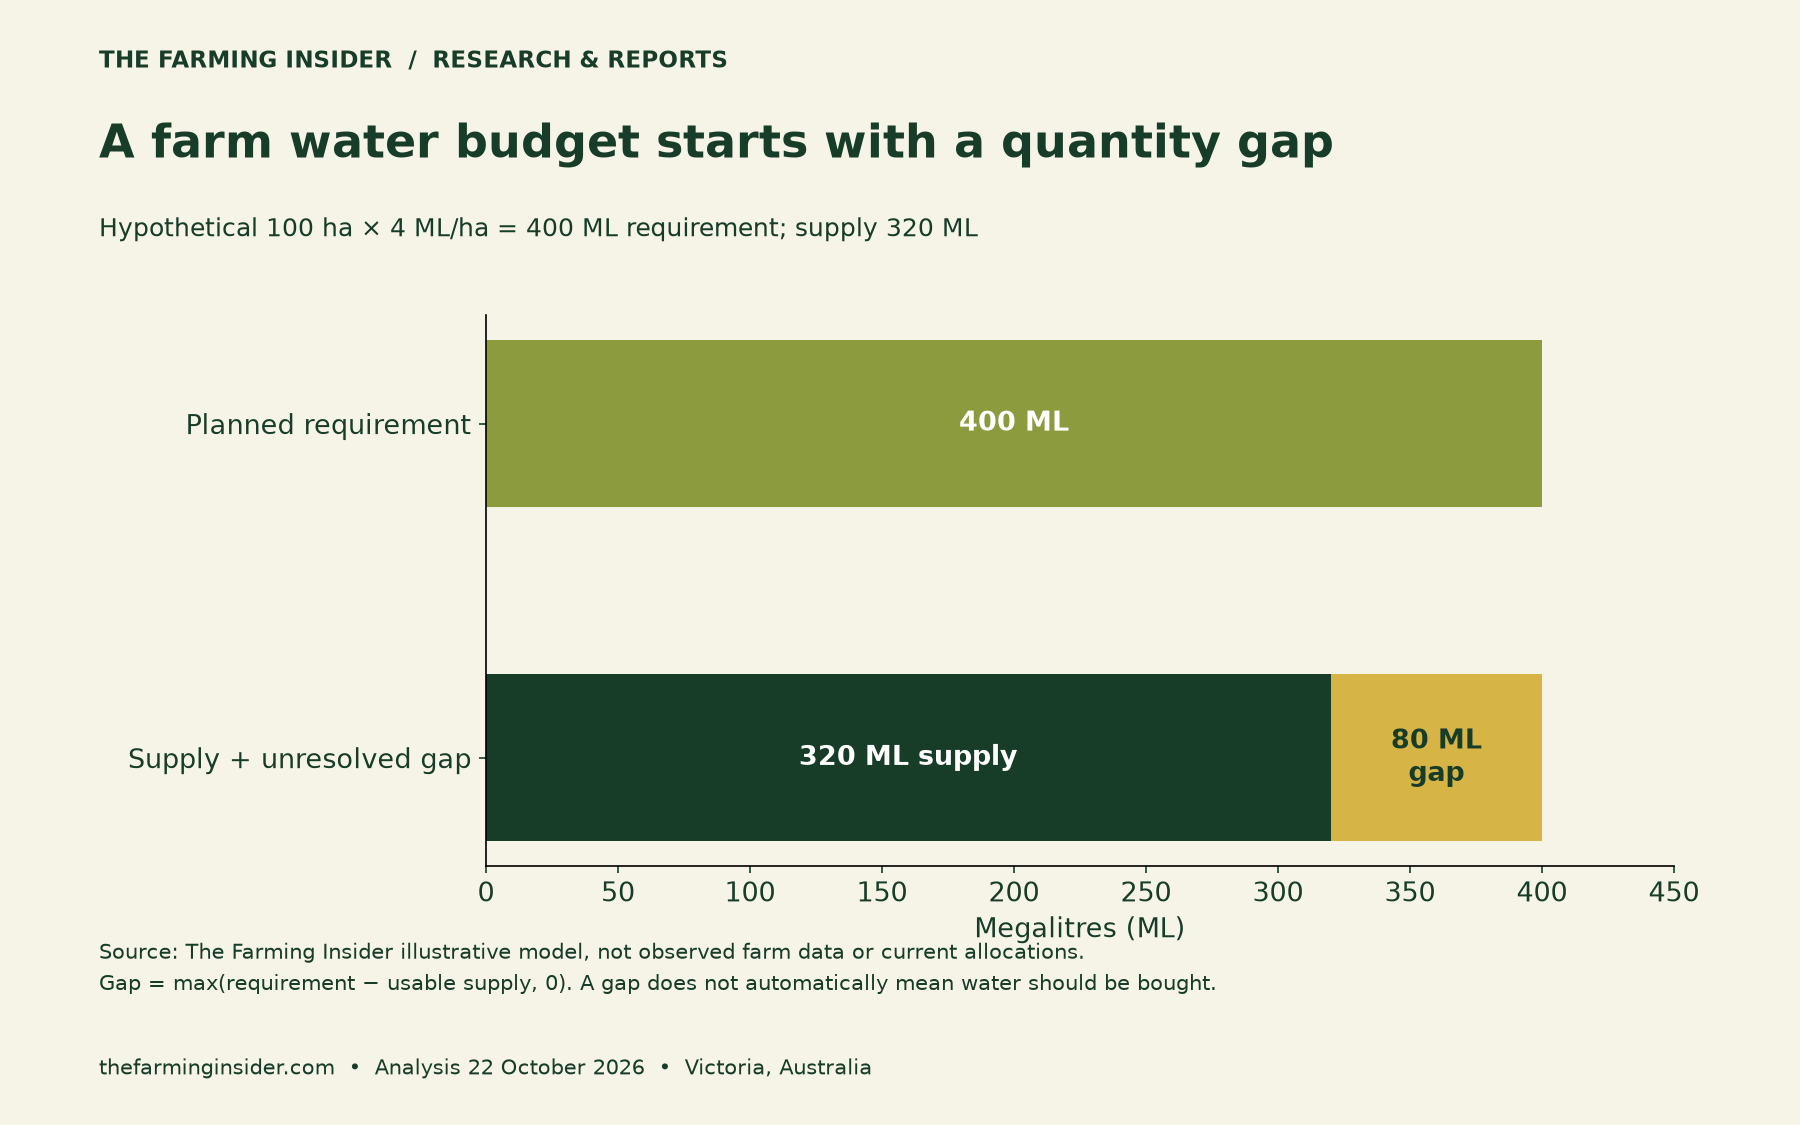
Requirement = hectares × planned ML per hectare.
Unresolved gap = the larger of zero and requirement minus usable supply.
These equations make the assumptions visible. They do not determine crop needs, legal access, purchase timing or the best use of cash. Replace the example with current records and appropriate local agronomic advice.
A copyable water-budget worksheet
| Input or check | Illustrative entry | Your evidence |
|---|---|---|
| Irrigated area | 100 ha | Field plan and crop area |
| Planned application requirement | 4 ML/ha | Crop, soil, rainfall and system assumptions |
| Total requirement | 400 ML | Area multiplied by requirement |
| Usable supply | 320 ML | Current allocation, usable carryover and other confirmed supply; avoid double counting |
| Unresolved quantity | 80 ML | Requirement less usable supply, floored at zero |
| Delivery and timing | Enter local constraints | Provider advice, ordering windows and pump capacity |
| Cash budget | Enter verified local quotes | Water, delivery, pumping, application and contingency costs |
Record entitlement separately from confirmed usable supply. Do not add the same water twice through overlapping account entries. Date each input, identify its source, and flag anything that remains conditional.
Stress-test demand and usable supply together
At 100 hectares, moving the requirement from 4 to 5 ML/ha adds 100 ML. If usable supply stays at 320 ML, the gap rises from 80 to 180 ML. Alternatively, supply of 240 ML leaves a 160 ML gap at the original requirement.
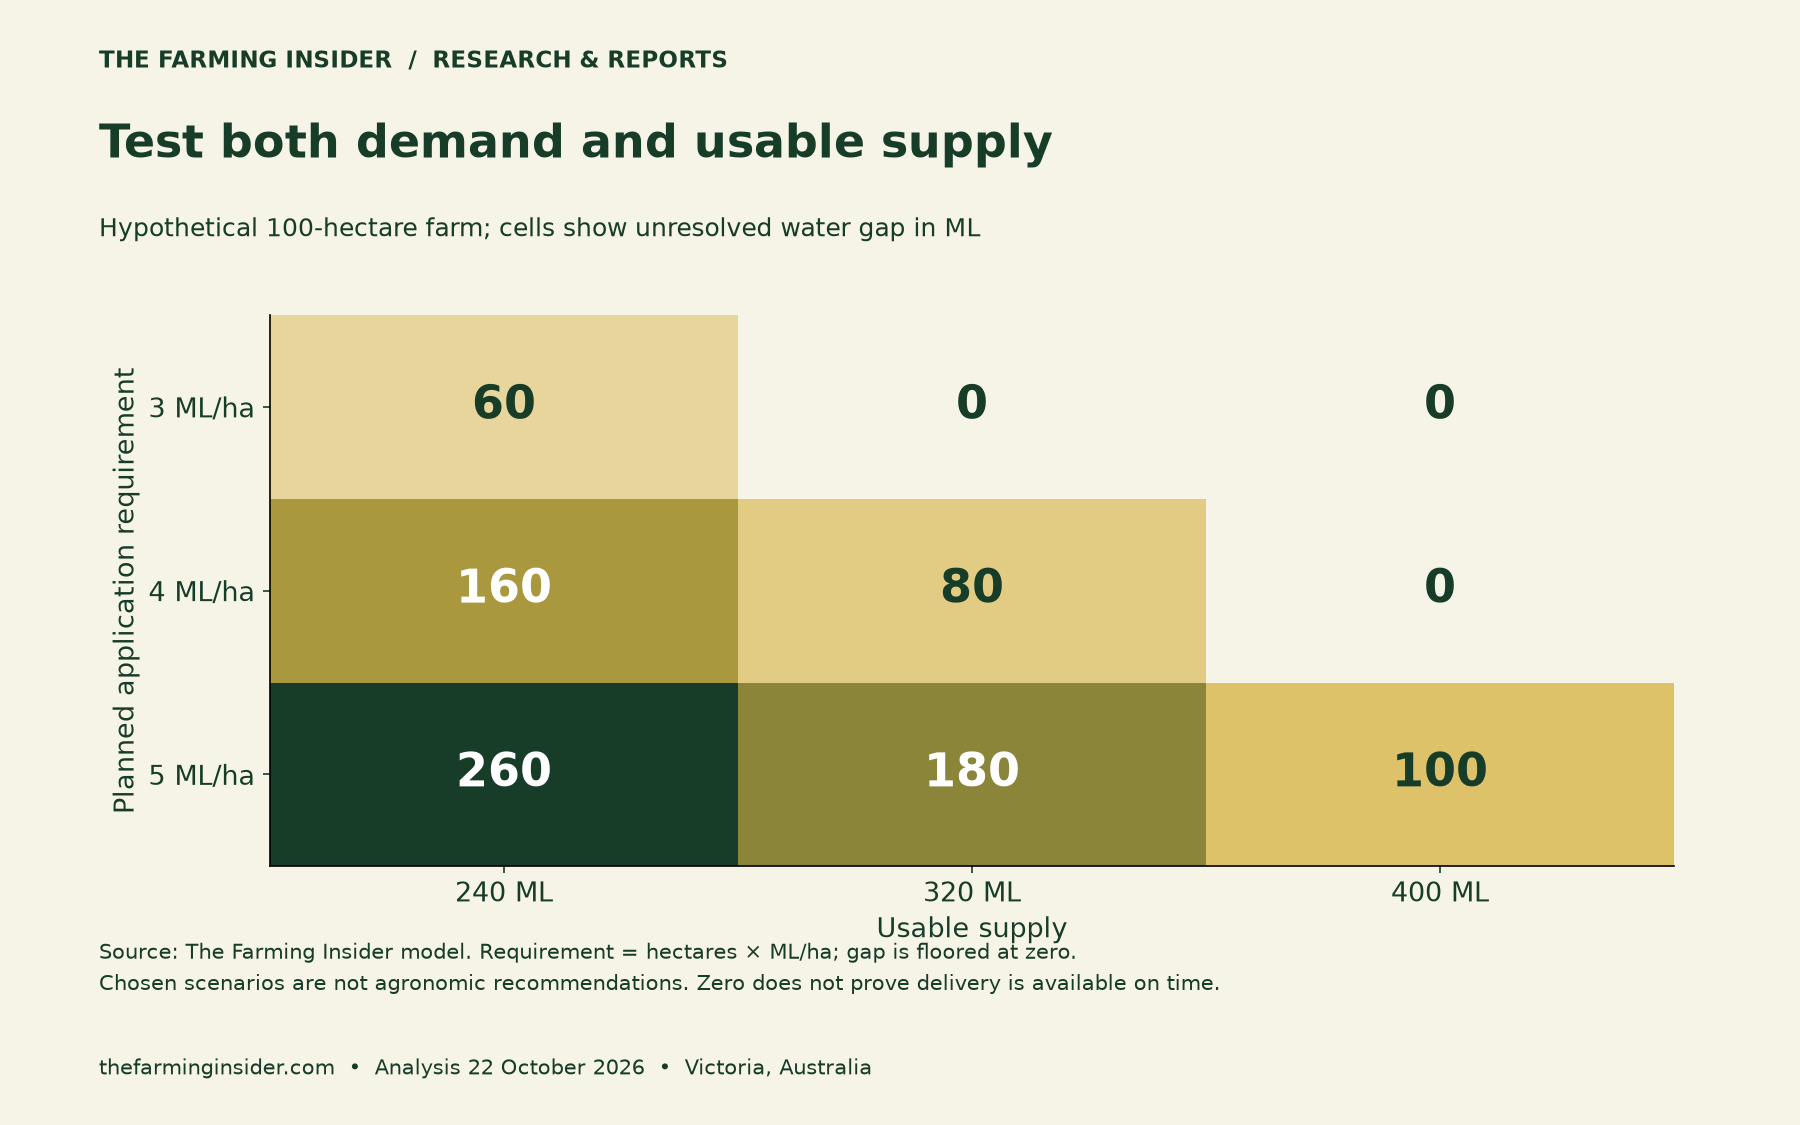
A zero in the matrix means the selected volume covers the selected requirement. However, it does not prove timely delivery or a profitable crop. Check those questions separately before committing to an operating plan.
For a cash sensitivity check, multiply any unresolved quantity by a verified marginal supply cost. Include applicable delivery and pumping costs on a consistent basis. For example, each additional A$10 per ML would change an 80 ML supply scenario by A$800. This is arithmetic, not a current water-price quote.
Our guide to eco-friendly irrigation solutions offers related system context. For budgeting across other operations, see our farm diesel cost analysis. Keep each calculation tied to its own units and verified inputs.
Methods, source checks and limitations
We checked the official accounts on 22 October 2026. The annual comparison uses Year in water Table 2 for availability and Table 3 for irrigation use. Storage figures and basin diversions come from the surface-water section and its Table 4.
Percentage change equals the new value divided by the old value, minus one, multiplied by 100. We calculate before rounding. Basin shares use the surface-water irrigation total as their denominator. One GL equals 1,000 ML.
The farm scenarios are our own transparent illustrations. They are not a survey, a forecast or recommended application rates. The accounts cannot establish today’s water prices, your allocation, crop profitability or why an individual farm used more water.
Before using this Victoria irrigation water budget, refresh your local supply and delivery information. Keep the historical comparison as context, then make the operational decision from current farm evidence.


