






The 2027 Class III and Class IV milk price forecast moved in opposite directions in USDA’s November outlook. Class III fell five cents to US$16.85 per hundredweight, while Class IV rose twenty cents to US$19.10. All milk edged up five cents to US$20.50. A headline about the all-milk increase therefore leaves out an important split.
The 10 November 2026 WASDE report, printed page 34, lets readers compare October and November projections for the same annual horizon. We reproduce those rows, calculate the revisions and keep product prices separate. None of the figures is a processor’s offer or a guaranteed farm payment.
2027 Class III and Class IV milk price forecast: keep the series separate
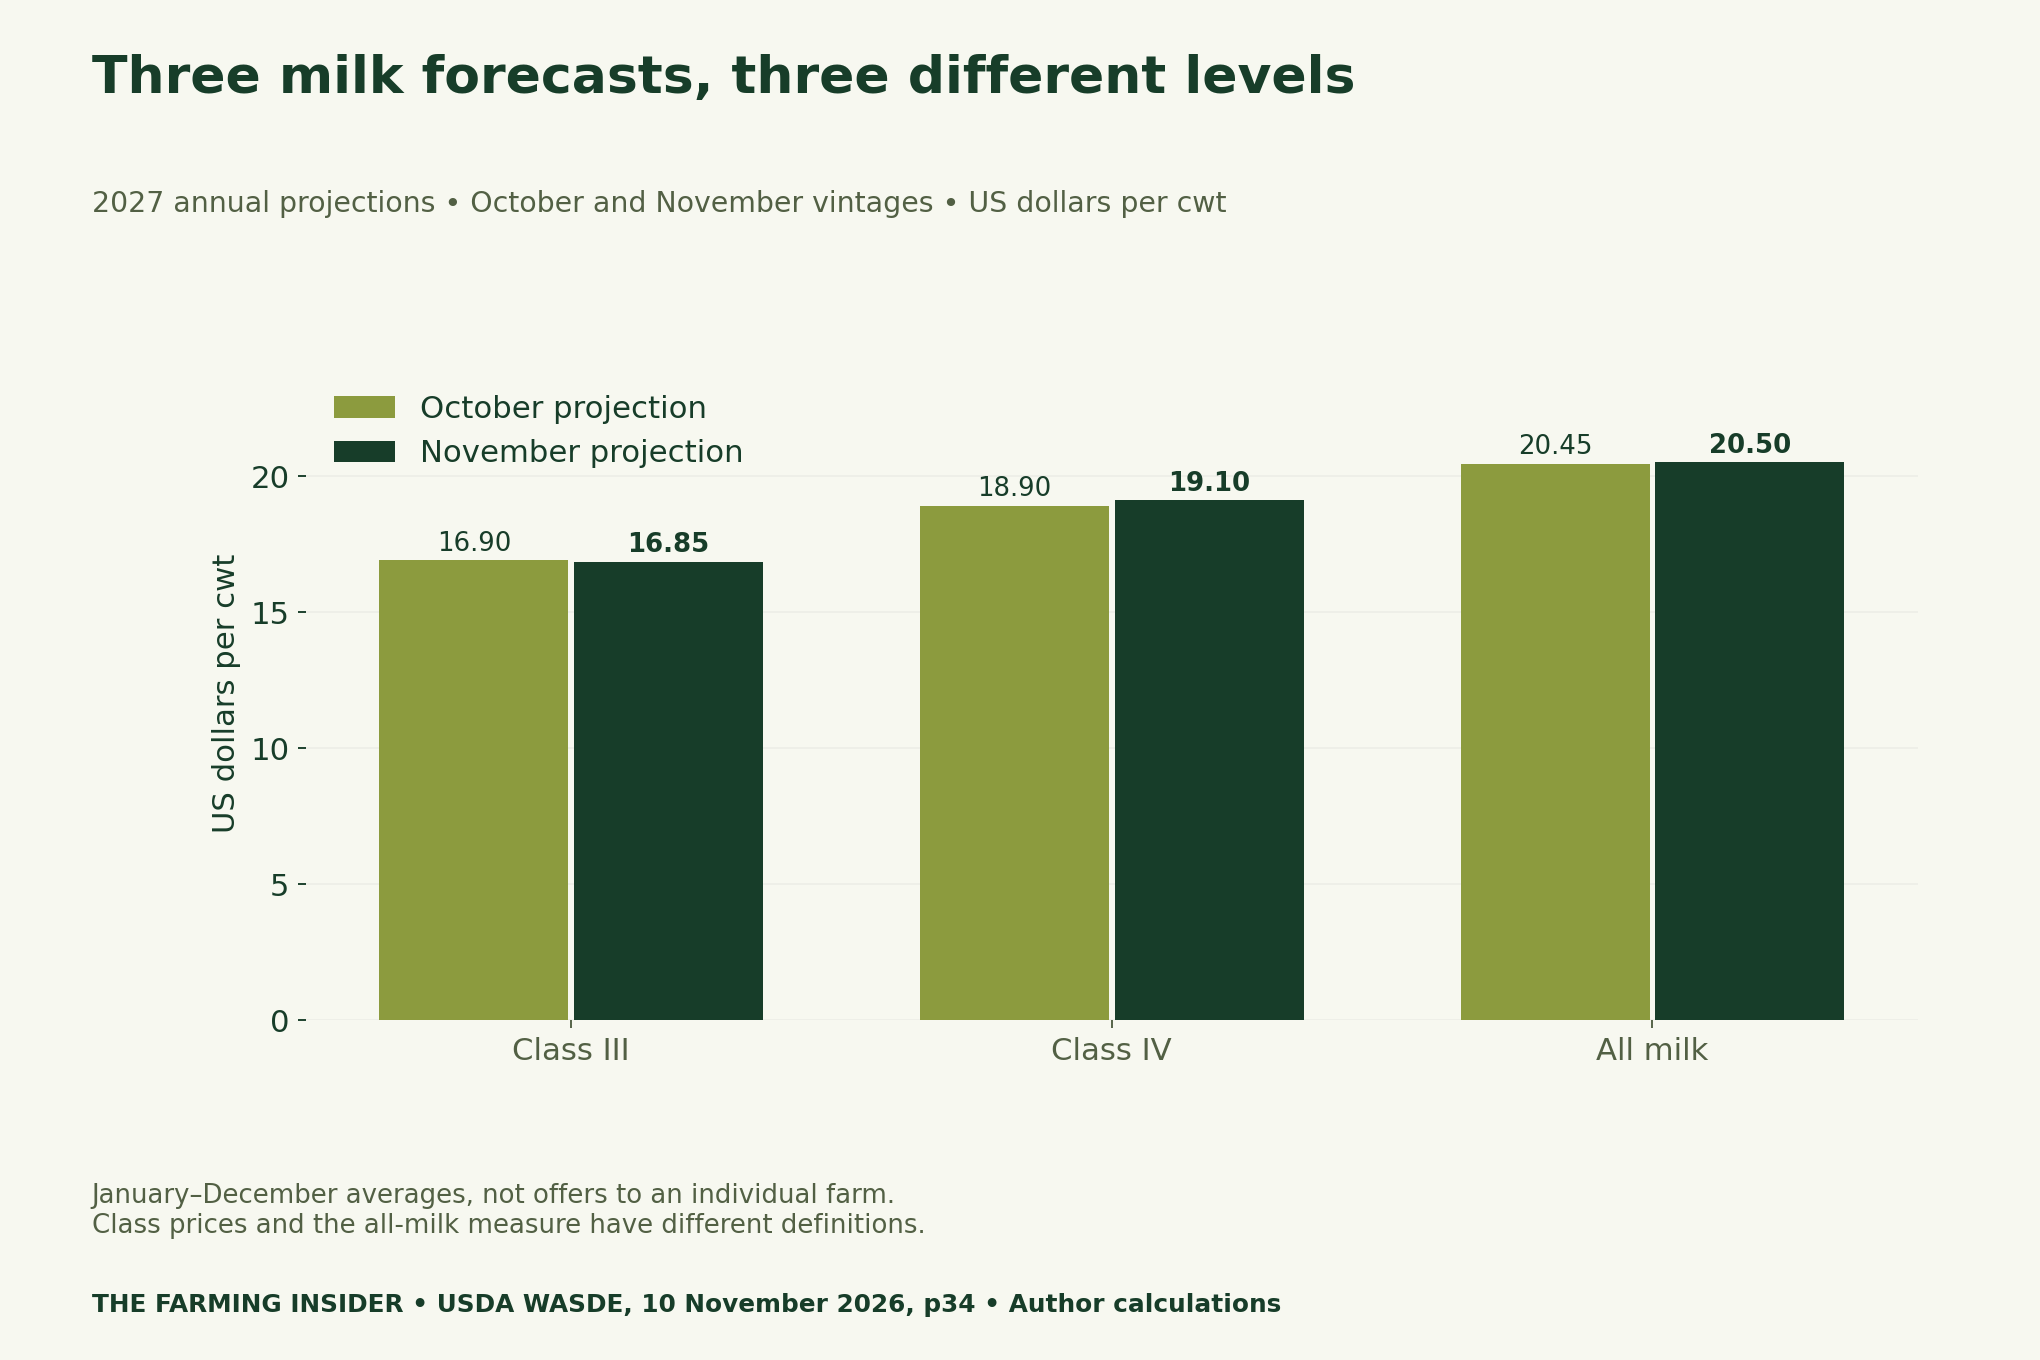
The table’s footnotes define annual Class III and Class IV as averages of monthly minimum Federal order milk prices for their respective uses. All milk instead describes monthly prices received by farmers at average test, averaged across the year. Its footnote excludes deductions authorized by legislation.
Consequently, do not calculate all milk as a simple average of these two class benchmarks. Shared units permit a labelled numerical comparison; they do not erase the measures’ definitions. A farm statement needs its own formula, relevant tests and period before any benchmark can be connected to receipts.
Separate the size of a forecast from its revision
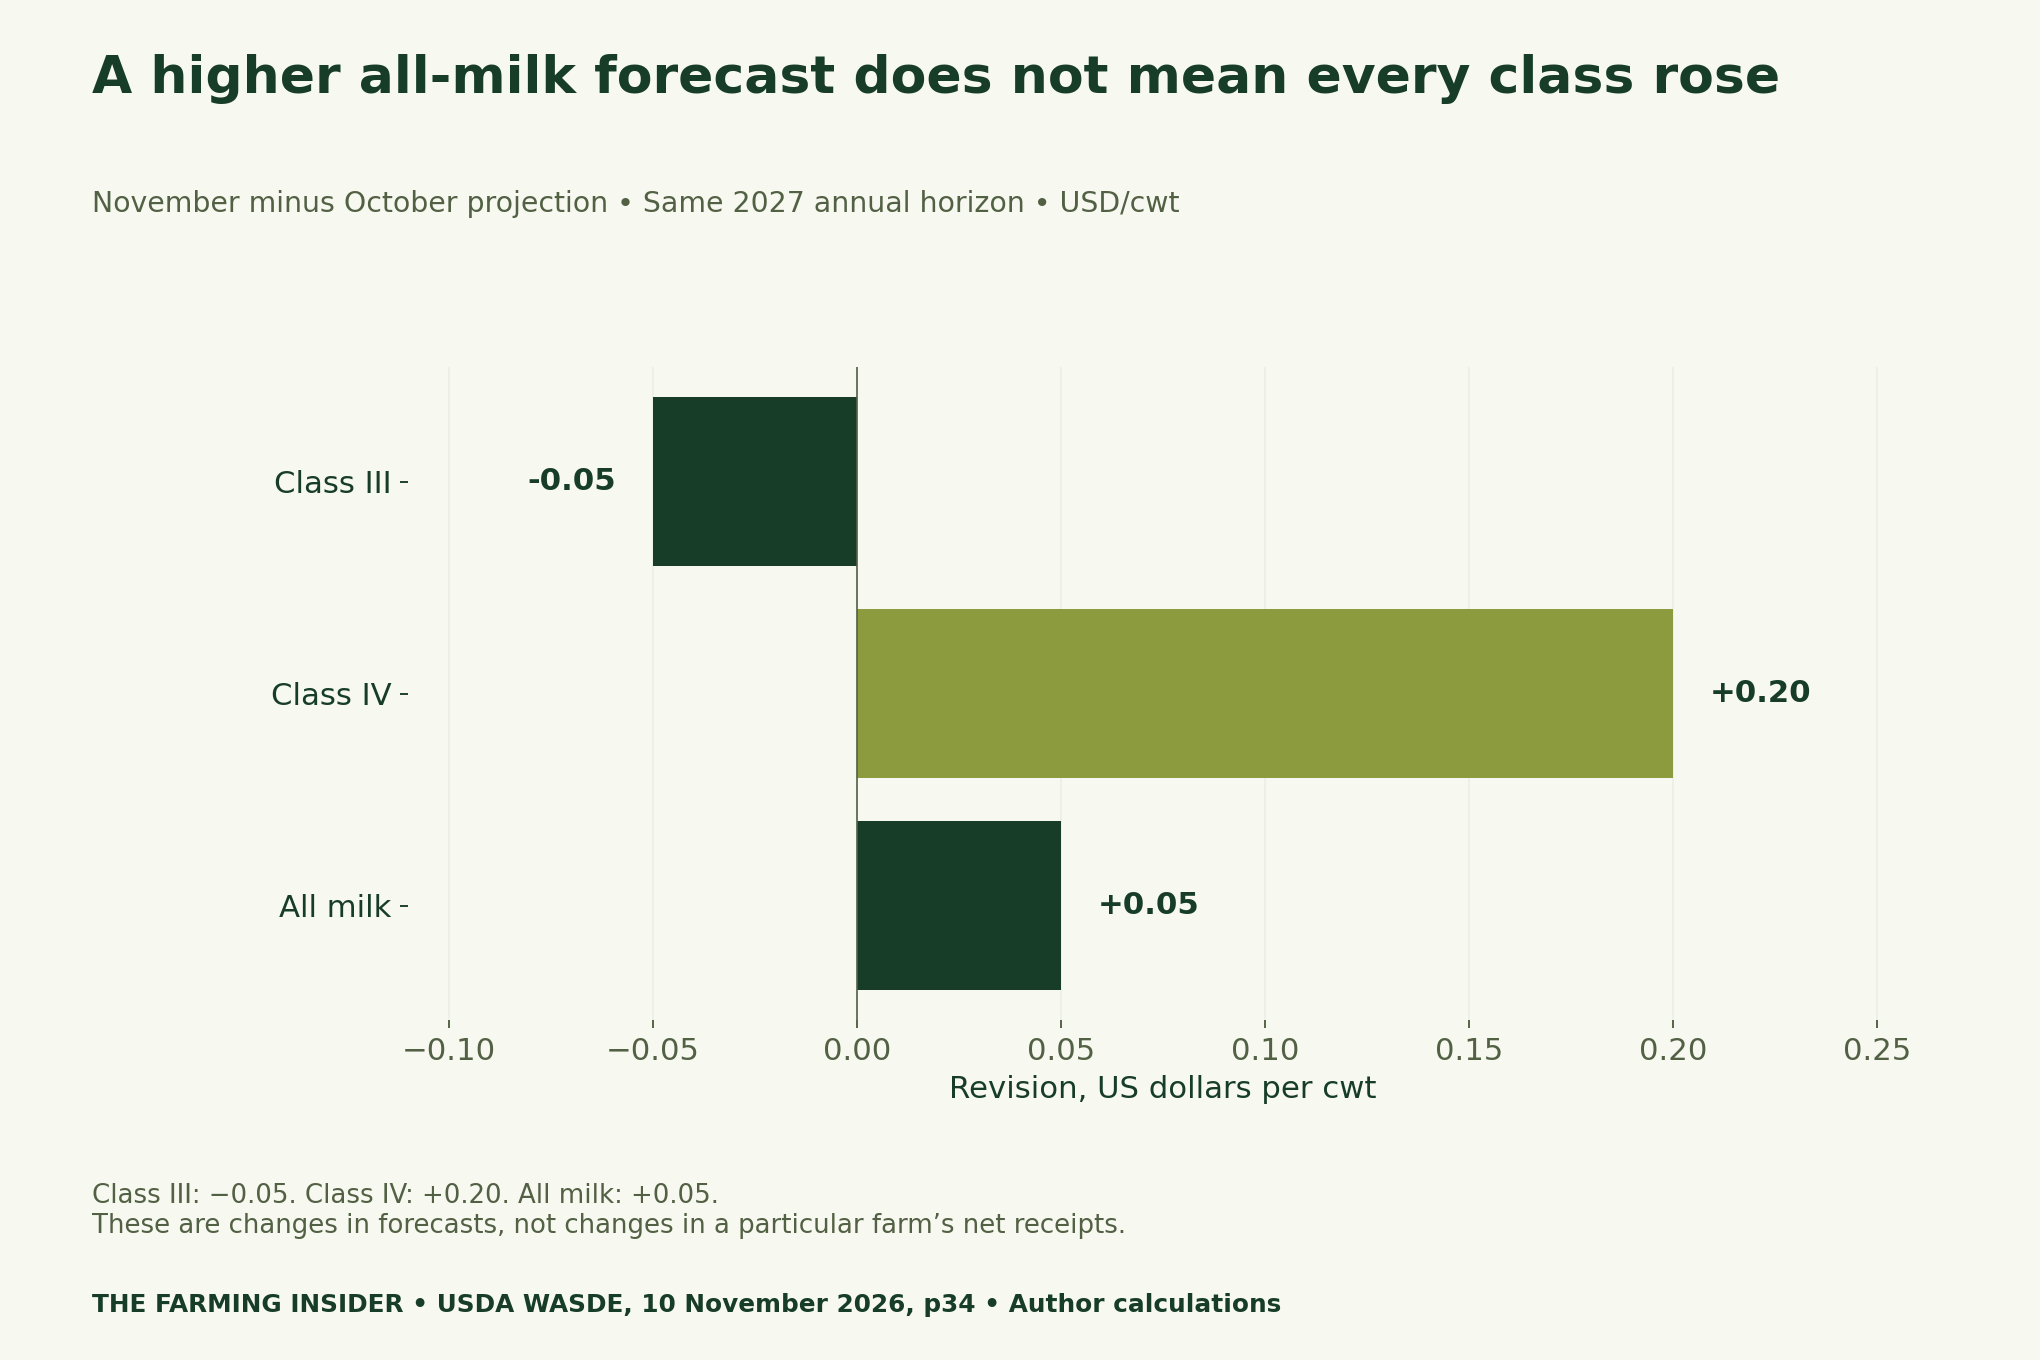
Our calculation is November projection minus October projection, with 2027 held fixed. This is not a comparison of 2026 with 2027. Nor does it compare a forecast with an actual price. Keep both the report date and forecast year visible when transferring the values into a planning workbook.
The differences are small relative to the benchmark levels, so a separate revision chart is useful. It reveals direction without truncating the level chart to exaggerate the movement. The source CSV retains the underlying values, allowing readers to reproduce both views.
The class spread widens, but it is not a promised premium
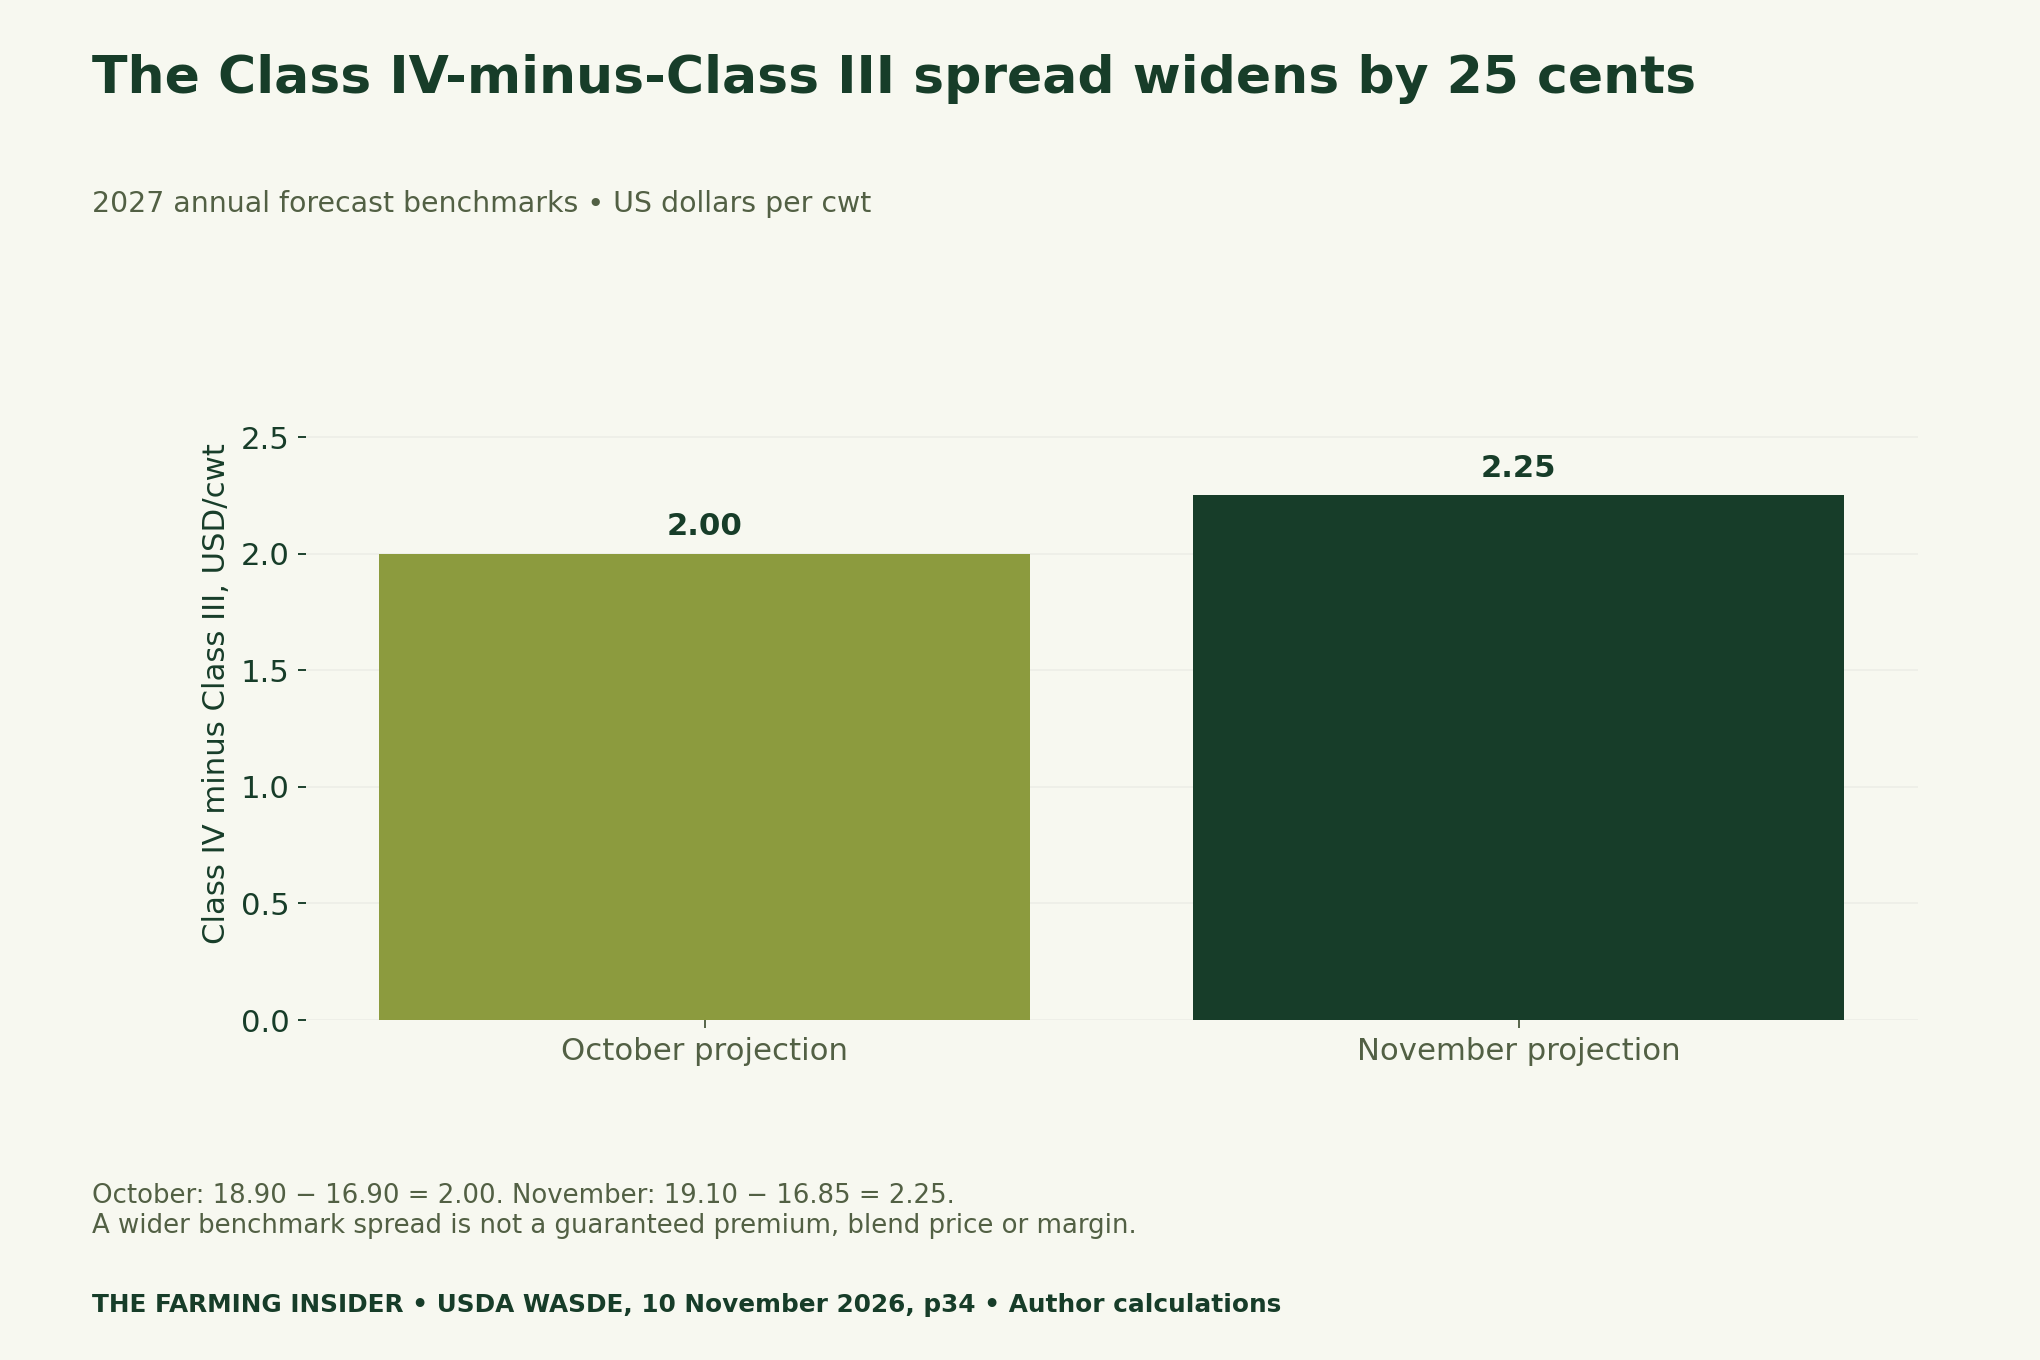
In October, subtracting 16.90 from 18.90 gives US$2.00/cwt. In November, 19.10 minus 16.85 gives US$2.25/cwt. The widening is therefore US$0.25/cwt. The calculation has a clear definition and can be checked without assuming any farm changes its milk destination.
A spread alone does not show which class exposure a producer actually has. It also cannot establish pooling outcomes, component revenue, deductions or delivery terms. Use it as a question for the relevant adviser or processor, with the actual statement and contract available.
Product prices use another unit
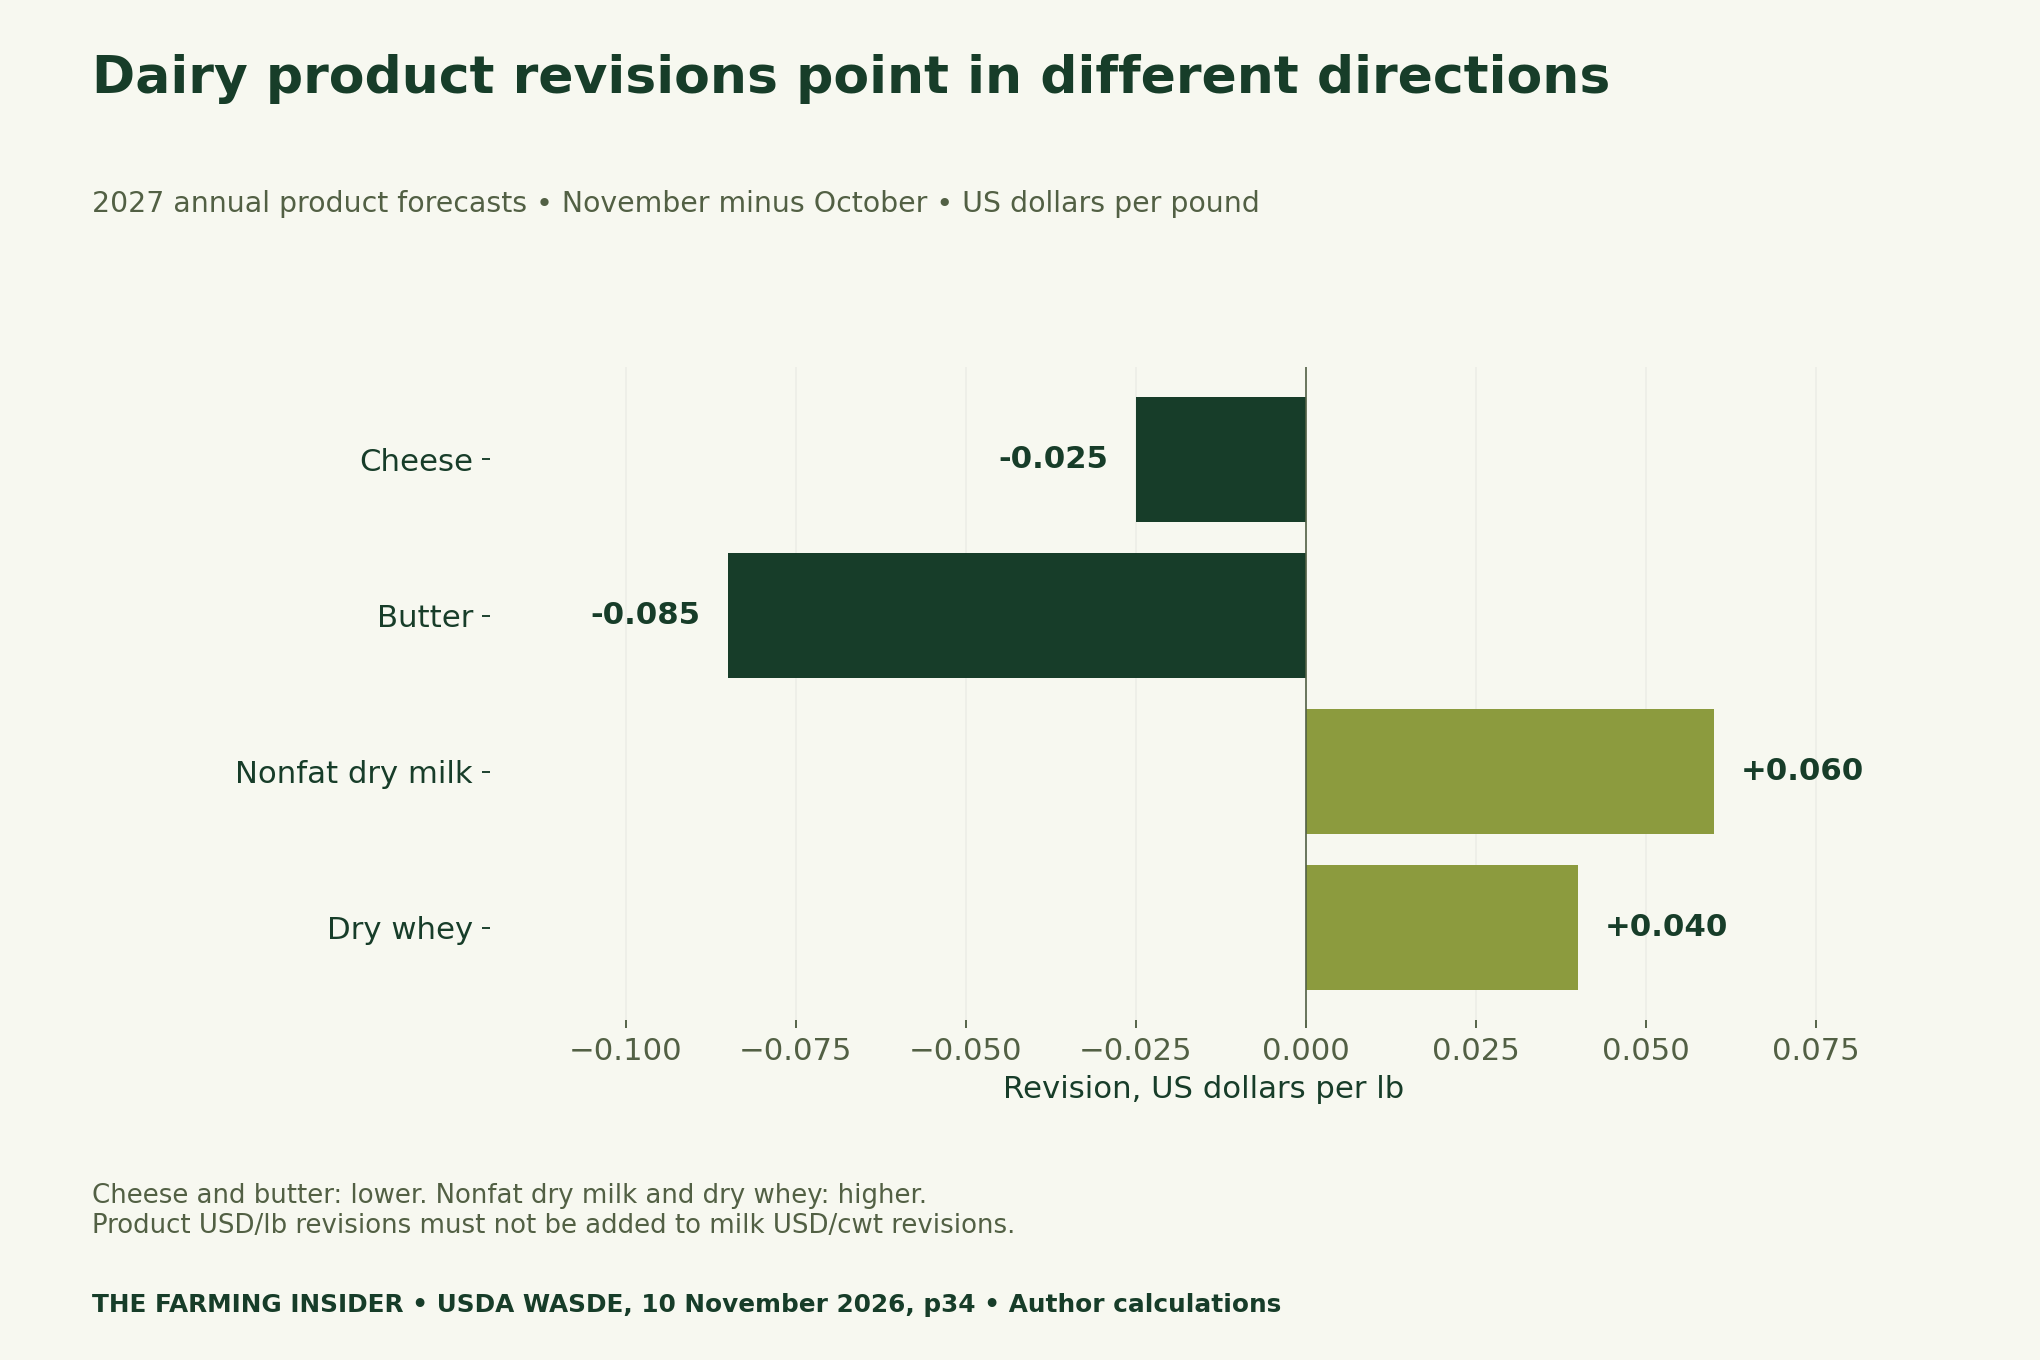
USDA’s accompanying discussion links the class divergence to differing product-price changes. However, the chart is a comparison of published forecasts, not our independent model of price formation. It does not assign a product-price movement directly to an individual farm’s cheque.
Keep the unit column when sorting or joining these rows. Adding a butter revision in dollars per pound to a milk revision in dollars per hundredweight would have no valid interpretation. A spreadsheet can perform that addition even when the resulting number is meaningless.
Map the farm’s own milk statement
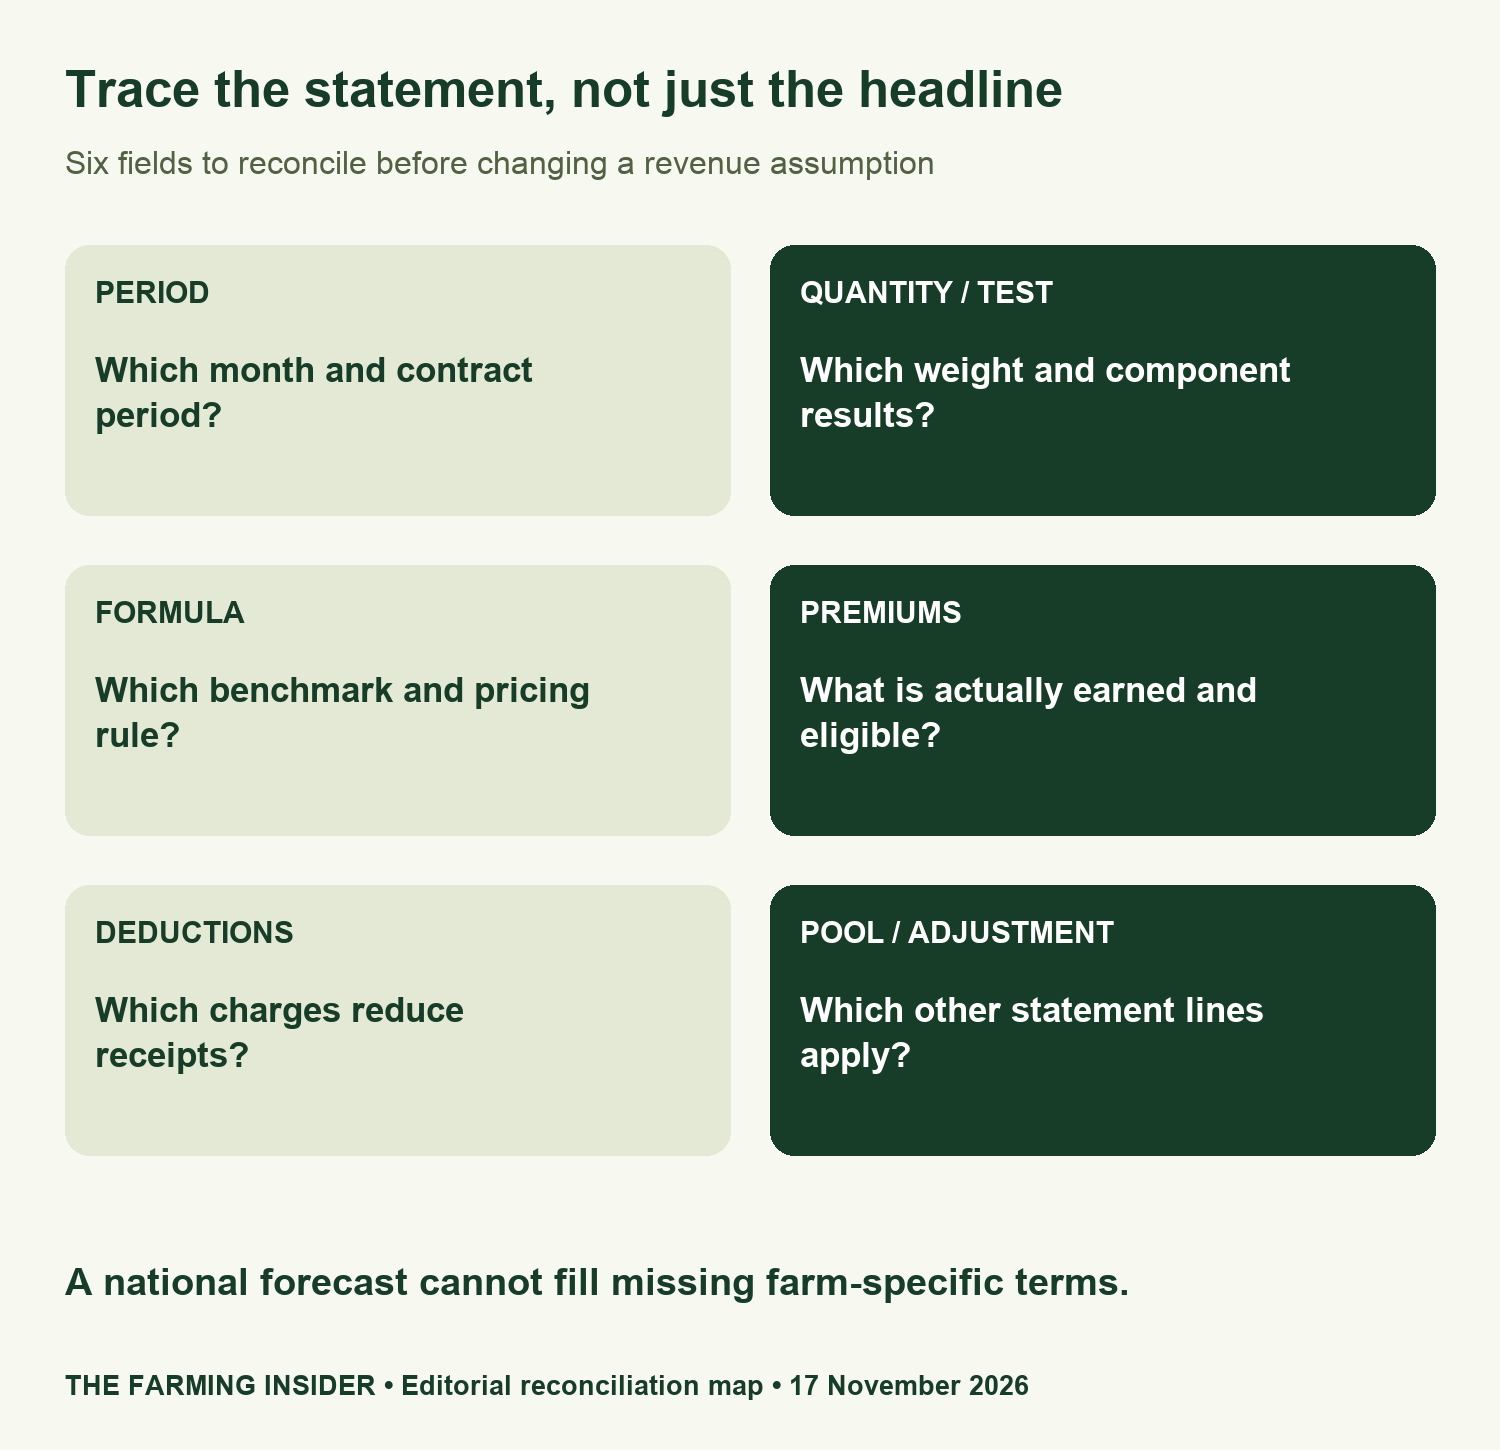
Begin with the statement period and quantity, then identify the test basis and pricing rule. Next, locate each premium, deduction and adjustment rather than assuming the headline benchmark includes them. Record an unresolved question when the document does not explain a line.
For example, a forecast-year annual average should not quietly replace a monthly contract input. Likewise, a premium that depends on eligibility should not enter every scenario automatically. The blank statement map provides fields for those checks without inventing a farm’s values.
Method, limits and four CSV downloads
We transcribed the 2027 October and November columns from printed page 34 and checked the table footnotes on 17 November 2026. Calculations use subtraction at the published precision. Product revisions, milk revisions and the class spread remain separate, with their units and forecast status attached.
This exercise does not estimate an individual payment, margin or hedging outcome. Forecasts can change and costs require separate evidence. Our rice acreage and yield decomposition offers another example of separating a national headline from its underlying measures.
- 2027 dairy forecast source rows (CSV)
- Milk revisions and class-spread arithmetic (CSV)
- Blank milk-statement reconciliation map (CSV)
- Dairy measures and units dictionary (CSV)
Suggested citation: The Farming Insider, “US Dairy Outlook 2027: Read the Class III–Class IV Split Before Updating Assumptions”, 17 November 2026. Primary source: USDA WASDE, 10 November 2026, page 34. Charts and arithmetic by this publication.
Transform Your Agribusiness
Unlock your farm's potential with expert advice tailored to your needs. Get actionable steps that drive real results.
Get Started


