




Kentucky hemp crop diversification research asks a useful question: which existing crop gives up land when hemp expands? The answer matters because the same target share can produce different modelled diversity changes. A diversity score, however, cannot establish an individual farm’s profit, water-quality improvement or best planting choice.
The University of Kentucky’s 26 October 2026 news report highlights potential environmental benefits. Our contribution is a source-linked reading guide with five figures and four CSV downloads. Published scenario results remain separate from an explicitly hypothetical calculation. We ran no planting trial and make no recommendation to cultivate hemp.
What Kentucky hemp crop diversification research measures
The original Park and colleagues paper was first published on 19 June 2026. It uses county-level data from 2009–2023; its simulations cover 85 counties that grew hemp in 2019. The 10% target is an upper-bound counterfactual, not an adoption forecast. Table 2 reports diversity-index changes, not yield percentages.
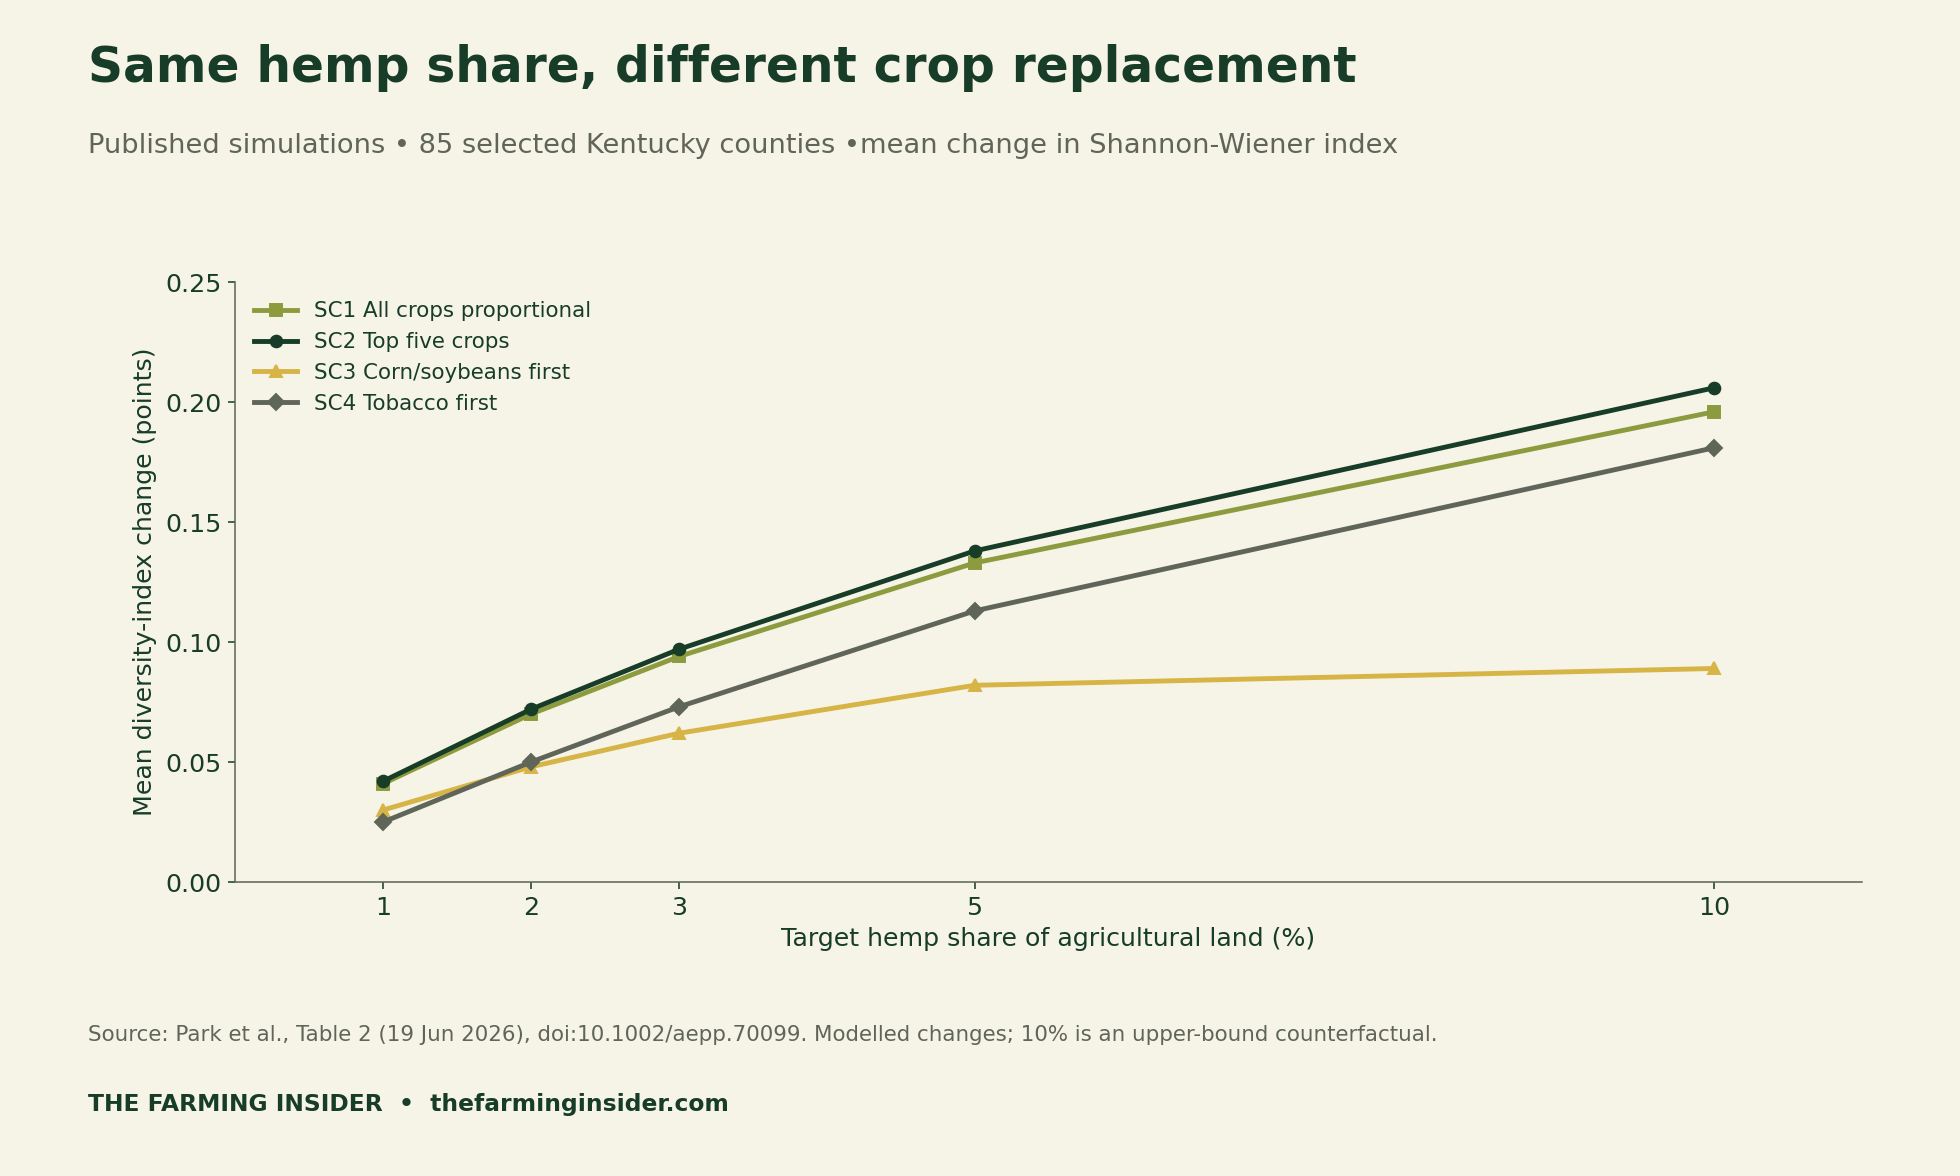
In the top-five-crops scenario, reported mean gains are 0.042, 0.138 and 0.206 index points at 1%, 5% and 10% hemp. Corn-and-soybeans-first gives 0.089 at 10%. These results describe different assumptions, not a causal test of competing farm plans.
Read the replacement rule before reading the headline
The four assumptions are: proportional replacement across all crops; replacement from the five largest crops; corn and soybeans first, then the top five; and tobacco first, then the top five. The downloadable results retain those labels so a copied number does not lose its scenario.
For any scenario chart, ask what remains fixed and what changes. Does the total area change, or only its allocation? Does a label identify the crop displaced, or merely name the new crop? Those questions should travel with the graphic whenever it appears in a presentation or advisory note.
Avoid treating the highest plotted mean as a universal instruction. A graph can compare calculations under stated assumptions without identifying a feasible local choice. Keep the evidence for a modelled outcome separate from evidence about available land, buyers, equipment and your business’s costs.
County variation is not a confidence interval
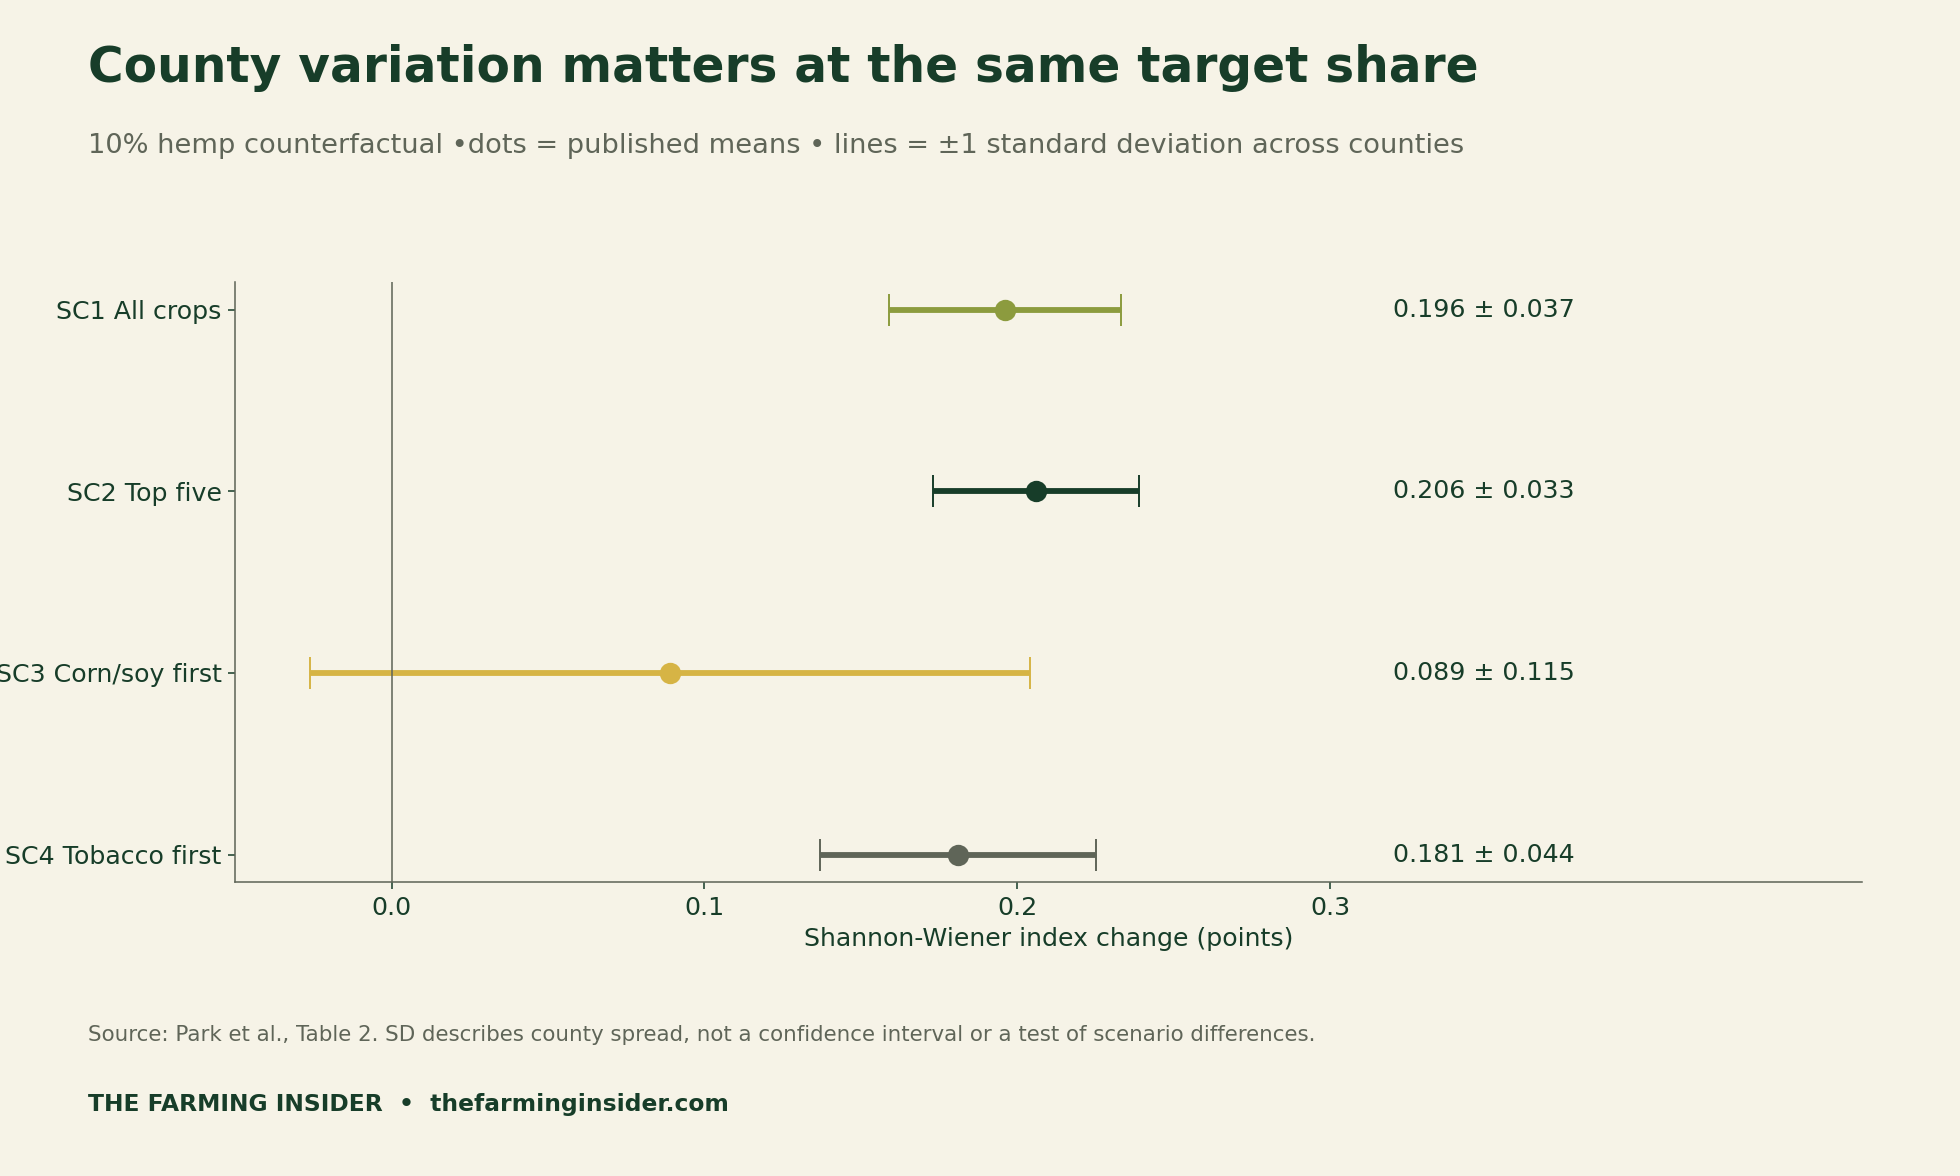
A mean gives a centre, while a spread measure describes variation. When reading a whisker, check its definition before interpreting its width. Standard deviation, standard error and confidence interval answer different questions. Our graphic preserves the source’s definition and does not turn it into a significance test.
The line extending left of zero in the corn-and-soybeans-first row is a symmetric mean-minus-standard-deviation display. It does not reveal the actual minimum county result or the share of counties with negative changes. Those quantities need the underlying distribution; they cannot be recovered from a mean and standard deviation alone.
Calculate crop-share diversity with an explicit example
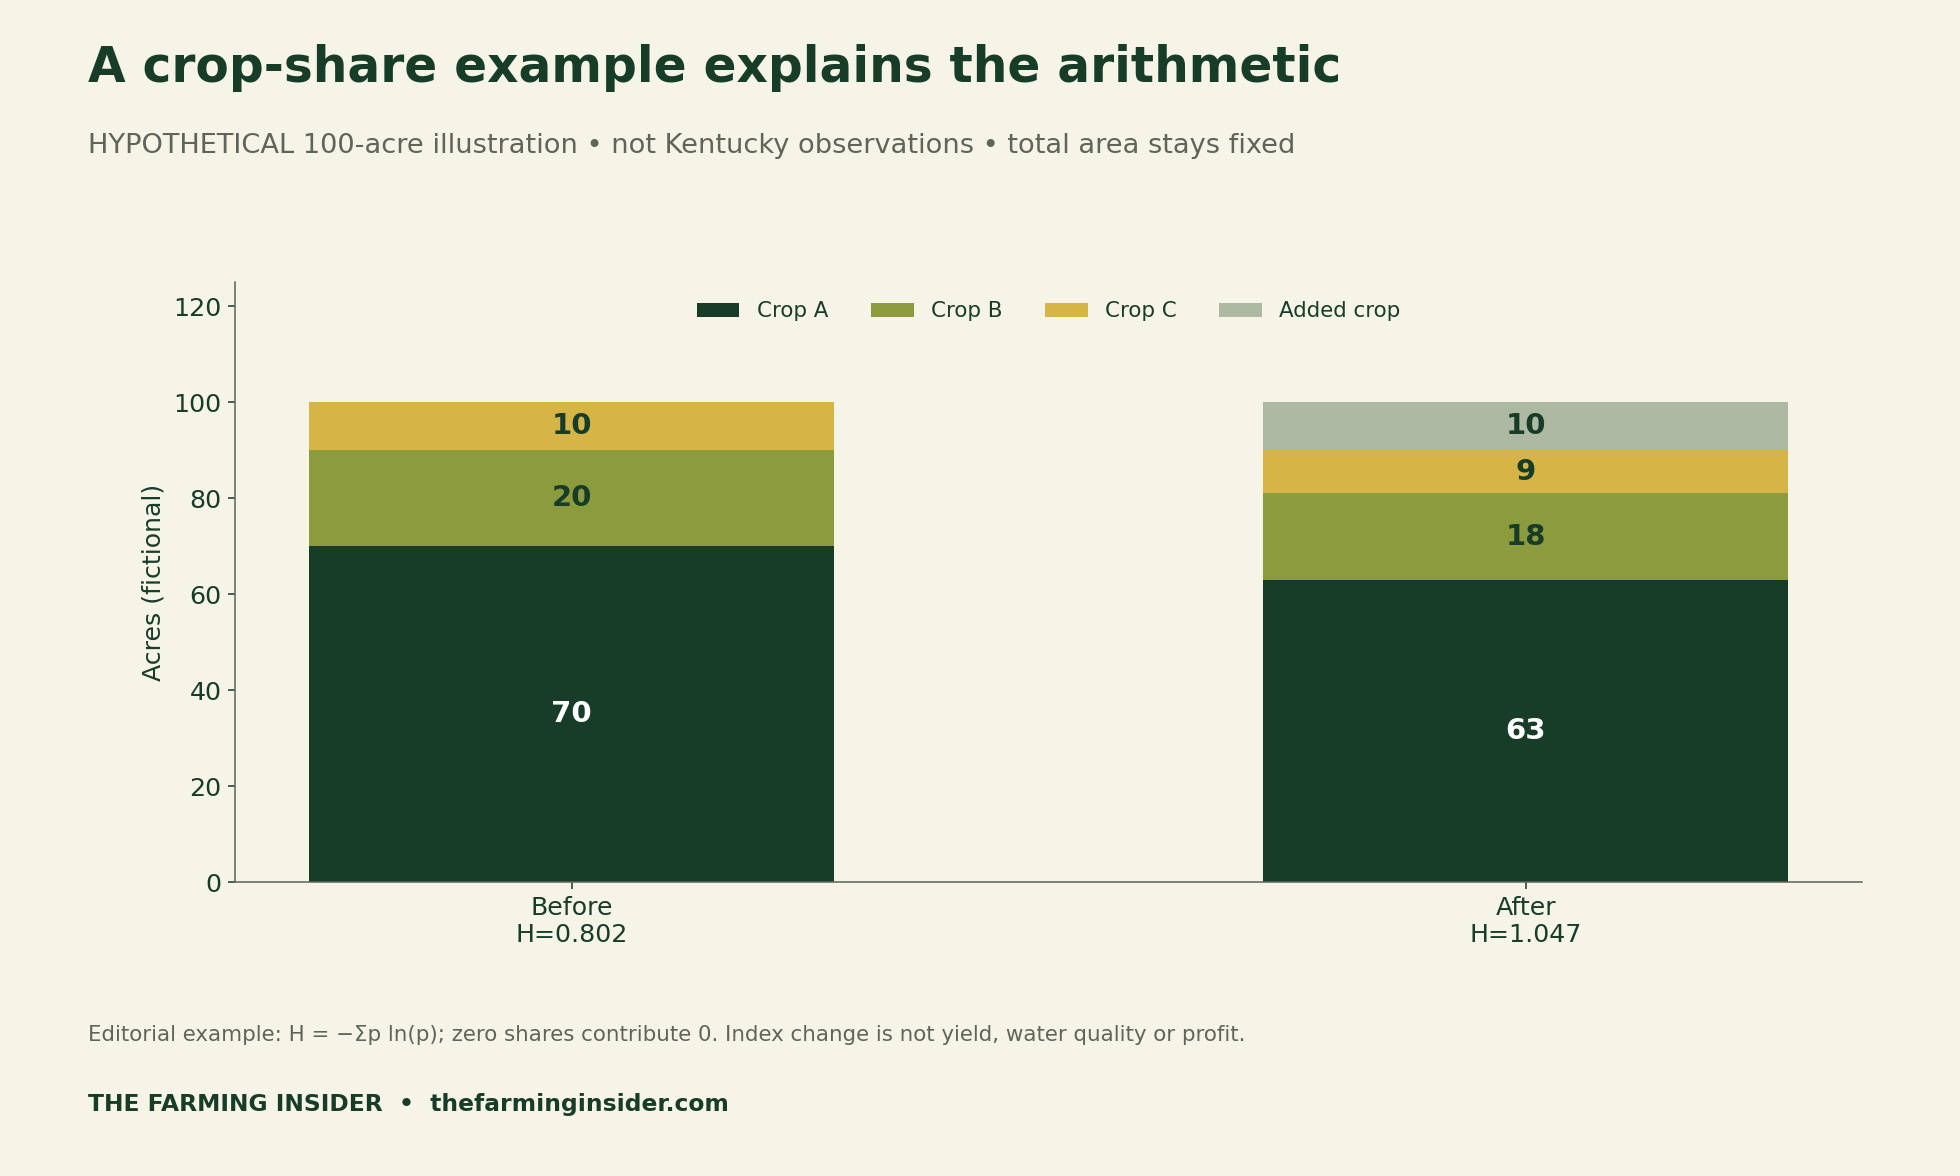
For an independently reproducible illustration, we use H = −Σp ln(p), where p is each crop’s area divided by total area and ln is the natural logarithm. A zero share contributes zero through the limiting convention. Areas must use the same unit, and shares must sum to one. This calculation does not reproduce the paper’s environmental regressions.
Our fictional 100-acre baseline allocates 70, 20 and 10 acres to three unnamed crops. The comparison allocates 63, 18 and nine acres to them, plus 10 acres to an added crop. Both totals remain 100. H moves from approximately 0.802 to 1.047, a change of 0.245 index points. These are teaching inputs, not Kentucky observations.
The blank register asks for before and after areas, units, totals and the source of each entry. Preserve the original inputs before testing an alternative. If totals differ, resolve the denominator before interpreting the index change. Do not silently treat an unknown area as zero or mix acreage with hectares in one total.
The added crop is deliberately unnamed. The example shows what the formula does when crop shares change, without claiming any crop’s yield, input needs or market value. A higher index could accompany a poor financial result. It could also leave a specific environmental outcome unmeasured.
Separate the evidence layers from farm cash returns
The study combines simulations, statistical associations and transferred non-market valuations. Dissolved-oxygen and nitrogen relationships are statistically inconclusive in relevant analyses. It is not a randomised planting trial. Its valuations are not payments to farmers, and the authors warn against adding outcome-specific values into one environmental total.
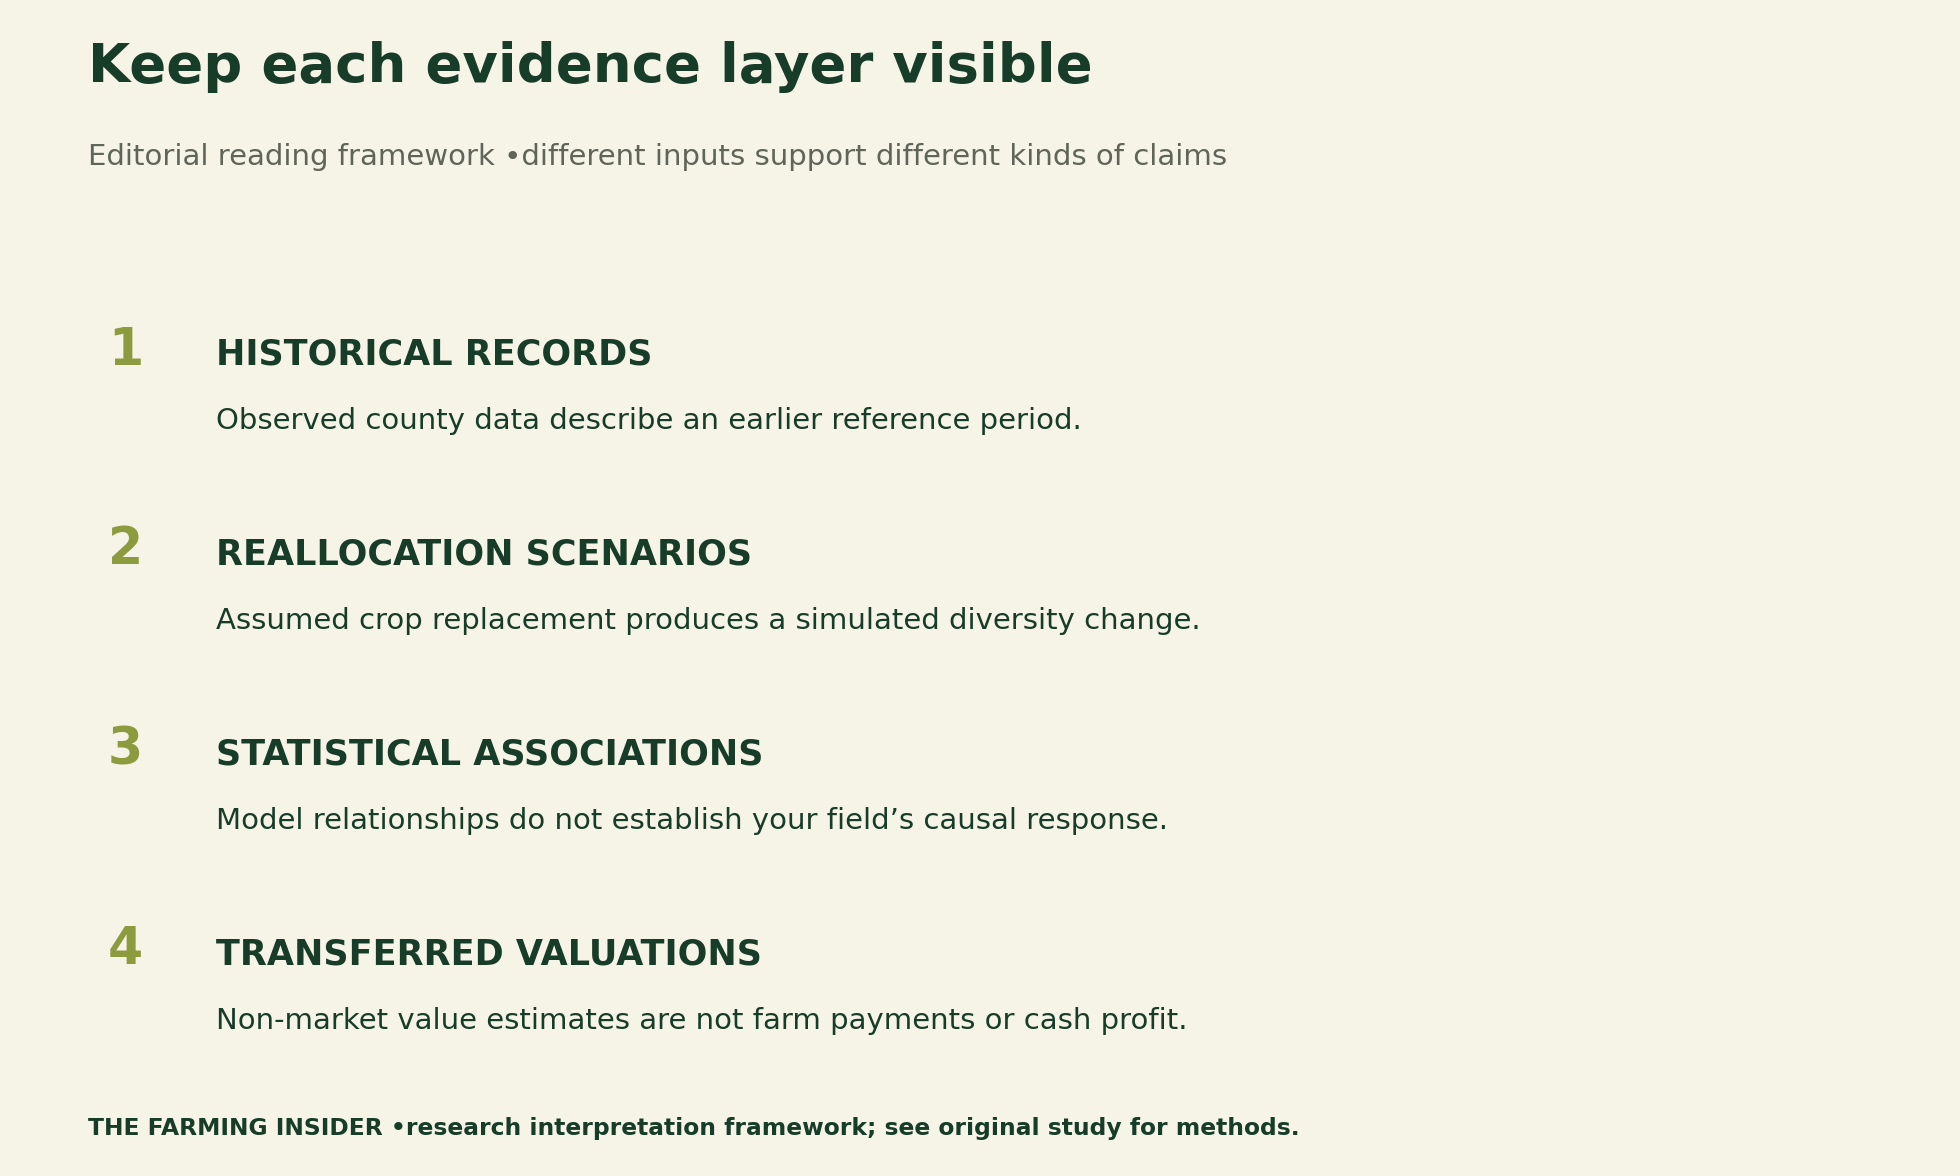
A practical reading note can use separate columns for a claim, its unit, its supporting evidence and what remains unknown. For instance, a diversity-index change and a bank receipt would belong in different rows. Attaching a currency symbol to an environmental valuation does not convert it into business revenue.
Transform Your Agribusiness
Unlock your farm's potential with expert advice tailored to your needs. Get actionable steps that drive real results.
Get StartedQuestions a diversity score cannot answer
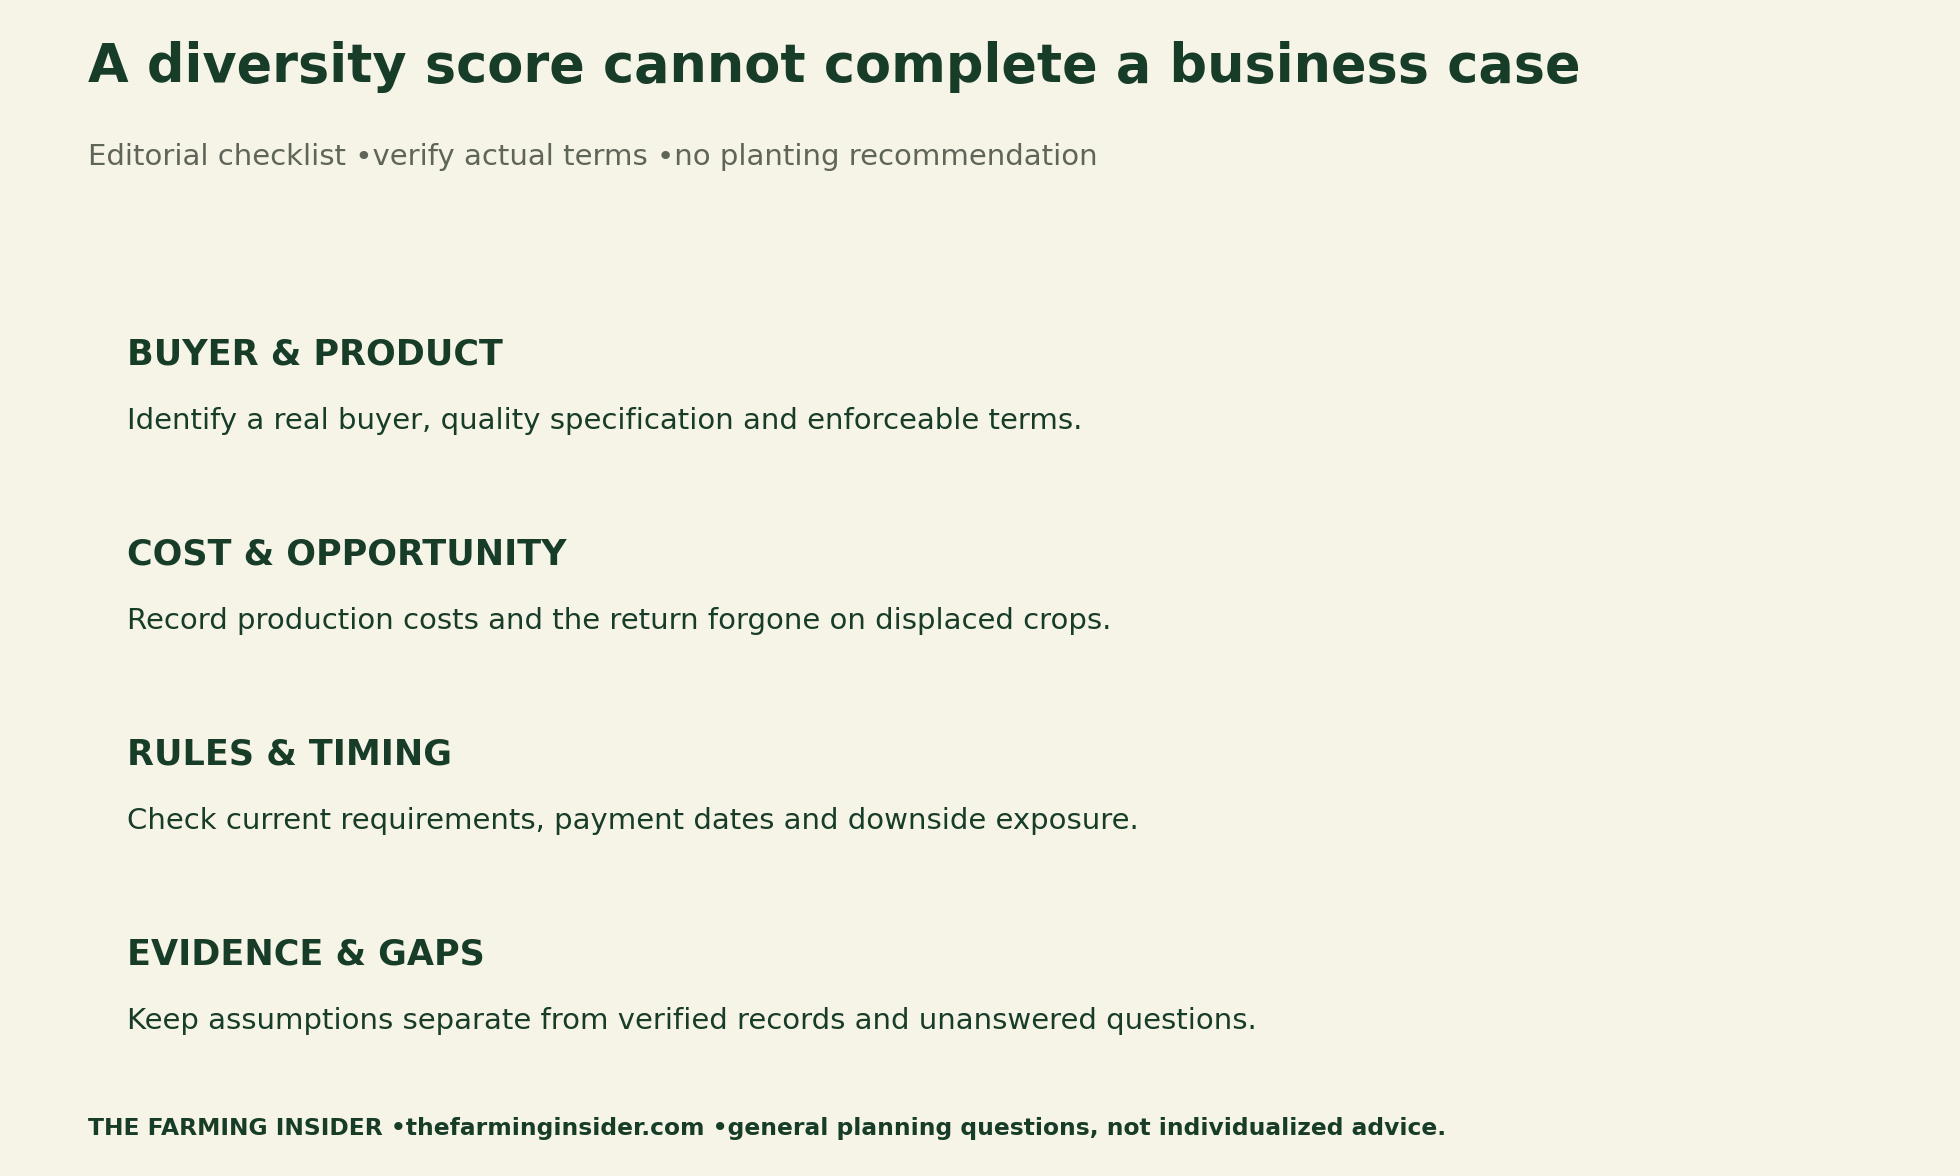

Before applying any diversification story to a business, verify its intended product and buyer terms. Record the costs of production, handling and transport, plus the return forgone on the displaced crop. Keep payment dates and downside cases visible. Leave a field unresolved when no reliable evidence is available.
Use the University of Kentucky licensing and regulatory resource to locate official guidance, and check the current requirements with the appropriate authority. This article does not determine legal compliance. Our orchard validation guide and forecast version-control report provide related methods for preserving evidence and assumptions.
Download the results and reusable tools
- Published scenario means and county standard deviations (CSV)
- Hypothetical crop-share calculation inputs (CSV)
- Blank crop-share and evidence register (CSV)
- Blank commercial-feasibility questions (CSV)
Methods, limitations and citation
The Farming Insider checked the linked sources on 29 October 2026. We transcribed the published rounded Table 2 Shannon-Wiener means and county standard deviations, kept scenario labels attached and independently calculated the fictional example. Source microdata were not obtained, so this is a chart reconstruction and methods illustration rather than a replication of the full analysis.
No growers, buyers or advisers were contacted. Suggested citation: The Farming Insider (29 October 2026), Kentucky Hemp Crop Diversification Research: What the Scenarios Show. Cite Park and colleagues for published results. Identify our unnamed-crop example as hypothetical and retain its limits when reusing it.


